Executive Summary
In this report, we rank and analyze the largest and most active private equity (PE) investors in Europe.
We take a novel approach to our ranking, which is based on total managed enterprise value (EV) in Europe. Ranking by managed EV, rather than funds raised, enables us to focus on investors’ European portfolio, allowing us to dive deep into specific regions and sectors of investment.
Further, this approach helps us capture large and active investors who do not follow traditional fundraising cycles/structures and are often overlooked.
Key takeaways from our analysis:
KKR has emerged as the #1 investor in Europe, managing a total estimated EV of €104bn, followed by EQT (€90bn) and CVC (€83bn). Other investors in the top 10 include Blackstone (€81bn), Ardian (€60bn), Partners Group (€55bn), Hg (€54bn), Carlyle (€50bn), GIC (€48bn) and Brookfield Asset Management (€46bn).
Collectively, the top 250 private equity firms in Europe manage an EV of €2.5tn across 5,803 assets. Despite its significant size, the aggregated Europe 250 EV is just 11% of the ~€23 trillion Europe’s public equity market.
The Europe 250 landscape is concentrated at the upper end, with the top 25 investors managing 48% of the Europe 250 EV. Investors established in the 1990s or before manage 74% of the total EV. US and UK HQ’d investors manage 56% of the aggregate EV.
Leading the sector rankings are Hg (TMT), KKR (Services), EQT (Science & Health), Carlyle (Energy & Materials), Triton (Industrials), GIC (Financial Services) and 3i Group (Consumer). Consumer and TMT stand out as the sectors with the most number of sector specialists.
Leading the regional rankings are KKR (UK&I), Advent (DACH), Ardian (France), 3i Group (Benelux), EQT (Nordics), Blackstone (Italy), Cinven (Iberia) and PPF (CEE). Nordics, CEE and France stand out as the most domestic PE markets in Europe with strong local investor presence.
By deal count, Hg, Waterland, CVC and Ardian have the highest overall PE activity in Europe. CD&R, CVC and KKR rank among the largest employers in Europe while Hg, TA Associates and CPP stand out for their high-growth, high-margin portfolios.


Chapter 01: Europe 250 Ranking
KKR has emerged as the largest private equity investor in Europe, managing a total estimated EV of €104bn, followed by EQT (managing an EV of €90bn) and CVC (€83bn).
Other investors in the top 10 include Blackstone (€81bn), Ardian (€60bn), Partners Group (€55bn), Hg (€54bn), Carlyle (€50bn), GIC (€48bn) and Brookfield Asset Management (€46bn).
Collectively, the top 250 investors in Europe manage an estimated EV of €2.5tn. On average, they have a portfolio EBITDA of €100m and manage 29 companies each.
Over the last 6 years, Europe 250 investors have invested in nearly twice as many new portfolio companies as they have exited. Specifically, there have been 6,136 new investments and 3,165 exits among these sponsors.
The table below lists all the top 250 investors in Europe. Use the search bar or the arrows at the top to navigate through the ranking.
Dominant Investor HQs
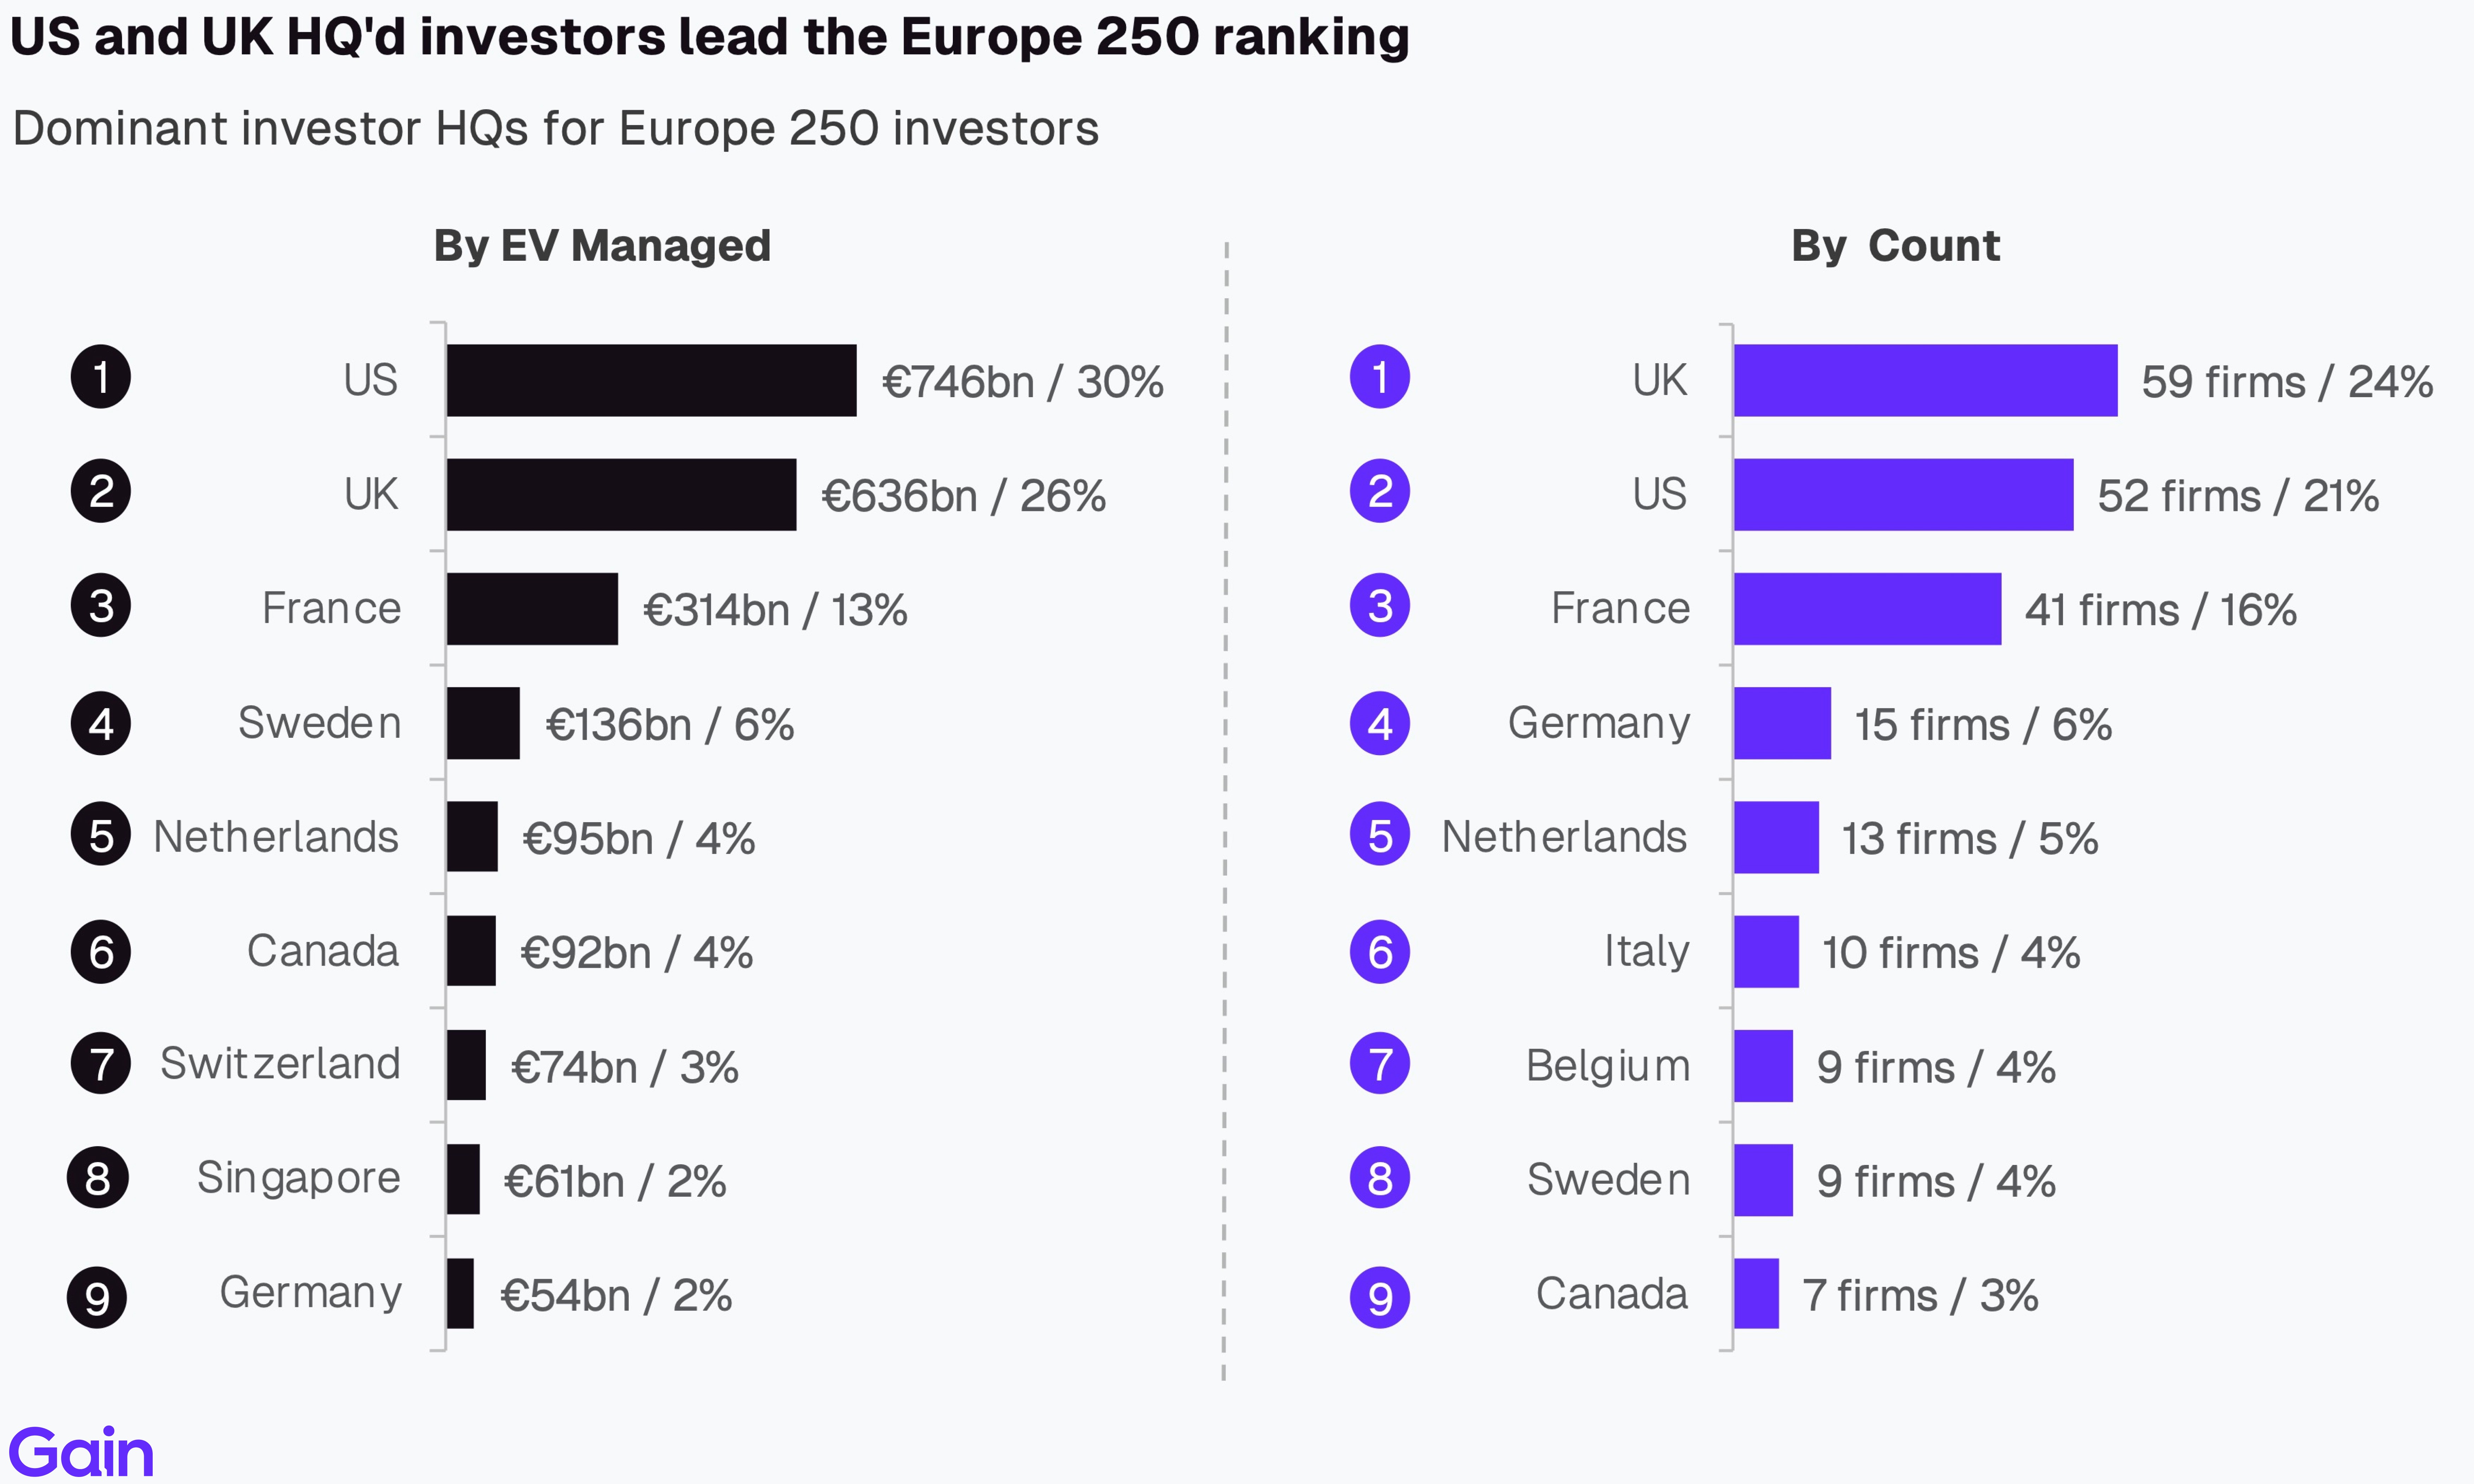
European HQ'd investors lead the Europe 250 ranking, managing 59% of the total aggregate EV. North American HQ'd investors are close behind, managing 34% of the aggregate EV. Activity from North American investors is predominantly focused on larger assets.

By country, US and UK investors dominate the Europe 250 ranking. Sponsors headquartered in those countries manage an EV of €746bn (30% share) and €636bn (26%), respectively. German-based investors are underrepresented in the ranking despite Germany being Europe's largest economy, managing an EV of €54bn (2%).
By city, London is the largest hub for the Europe 250 investors, followed by Paris, New York, Munich and Stockholm. The largest 3 metropolises constitute ~44% of all HQs followed by the long tail of other large European and North American cities.
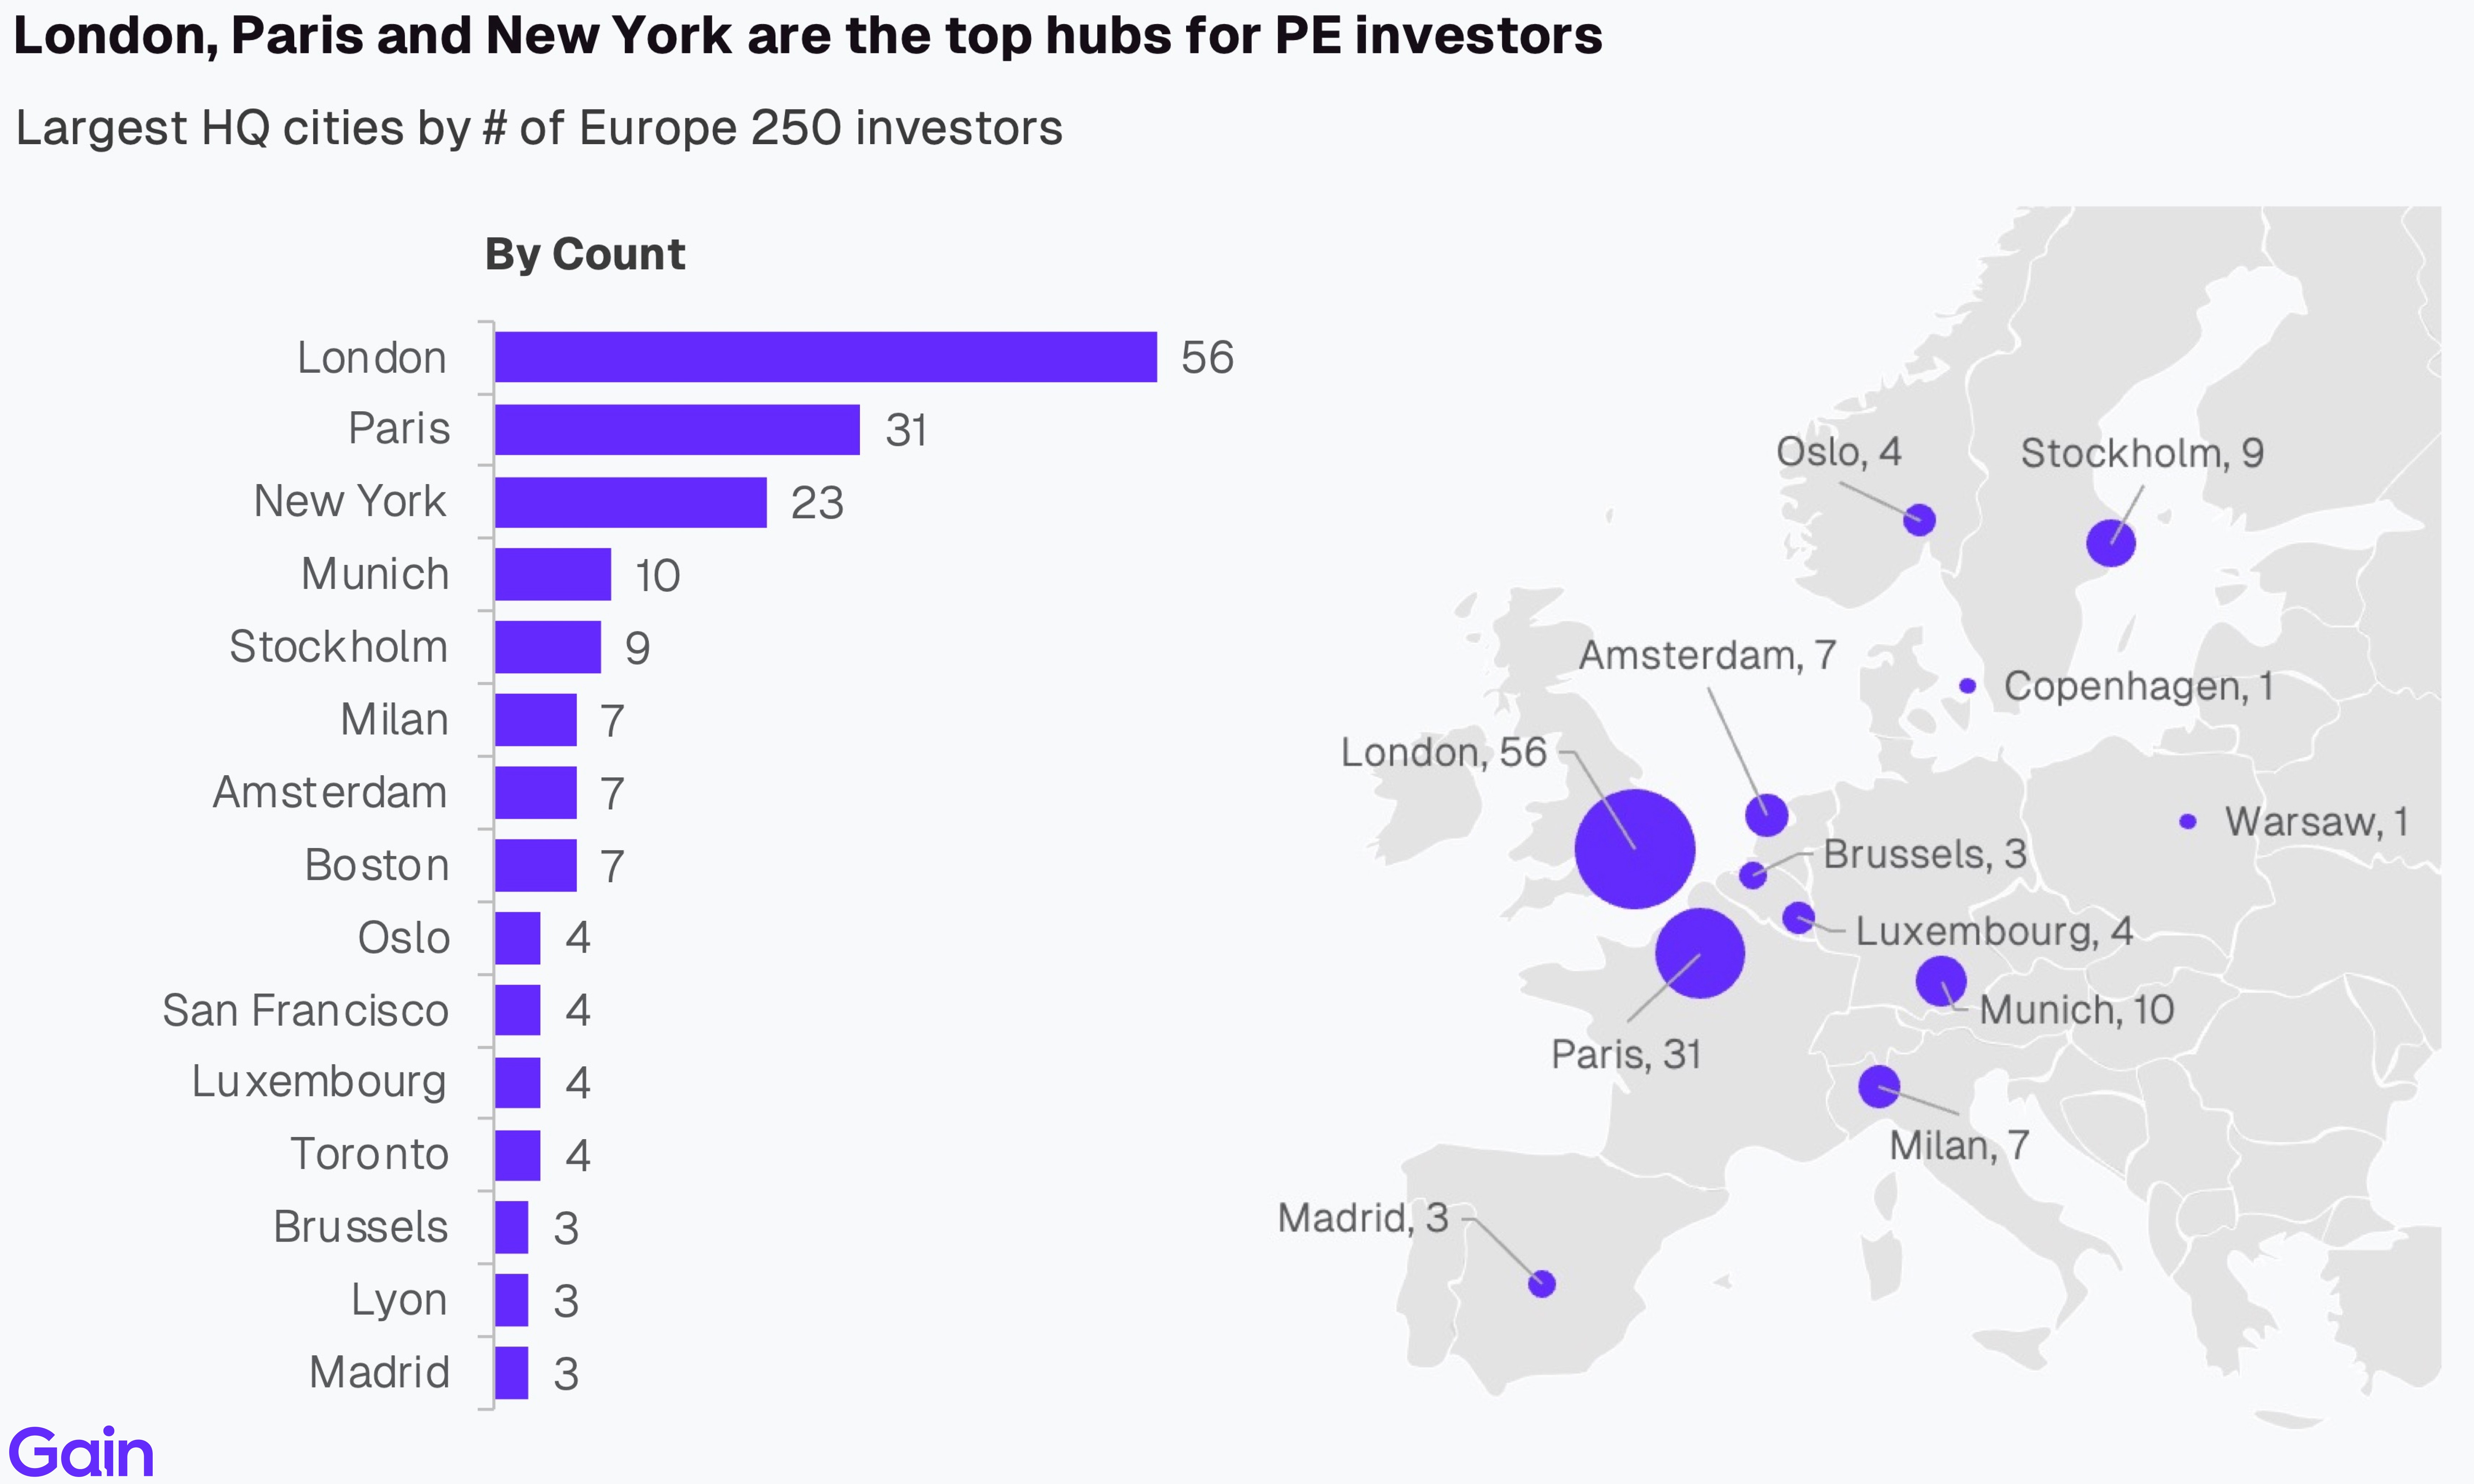
Only a few large investors in the ranking are domiciled outside the US, UK or France. Notable ones are EQT (€90bn EV, Stockholm), Partners Group (€55bn, Zug), GIC (€47bn, Singapore), Macquarie (€32bn, Sydney), Waterland (€25bn, Bussum), CPP Investments (€24bn, Toronto), Nordic Capital (€21bn, Stockholm) and CDP Equity (€12bn, Rome).

Investor Concentration
The Europe 250 landscape is concentrated at the upper end. The top 25 investors manage nearly half (48%) of total EV (€1,173bn). Private equity firms, like other large asset managers, benefit from inherent scale advantages and recent fundraising trends have also favored larger investors. While concentration is increasing in PE, the market still remains less concentrated compared to public asset management or the advisory landscape.

Private equity remains a scale game, which takes time and commitment to build. This is evidenced by the distribution of managed EV based on investors' founding year. Investors established in the 1990s or before manage 74% of the total EV. 13 out of the top 15 largest private equity firms in the Europe 250 ranking were founded during or before the 1990s. Hg and Bridgepoint, both spun out around 2000, stand out as larger and relatively younger entrants.

Despite its significant size, the European private equity market remains small compared to the European public equities market. Europe 250 investors manage €2.5 trillion in enterprise value — just 11% of the ~€23 trillion European public equity market.
Despite its significant size, the European private equity market remains small compared to the European public equities market. Europe 250 investors manage €2.5 trillion in enterprise value — just 11% of the ~€23 trillion European public equity market.

Chapter 02: Sector 50 Rankings
This table showcases the top 50 private equity firms ranked by sectors across Europe. Use the buttons to navigate between the sector rankings.
Top Investors
Leading the sector rankings are Hg (TMT), KKR (Services), EQT (Science & Health), Carlyle (Energy & Materials), Triton (Industrials), GIC (Financial Services) and 3i Group (Consumer). Hg in TMT and 3i Group in Consumer predominantly target those sectors, representing 82% and 77% of their portfolio EV, respectively.

Sector Insights
By sector, Services is the largest PE sector in Europe (20% of EV), followed closely by TMT (17%) and Consumer (16%). Combined, these three sectors account for over half of the total Europe PE market EV. At the subsector level, the largest ones are Manufacturing (9%), Software (8%), Professional Services (8%), Energy (7%) and Technical Services (6%).

UK&I is the largest region of investment for most sectors. Its share is highest in Financial Services (59% by EV), Infrastructure (37%), Services (33%), TMT (32%) and Consumer (26%). DACH, on the other hand, dominates in both Industrials and Energy & Materials at 30% and 28%, respectively, reflecting Germany's strong manufacturing and industrials prowess.
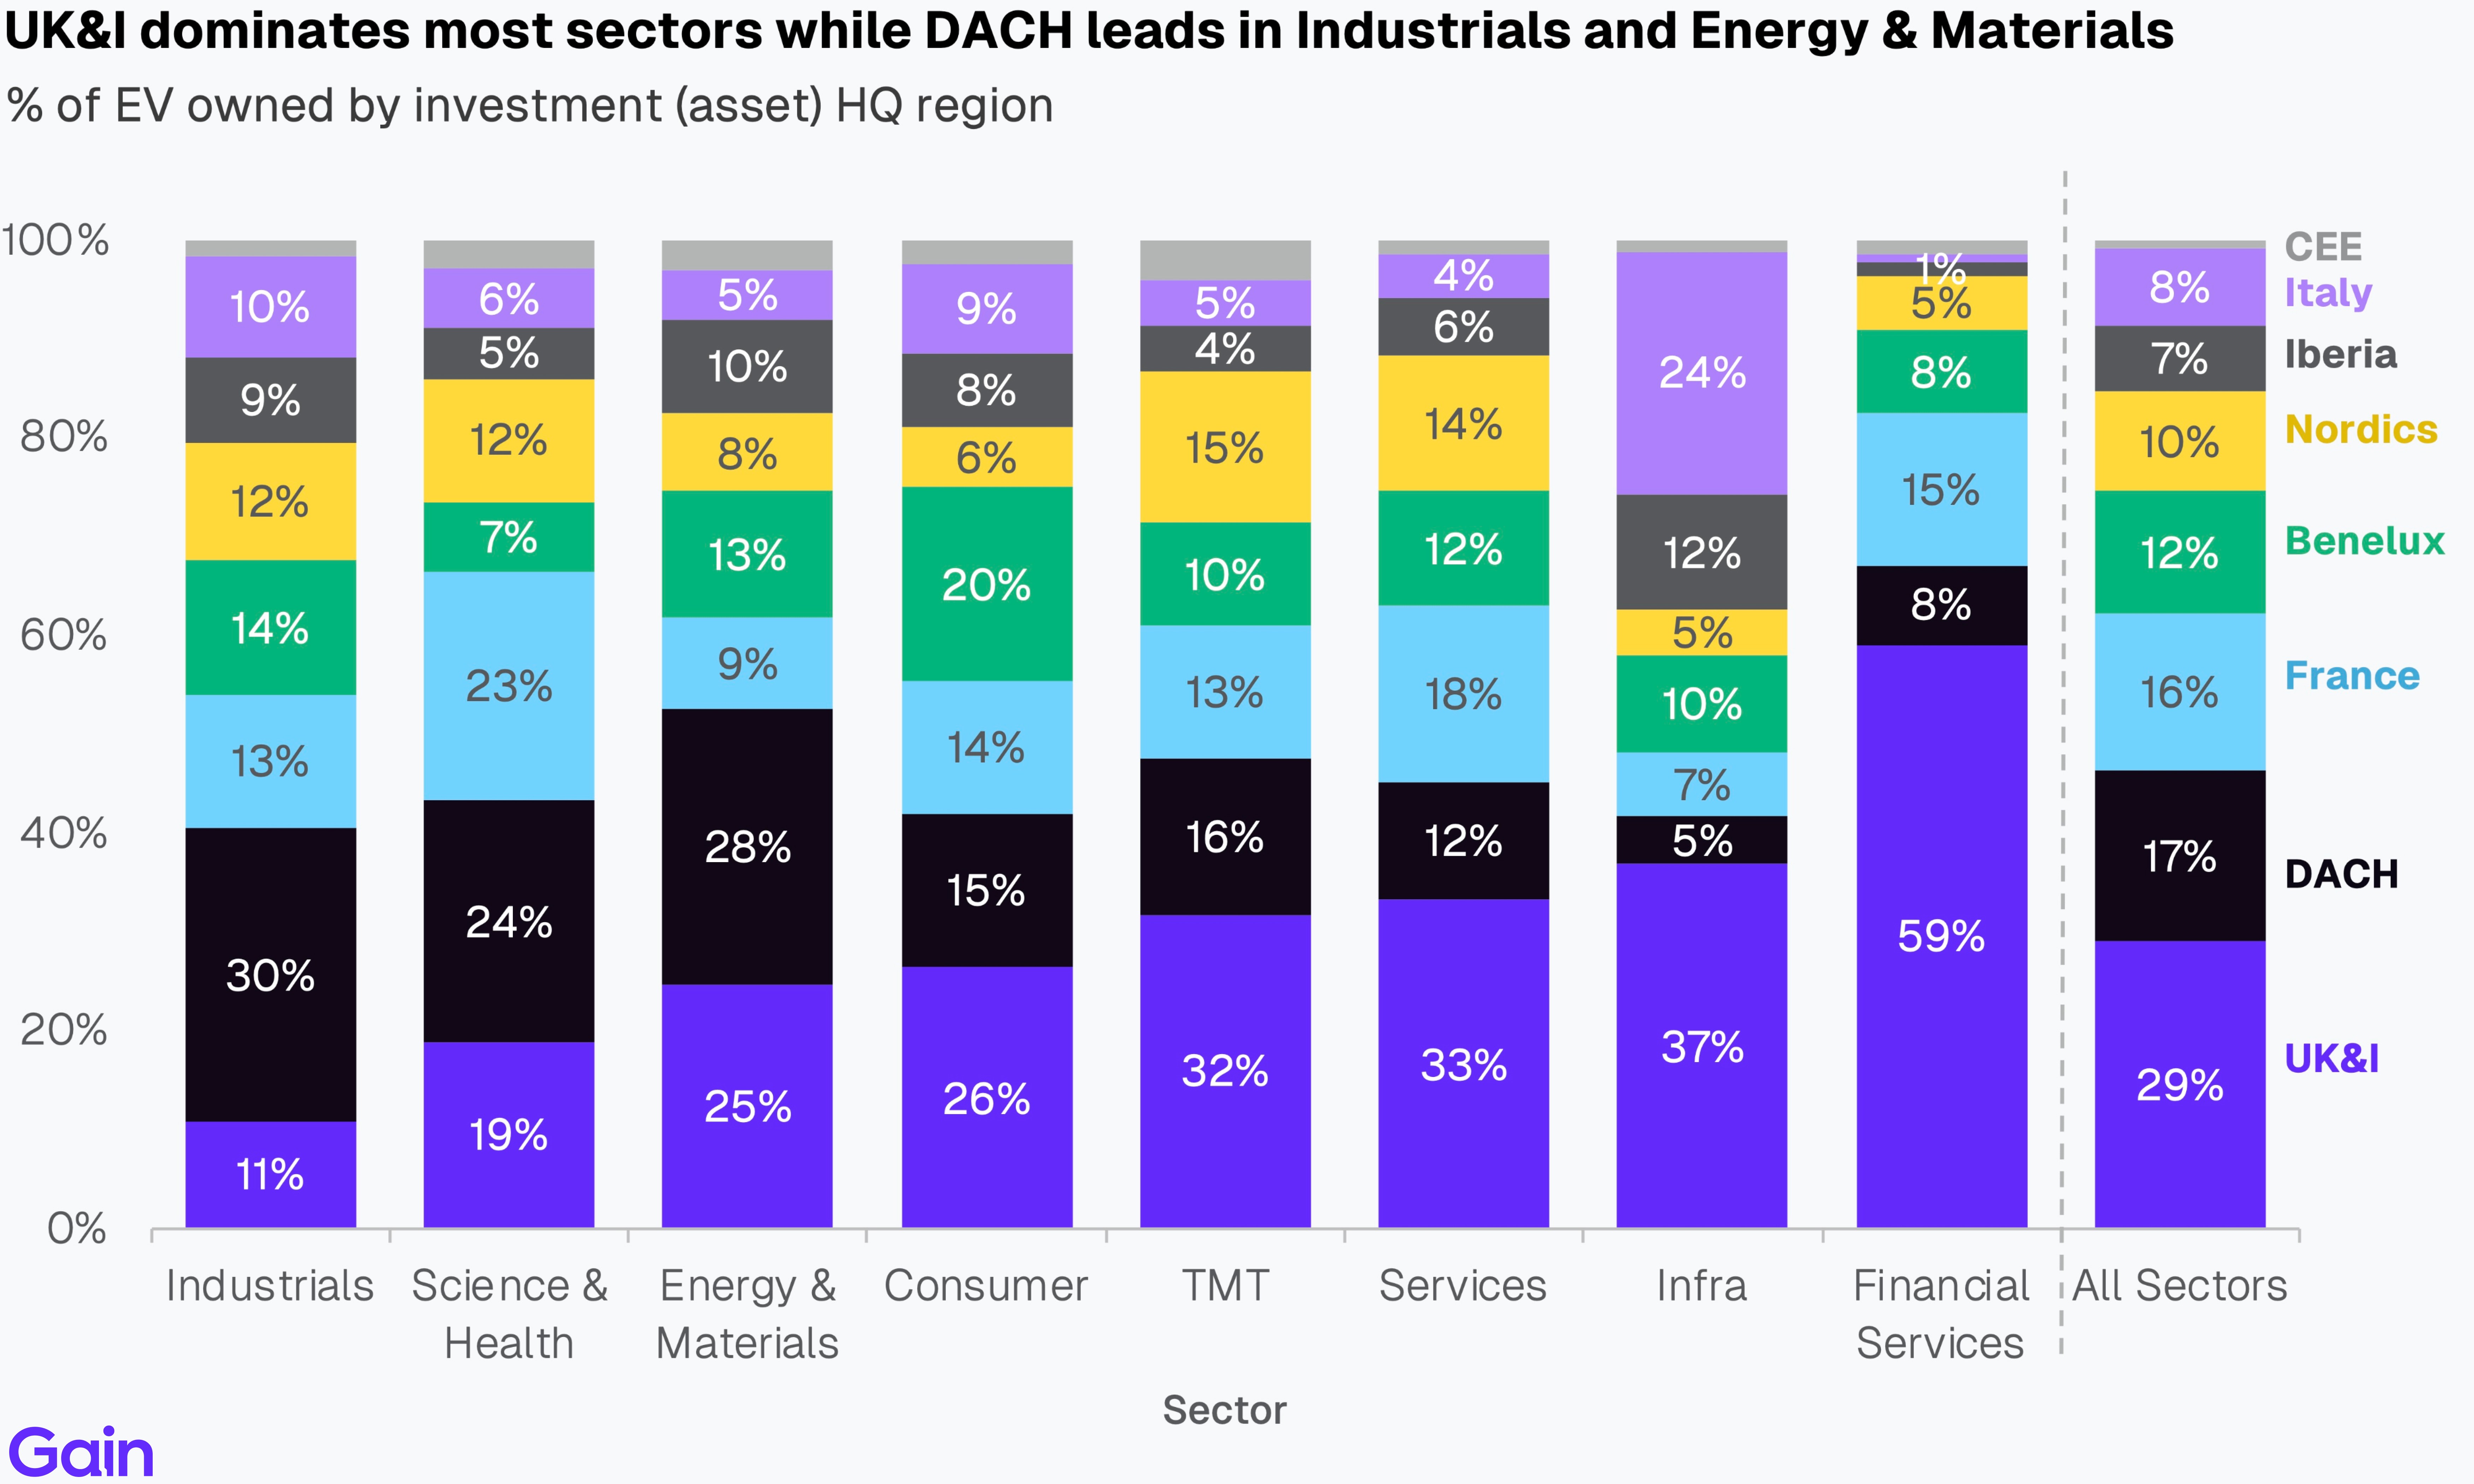
Compared to their European counterparts, North American investors invest more in TMT, Energy & Materials, Financial Services and Infrastructure. They aren’t as active in Science & Health, Industrials, Services and Consumer, where European investors make up for the majority of the EV.

Sponsor-to-sponsor transactions dominate across all sectors. Science & Health shows the highest share of sponsor-to-sponsor activity at 62%. While, carve-outs are more popular in Energy & Materials (35%), Infrastructure (27%) and Industrials (25%), driven by large-scale conglomerates divesting assets to realign strategic focus. Public-to-private activity is highest in Infrastructure (19%), followed by TMT (17%) and Financial Services (14%). Family-to-sponsor transactions show relatively consistent distribution across sectors.

15% of TMT PE-backed assets were previously VC-backed, representing a natural progression of ownership as companies mature and require additional capital. Beyond TMT, subsectors such as Biotech, Banking and MedTech also show a higher share of formerly VC-backed assets.

Sponsor Consolidation
Infrastructure, Energy & Materials and Consumer are the most concentrated sectors in terms of investor ownership, with Infrastructure leading at 31% of sector EV managed by top 5 investors. In contrast, Industrials, Services and Financial Services exhibit a broader investor base, with the top 5 for an average of 14% of sector EV, indicating more distributed ownership across multiple investors.

Consumer has the highest proportion of EV managed by sector specialists at 45%, driven by focused investors like 3i Group, PAI Partners and TDR Capital. TMT follows close behind at 36%, with specialists such as Hg, Vista Equity Partners and TA Associates. Science & Health shows the lowest specialist concentration at 25%.

Mega-funds dominate investments in Consumer (61% by EV) and TMT (53%), reflecting large concentrated allocations in those sectors. In contrast, mid-market investors have higher presence in Industrials (31%) and Services (28%), while Infrastructure (33%) and Energy (20%) show the highest SWF/public capital presence.

Chapter 03: Region 50 Rankings
This table showcases the top 50 private equity firms ranked by region across Europe. Use the buttons to navigate between the regional rankings.
Top Investors
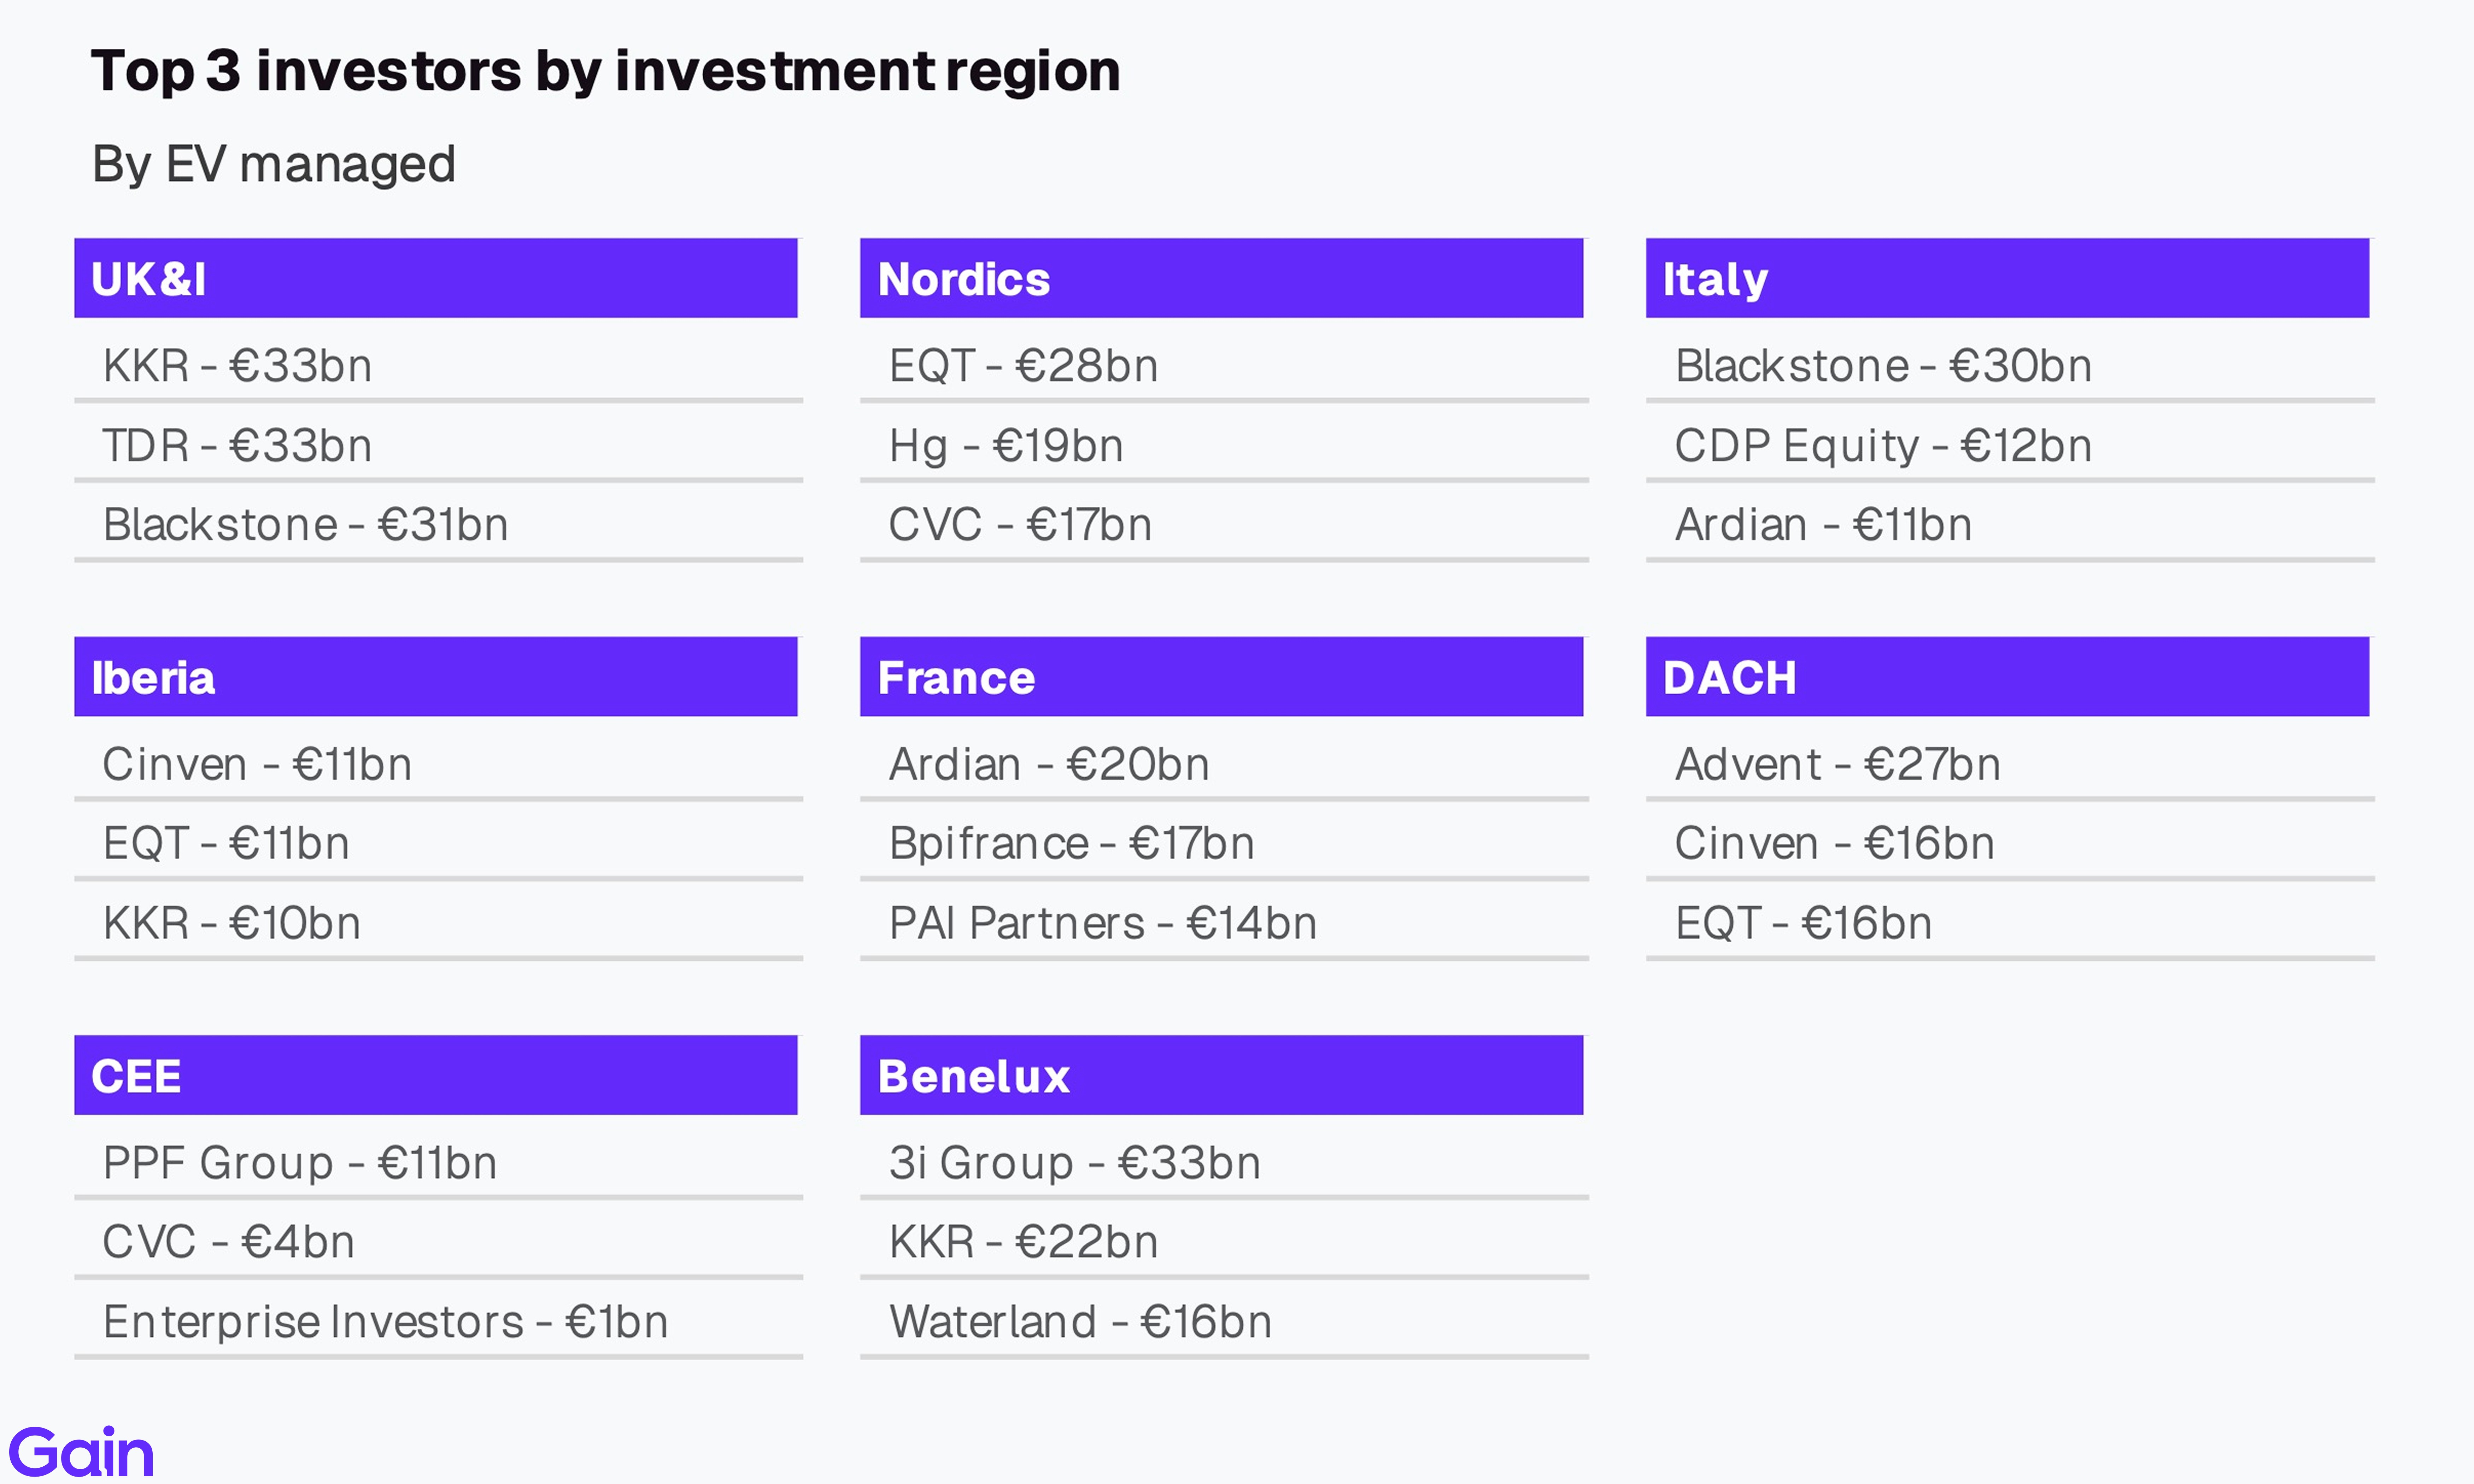
Leading the rankings in each region are KKR (UK&I), Advent (DACH), Ardian (France), 3i Group (Benelux), EQT (Nordics), Blackstone (Italy), Cinven (Iberia) and PPF (CEE). KKR and EQT also stand out as investors with a top 3 presence across multiple regions.
Regional Insights
UK&I (29%), DACH (17%) and France (14%) together account for 60% of European private equity EV. These large regions are followed by Benelux at 12% and Nordics at 11%.
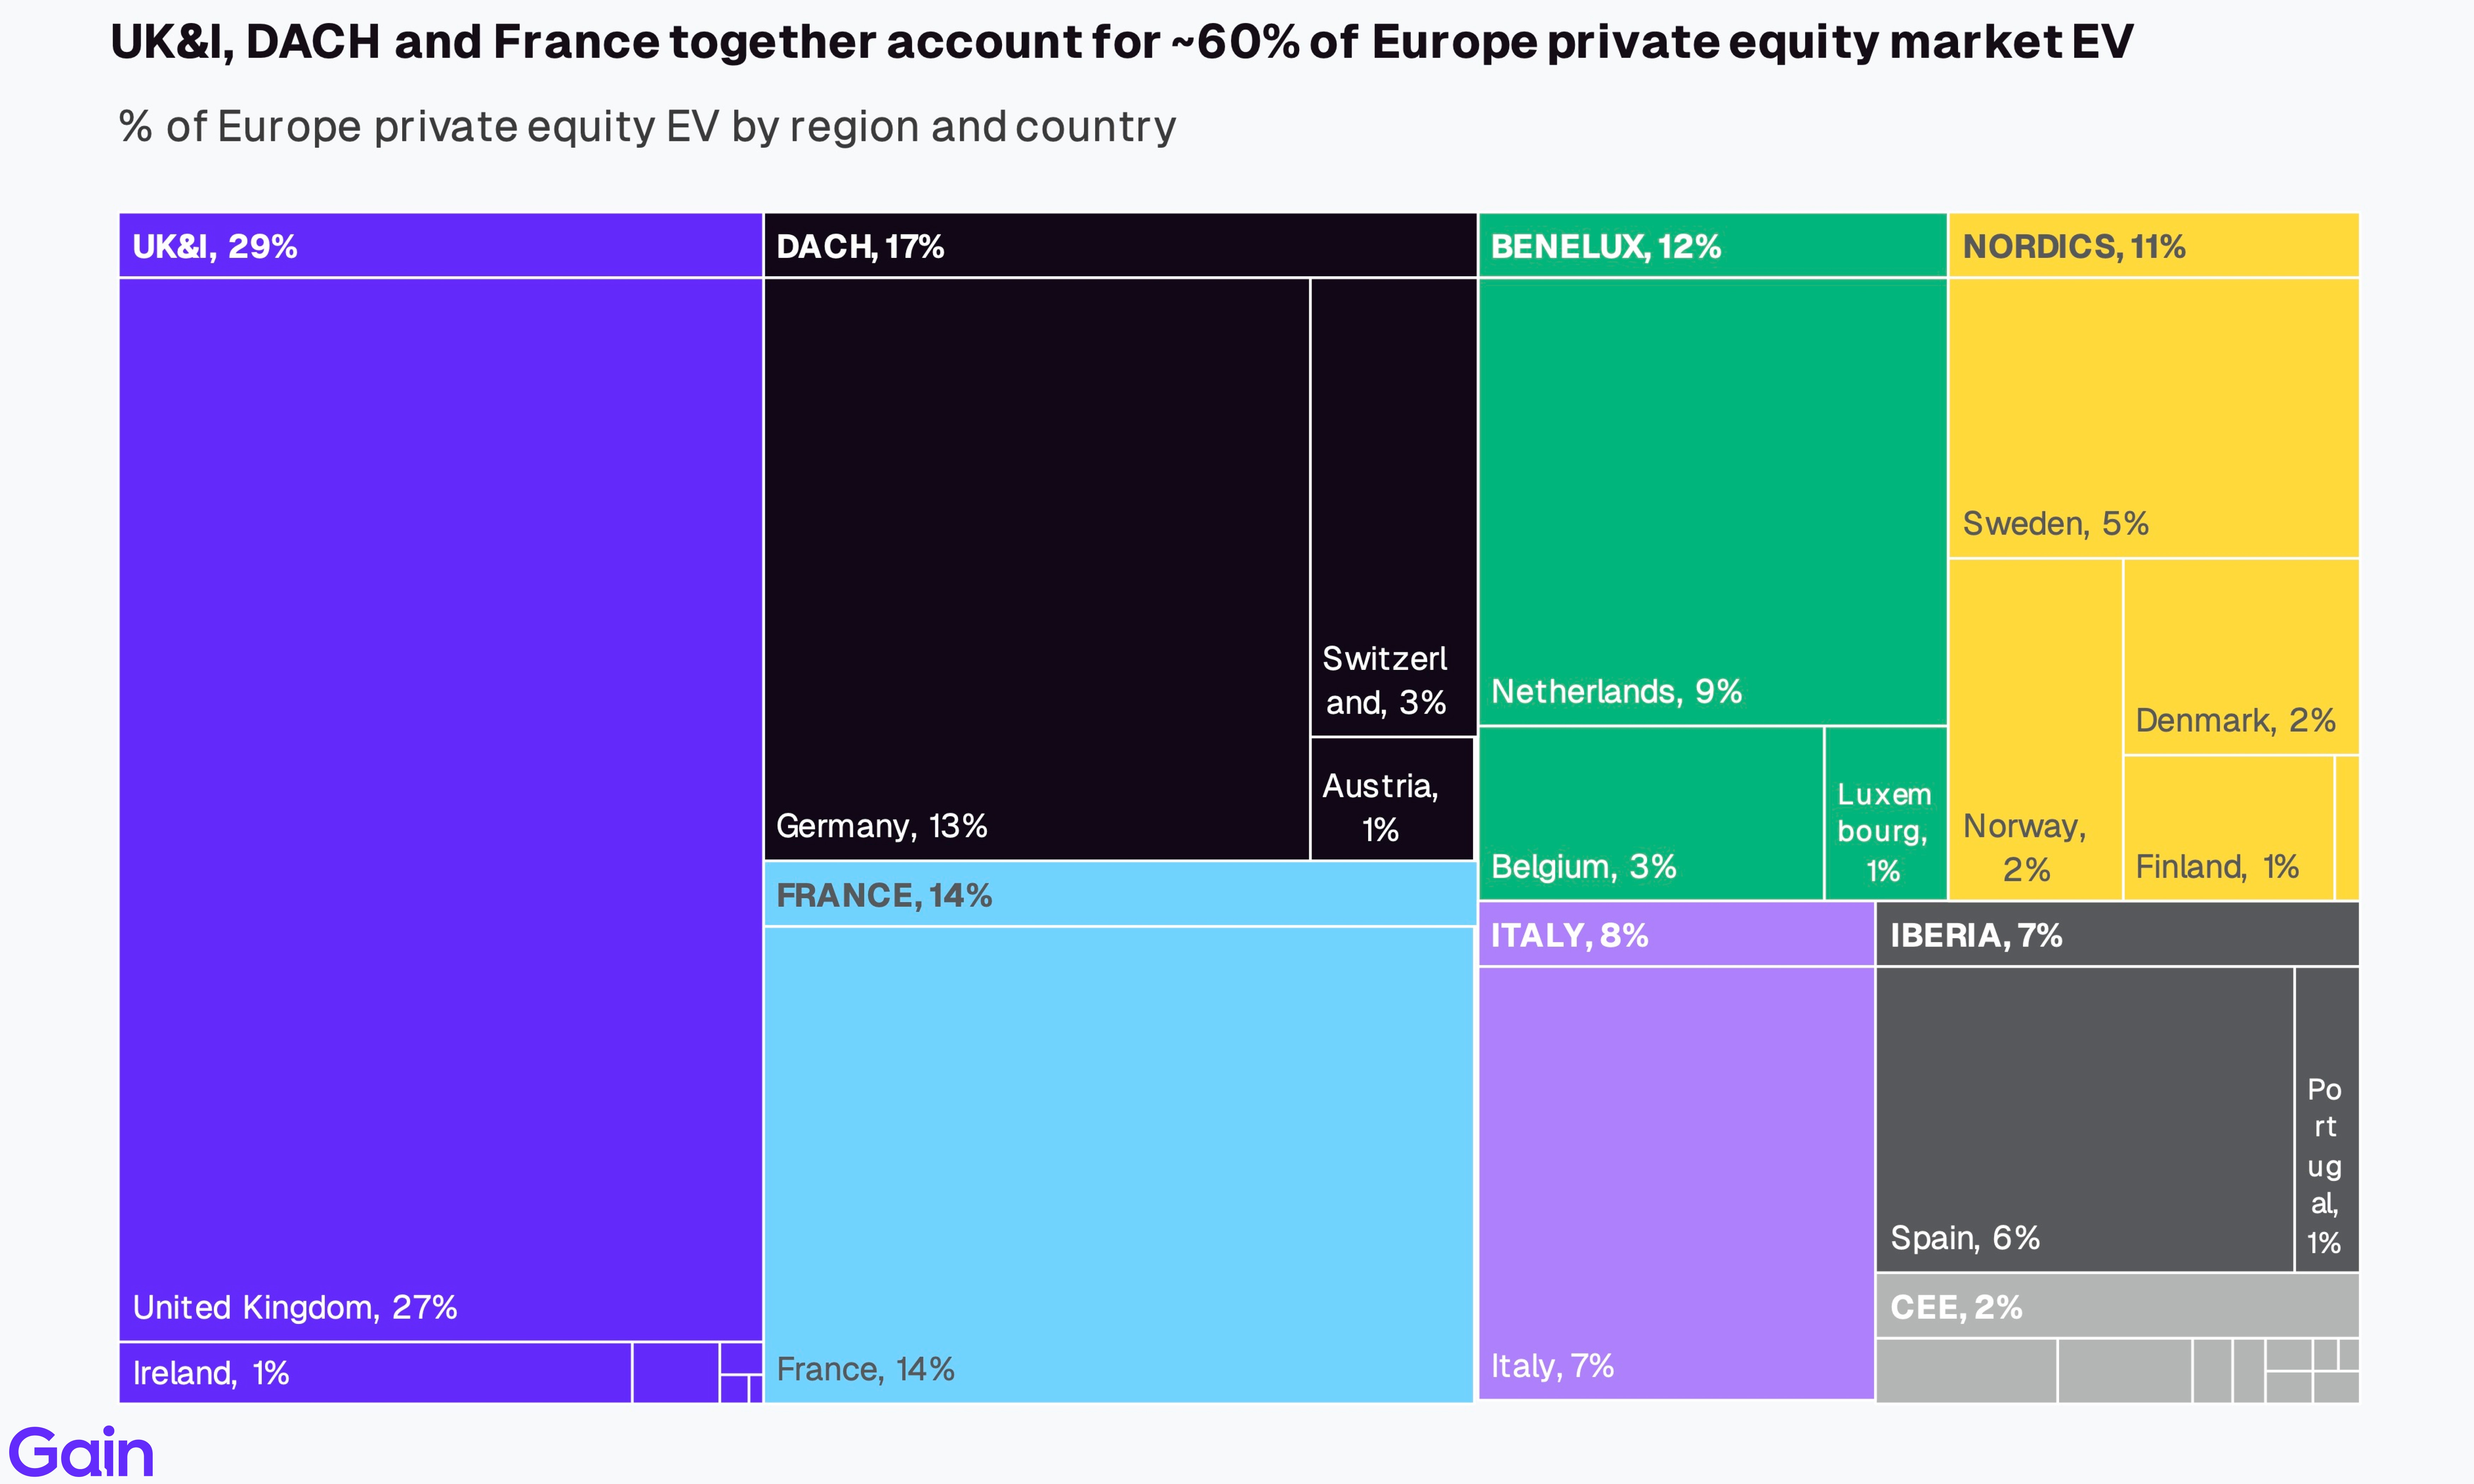
Nordics, CEE and France are the most domestic PE markets in Europe, driven by strong local investor presence. In contrast, UK & Ireland is the most international, with over 43% of EV owned by North American investors. Iberia, Italy and DACH, on the other hand, show significantly lower domestic investor participation with only a handful of large local funds.

By sector, Services is the largest sector of investment in UK&I, France and Nordics. In DACH, Industrials dominates while in Benelux and Iberia, Consumer takes the top spot. TMT whose share has been growing, ranks as the #2 or #3 sector across many major markets (UK&I, DACH, France, Benelux and Nordics).

By city, London, Paris, Stockholm, Milan and Madrid stand out as the leading destinations of investments. Many large Services, TMT and Consumer businesses are headquartered there. Investments in DACH, on the other hand, are more spread out across Munich, Berlin and Hamburg with no one city being the major hub.

France (8%), UK&I (7%) and Nordics (7%) show the highest VC-to-PE transition rates. Italy (2%), Benelux (3%) and DACH (4%) exhibit minimal VC-to-PE activity, reflecting nascent venture capital ecosystems in these regions.

Sponsor Consolidation
UK&I and DACH are the two most valuable markets in terms of total EV managed by PE investors. The UK has strong Finance, Tech and Services sectors while DACH is known for its industrial prowess. Both markets have well-established investment ecosystems, making them attractive to international investors.

France has the lowest concentration of investment from mega-funds. Only 38% of French EV is managed by them, compared to ~50-60% across other regions. In contrast, there is a higher share of mid-market (31%) and large-cap funds (20%) in the region.

Chapter 04: Portfolio Benchmarking
In this section, we explore the investment portfolios of the top 30 PE investors in Europe, analyzing key metrics such as growth rates, profitability, buy-and-build activity, holding periods, EBITDA range and the sector/regional makeup of their European investments.
Note: We exclude from this analysis investors who have fewer than 5 data points for a particular metric.
By Deal Activity
Hg, Waterland, CVC and Ardian have the highest overall PE activity in Europe. In addition to their platform investments, they are also among the most active buy-and-build investors in Europe (~300-400 add-ons). In contrast, Apollo, Brookfield Asset Management and TDR Capital pursue a more concentrated strategy with fewer overall transactions.

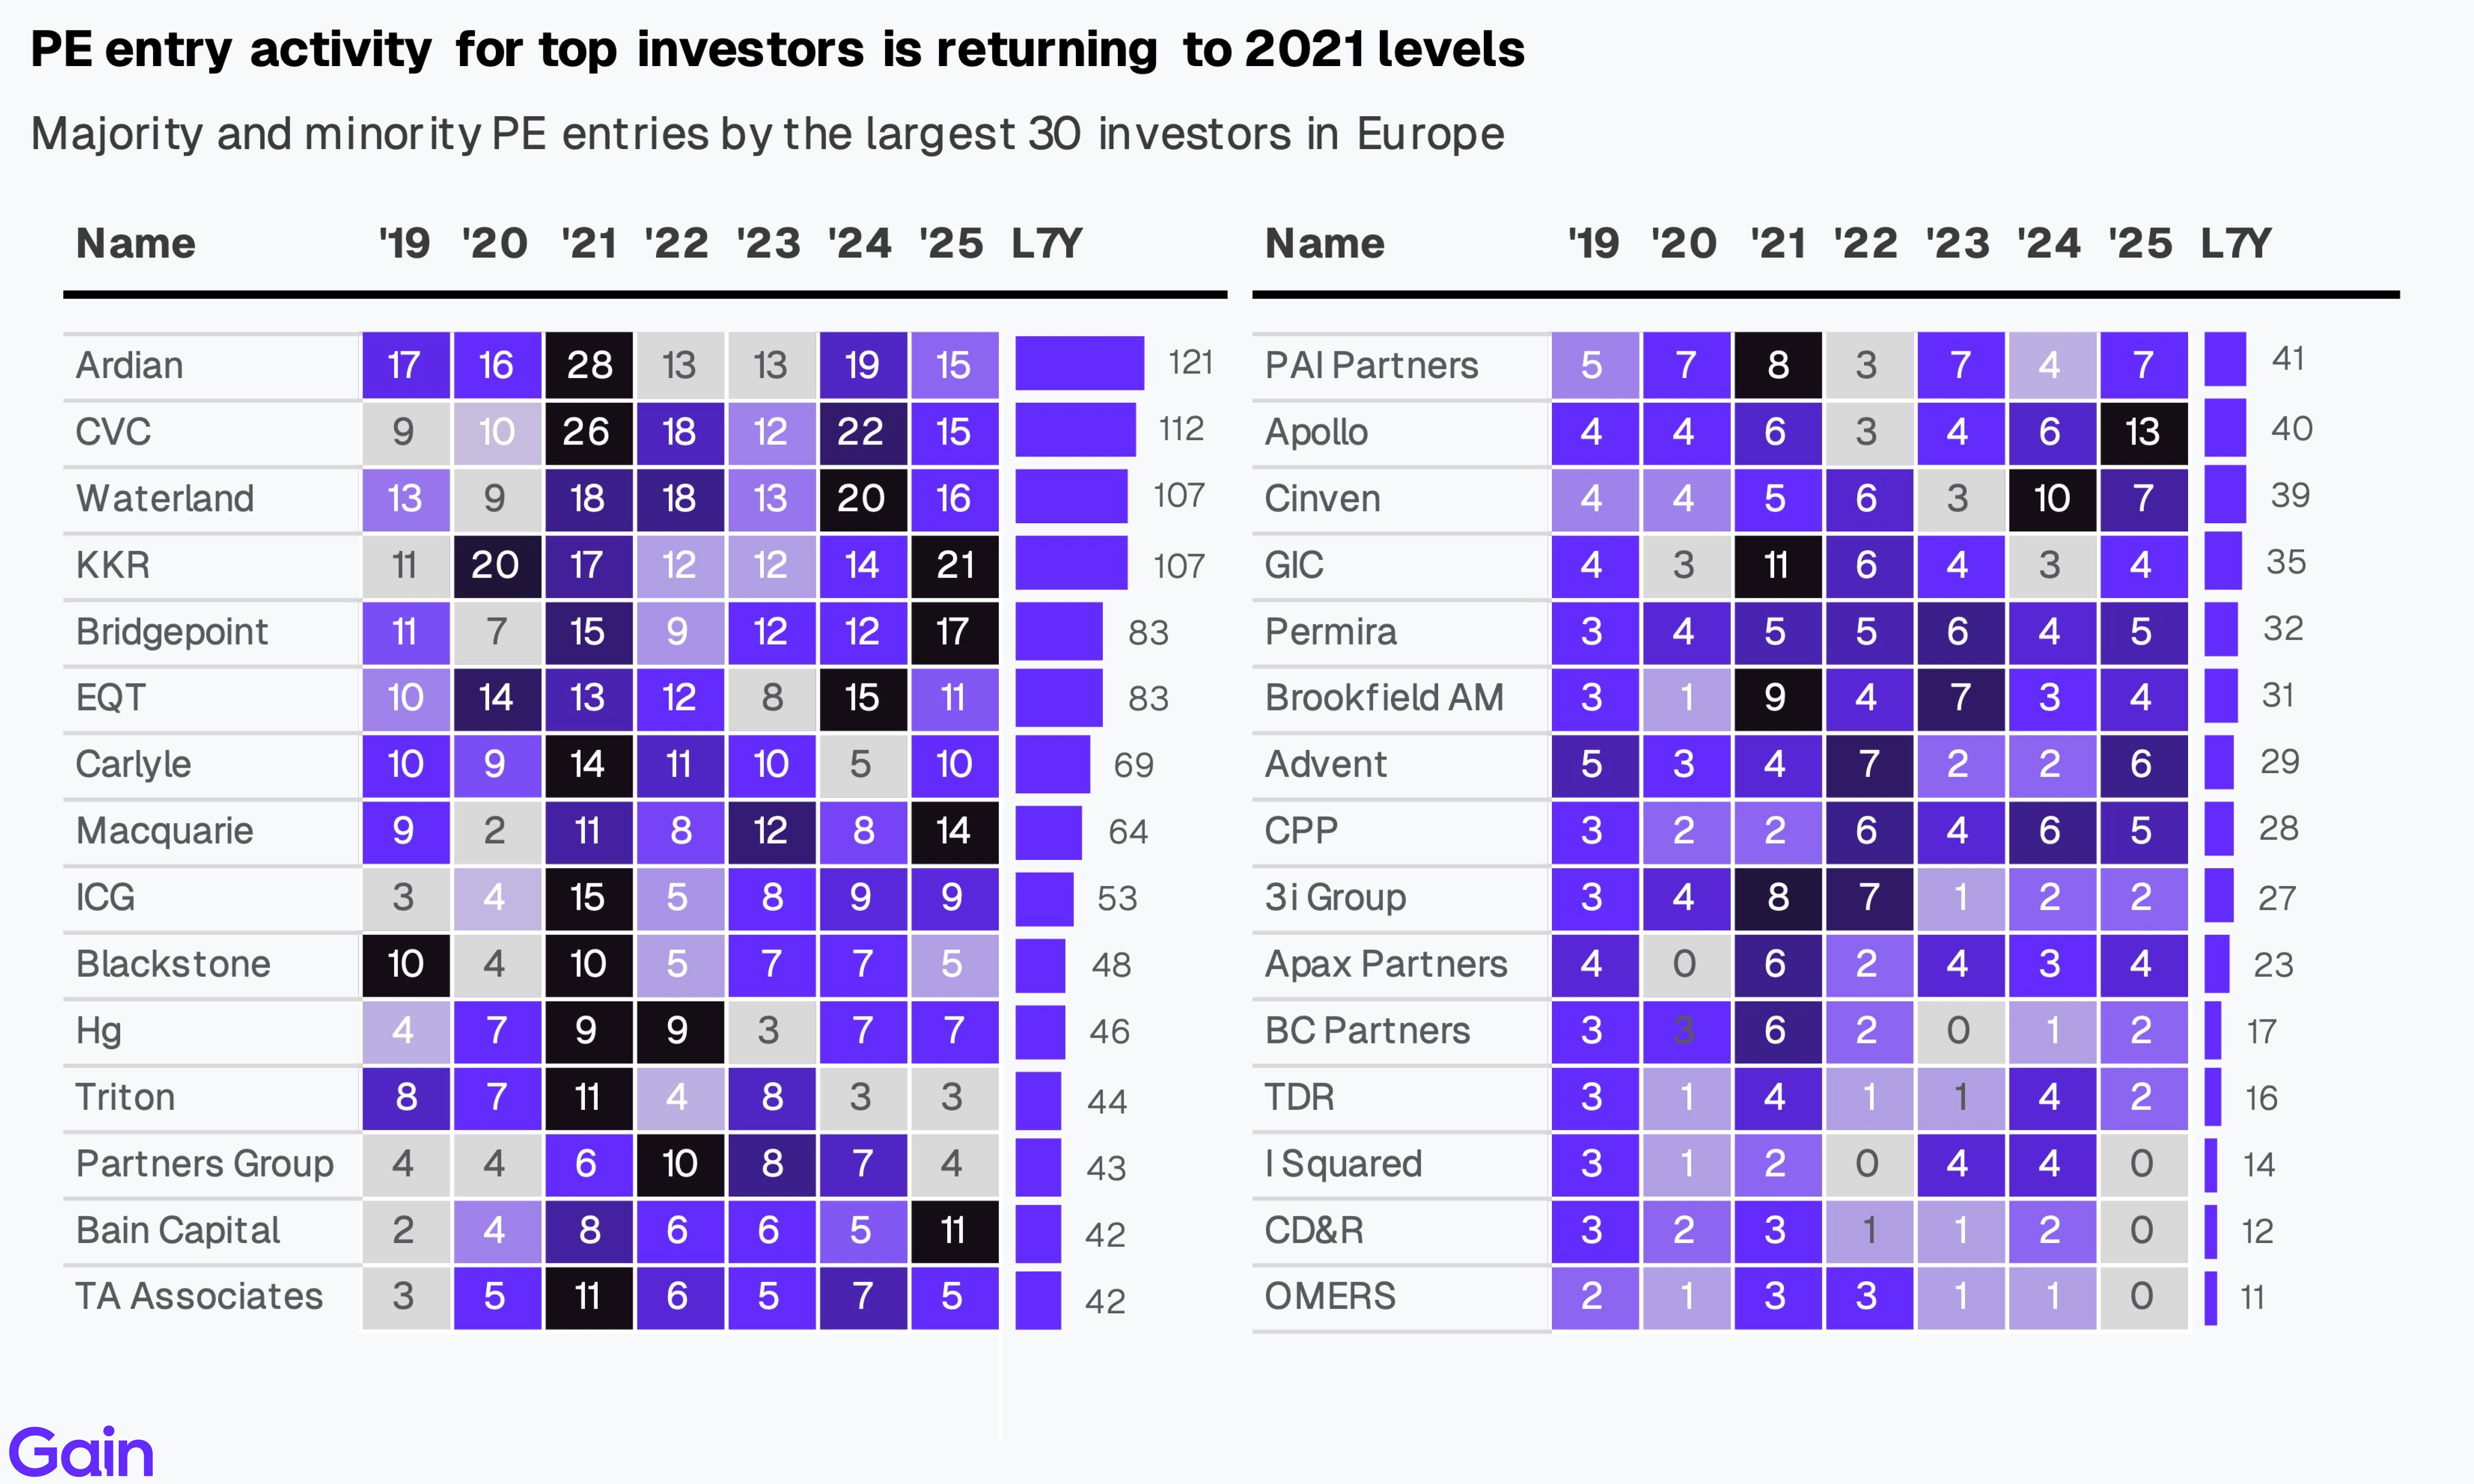
PE entry activity for top investors is returning to 2021 levels. Entry activity peaked in 2021 followed by softening in 2022-2023 amid challenging market conditions. Activity rebounded in 2024-25 as investors returned to the market. KKR, Bridgepoint and Macquarie were particularly active in 2024-2025, reflecting renewed confidence in European markets. Over the last 7 year period, Ardian, CVC and Waterland led European PE entry activity with 121, 112 and 107 entries, respectively.
CD&R, Blackstone, Hg and TDR Capital stand out as large take-private investors, reflecting their focus on large-scale investments. EQT, Permira, Bridgepoint and CPP Investments are also active in the take-private market. Meanwhile, I Squared Capital, Advent and Triton show significant carve-out concentration at over 40%, driven by their Industrials focus. However, sponsor-to-sponsor transactions remain the most popular entry route across the board.

European PE exit activity is rebounding after a slowdown. Exits peaked in 2021 before declining in 2022-2023 as market conditions deteriorated. Activity has recovered in 2024–2025, with CVC, EQT and Ardian completing 17, 12 and 10 exits, respectively, in the last year alone.

TA Associates, CD&R, Bain Capital and ICG tend to have shorter holding periods, with a median of approximately 3-4 years. In contrast, Macquarie, Triton and Partners Group have longer holding periods, with a median of around 7 years.

Mid-market funds have the highest share of longer-held assets. Around 20% of their assets haven’t had an ownership transfer in the last 7+ years. In contrast, mega funds have more fast-moving portfolios, along with a higher share of assets from more recent vintages.

By Sector & Region
Among the top 30 investors, Hg, TA Associates and Permira lead in TMT concentration at 82%, 57% and 37%, respectively. Services-focused investors include I Squared (49%), Apax Partners (42%) and Triton (42%). 3i Group dominates Consumer at 77%, followed by TDR Capital (58%) and PAI Partners (50%). Advent focuses on Industrials at 39%, while Blackstone and Macquarie show strong Infrastructure allocations at 50% and 38%, respectively. In contrast, KKR, Apollo and Partners Group maintain balanced portfolios across multiple sectors.

By region, UK&I dominates allocations among the top 30 investors, followed by DACH. In contrast, Iberia, Italy and CEE remain a small part of most portfolios. TDR Capital has the highest UK&I allocation overall. North American investors show a similar pattern, with CPP (63%), CD&R (61%), I Squared Capital (47%), Brookfield AM (45%), Blackstone (38%) and Apollo (37%) all demonstrating significant UK concentration. Meanwhile, 3i Group shows significant concentration (83%) in Benelux driven by its holding in Action.

CVC leads geographical portfolio diversification with presence in 18 of the 20 largest European countries. Closely following CVC are Blackstone, Ardian, KKR and Cinven, who also maintain a wide presence across 14-15 countries. On the other end, CD&R, TDR, I Squared, OMERS and BC Partners have portfolios in 7 or less countries, reflecting a geographically focused strategy.

By Size
Waterland, Bridgepoint and Ardian have relatively smaller deal sizes with a median enterprise value per deal of €90-185m. In contrast, CD&R, Brookfield AM, GIC and I Squared Capital take more concentrated positions, deploying substantial capital in larger investments with median EV exceeding €1bn.

The preference for minority versus majority stakes differs among the top investors. Sovereign wealth funds and pension funds such as GIC, CPP, OMERS, ICG and TA Associates lean more towards minority stakes. In contrast, Triton, 3i Group, I Squared and Waterland are more majority-focused.

By Portfolio Concentration
CD&R, 3i Group and TDR have exceptionally high portfolio concentration in their top 3 holdings, representing over 75% of their European portfolio EV. In contrast, CVC, KKR and EQT show lower portfolio concentration in top assets, with top 3 holdings representing less than 30% of their European EV, reflecting their broader market coverage and multi-sector investment approach across Europe.

Most of the top European investors are not as active in venture capital. Exceptions include EQT, Temasek, GSAM and Bpifrance who maintain notable VC portfolios alongside their PE investments. EQT stands out with roughly equal exposure to both VC and PE-backed companies. Bpifrance shows significant activity in both venture capital and PE, though tilted toward PE. In contrast, KKR, Bridgepoint, Waterland, CVC, Cinven, Hg and Ardian focus predominantly on buyouts and growth equity with minimal activity in venture capital.

Waterland, TDR Capital and Triton allocate over 95% of their portfolios to Europe, reflecting exceptionally strong home-market focus. Investors like 3i Group, ICG, PAI Partners, Cinven, Bridgepoint and Hg also maintain an exposure of over 80% to Europe. In contrast, North American investors like Apollo, Blackstone, CD&R and Bain Capital show high North American concentration at over 65%. KKR, Carlyle, Advent (North American HQ'd) and Mubadala (Middle Eastern HQ'd) maintain a relatively balanced geographic mix between Europe and North America.

By Growth Rates & Margins
TA Associates, Hg and CPP show the highest revenue growth at ~20% CAGR. Hg and TA Associates' growth reflects their focus on high-growth software and tech sectors combined with active add-on strategies. In contrast, Brookfield, I Squared and Bain Capital show lower revenue growth. Notably, 18 of the top 30 investors maintain above-average revenue growth compared to the broader European median of 14% CAGR.

Hg, CPP and TA Associates are among the most active buy-and-build investors. Buy-and-build has now become the foremost value creation strategy across the board. For example, Visma, one of the largest European PE-backed holdings backed by Hg, has executed over 100 acquisitions in the past five years alone. In contrast, 3i Group, Apollo and Brookfield AM show limited buy-and-build activity (less 2 add-ons per year).

Hg, TA Associates and CPP stand out as investors with high-growth, high-margin portfolios. Hg and TA Associates both concentrate on fast-growing software and tech businesses, with Hg also being one of the most active consolidators. In contrast, Bain Capital, TDR Capital and CD&R show lower growth and margins relative to the Europe 250 median, reflecting their focus on traditional sectors.

The top 30 investors collectively employ 2.5m FTEs, representing 46% of total Europe 250 employment of 5.5m. CD&R, TDR, CVC and KKR lead in absolute employment figures, with CD&R employing over 261,000 FTEs across its portfolio. These high employment levels reflect concentration in labor-intensive sectors such as retail and consumer.

Methodology
The data for this report comes from Gain.
We take a novel approach to our ranking, which is based on total managed enterprise value (EV). At Gain, we track over 20,500 investor portfolios in detail.
To estimate the managed enterprise value (EV), we estimate the EV for each asset in an investor’s portfolio. We begin with the latest reported deal value, where publicly available. If it's not available, we estimate the EV by multiplying EBITDA by the predicted exit multiple. The total EV is then aggregated at the investor level.
We scale the last reported deal value by a growth multiplier to estimate its current holding value. We also adjust EV for the investor's estimated ownership share in an asset.
Where there aren't reported deal figures or financials, we estimate them using the asset's revenue, subsector margins and revenue/FTE calculations.


We only consider majority buyout and minority-owned PE assets for our rankings. We exclude any VC investments and publicly listed stakes. To predict exit multiples, we consider an asset’s sector, size, growth rate, margin profile and cash generation.
Our ranking is limited to the European-headquartered portfolio of the investors.
Further, we include only active investors in pan-European ranking with i) 5 or more portfolio companies in Europe and ii) 5 or more entries since 2020
For the sector and regional rankings, we include investors with i) 3 or more portfolio companies in that sector/region in Europe and ii) 3 or more entries in that sector/region since 2020
Unless otherwise stated, all metrics and calculations are based on an investor's portfolio in Europe only. We excluded investors with <5 data points for any aggregate metrics in the portfolio insights section.