Executive Summary
In this report, we rank and analyze the largest and most active private equity (PE) investors in the US.
We take a novel approach to our ranking, which is based on the total estimated managed enterprise value (EV) of investors’ portfolio companies headquartered in the US. This approach enables us to go deeper and uncover differentiated insights unavailable elsewhere.
Further, this approach helps us capture large investors who do not rely on traditional fundraising and are often overlooked by other industry rankings.
Key takeaways from our analysis:
Blackstone has emerged as the largest private equity investor in the US, managing a total estimated EV of $195bn, followed by KKR ($143bn) and Apollo ($108bn). Other investors in the top 10 include Thoma Bravo ($103bn), Hellman & Friedman ($79bn), Bain Capital ($76bn), Vista Equity Partners ($74bn), Carlyle ($63bn), Silver Lake ($61bn), and Clayton Dubillier & Rice ($60bn).
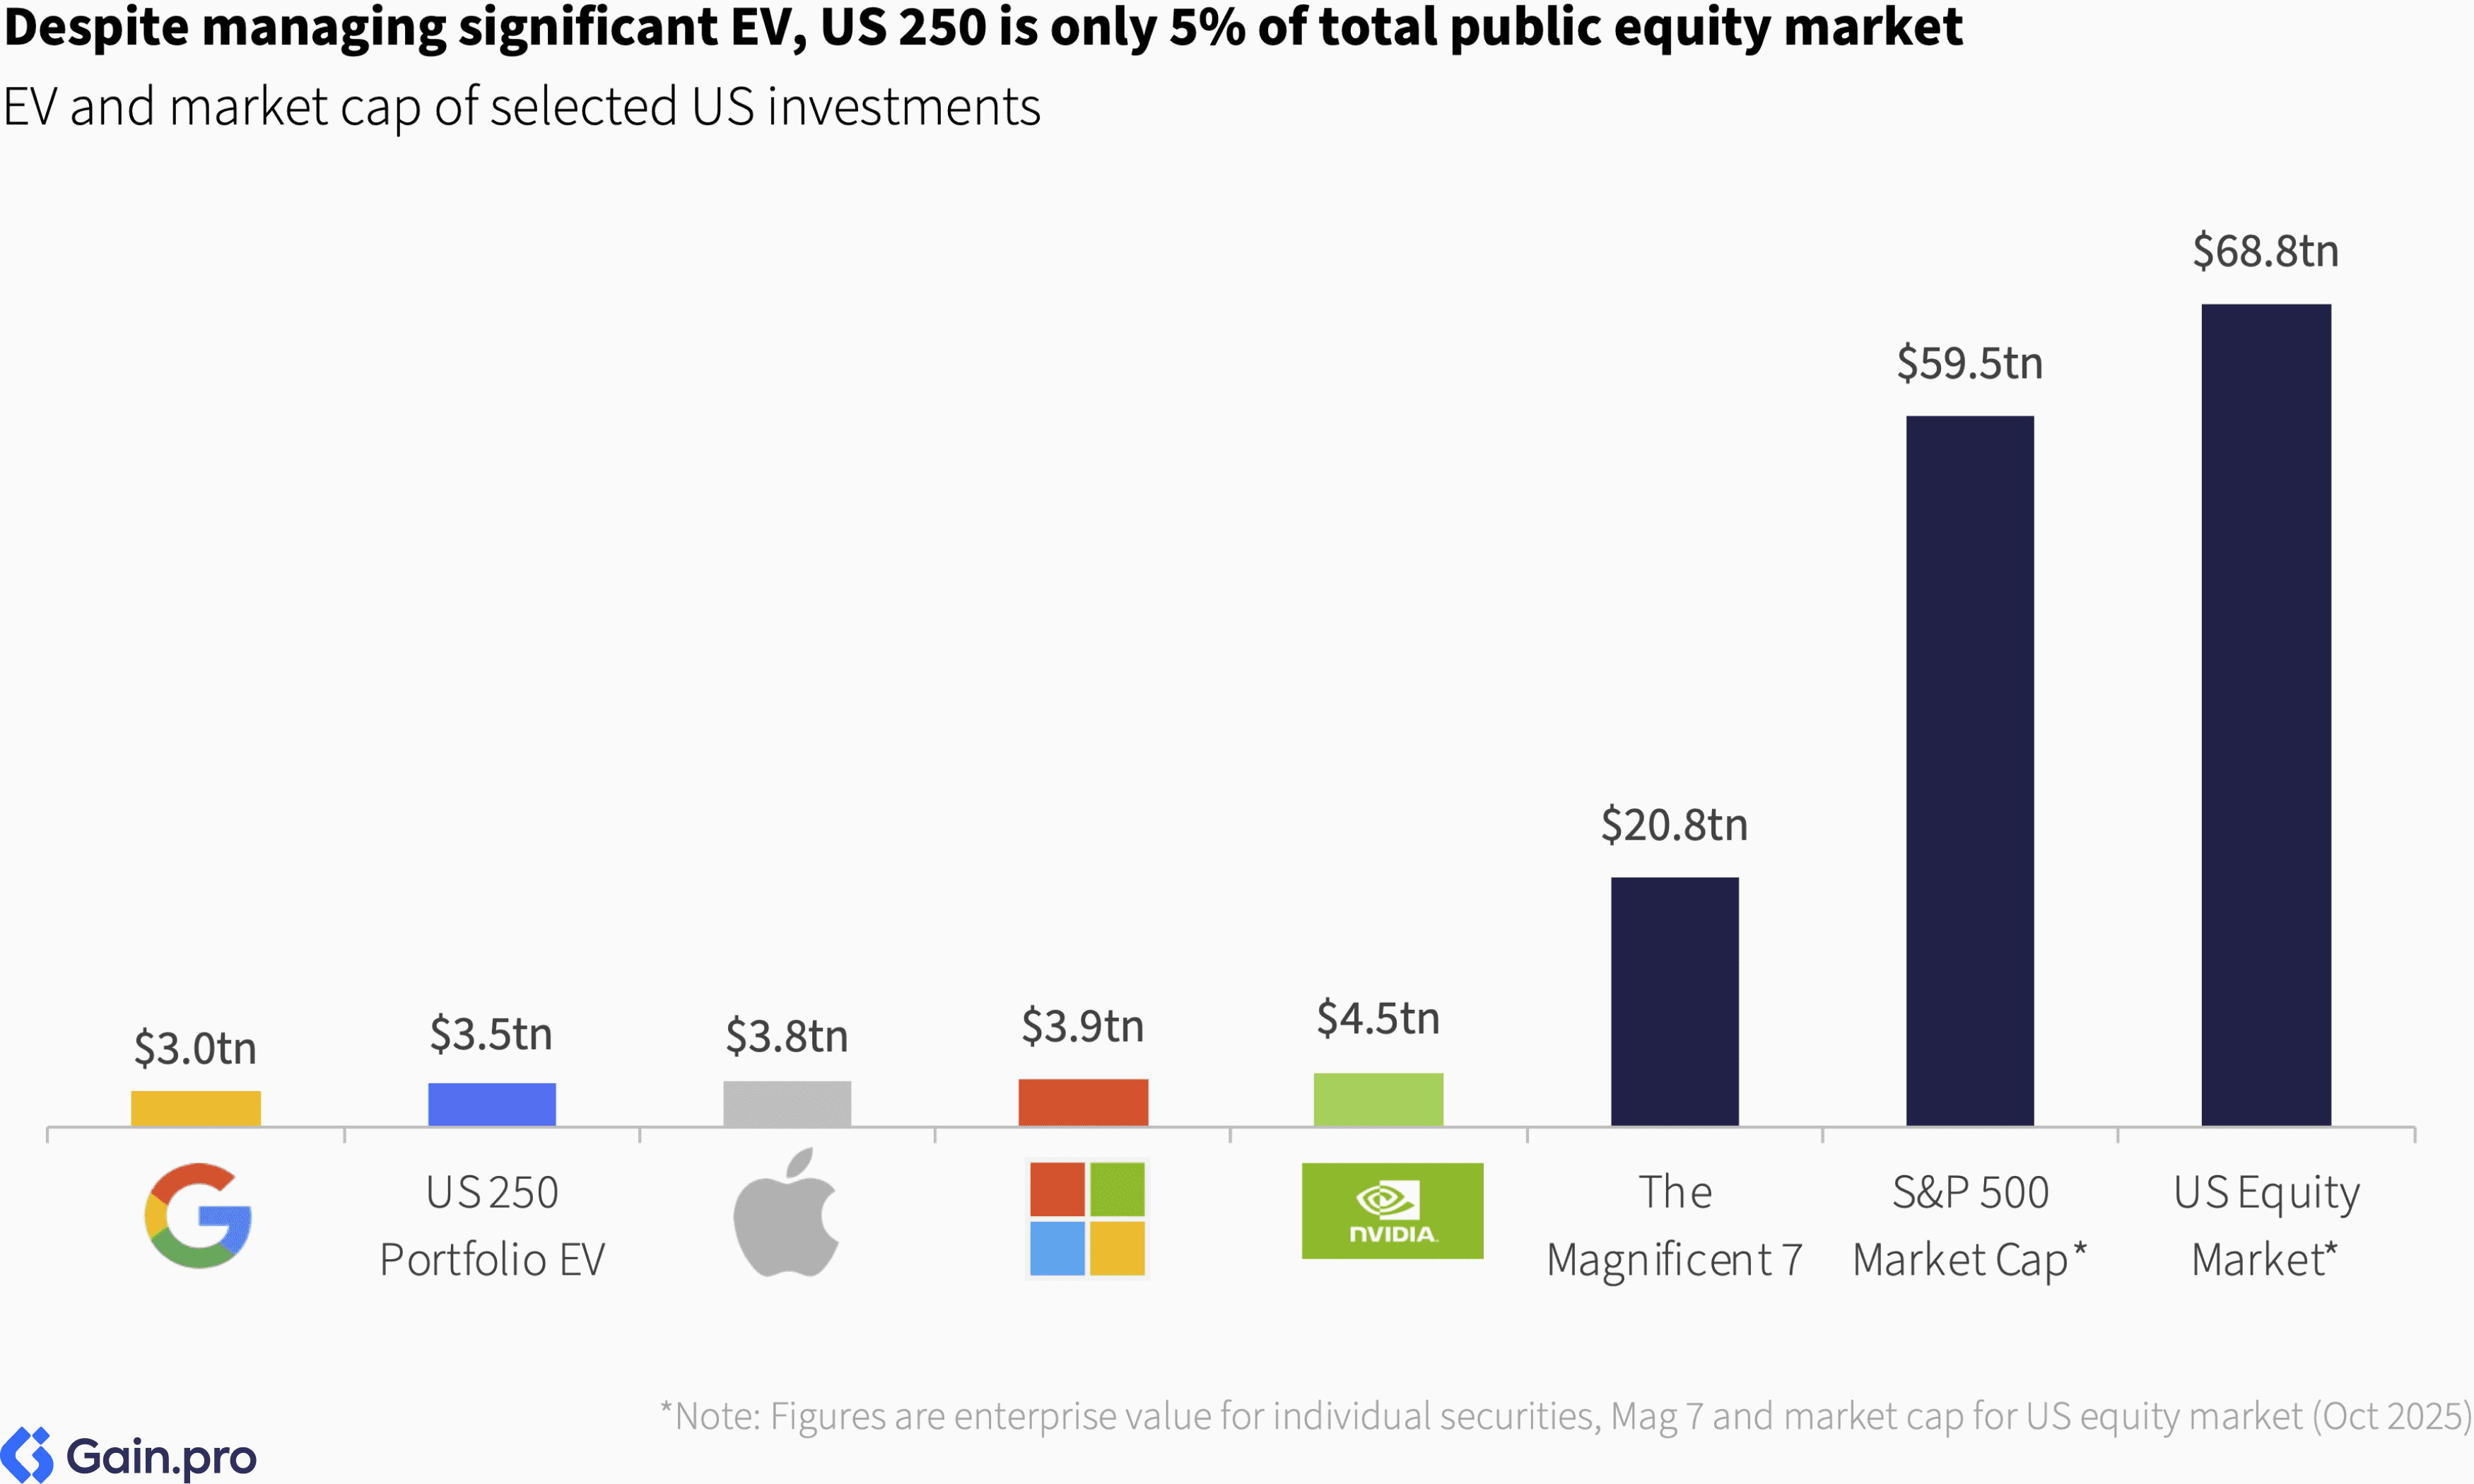
Collectively, the top 250 investors in the US manage an EV of $3.5tn across 6,397 assets. Despite its significant size, the aggregated US 250 EV is just 5% of the ~$70 trillion US public equity market.
US-headquartered sponsors dominate the ranking. They manage 86% of the total aggregate US 250 EV. The US 250 landscape is fairly concentrated at the upper end, with the top 25 investors managing 46% of aggregate EV. Nine of the top 10 firms in our ranking were founded during or before the 1990s.
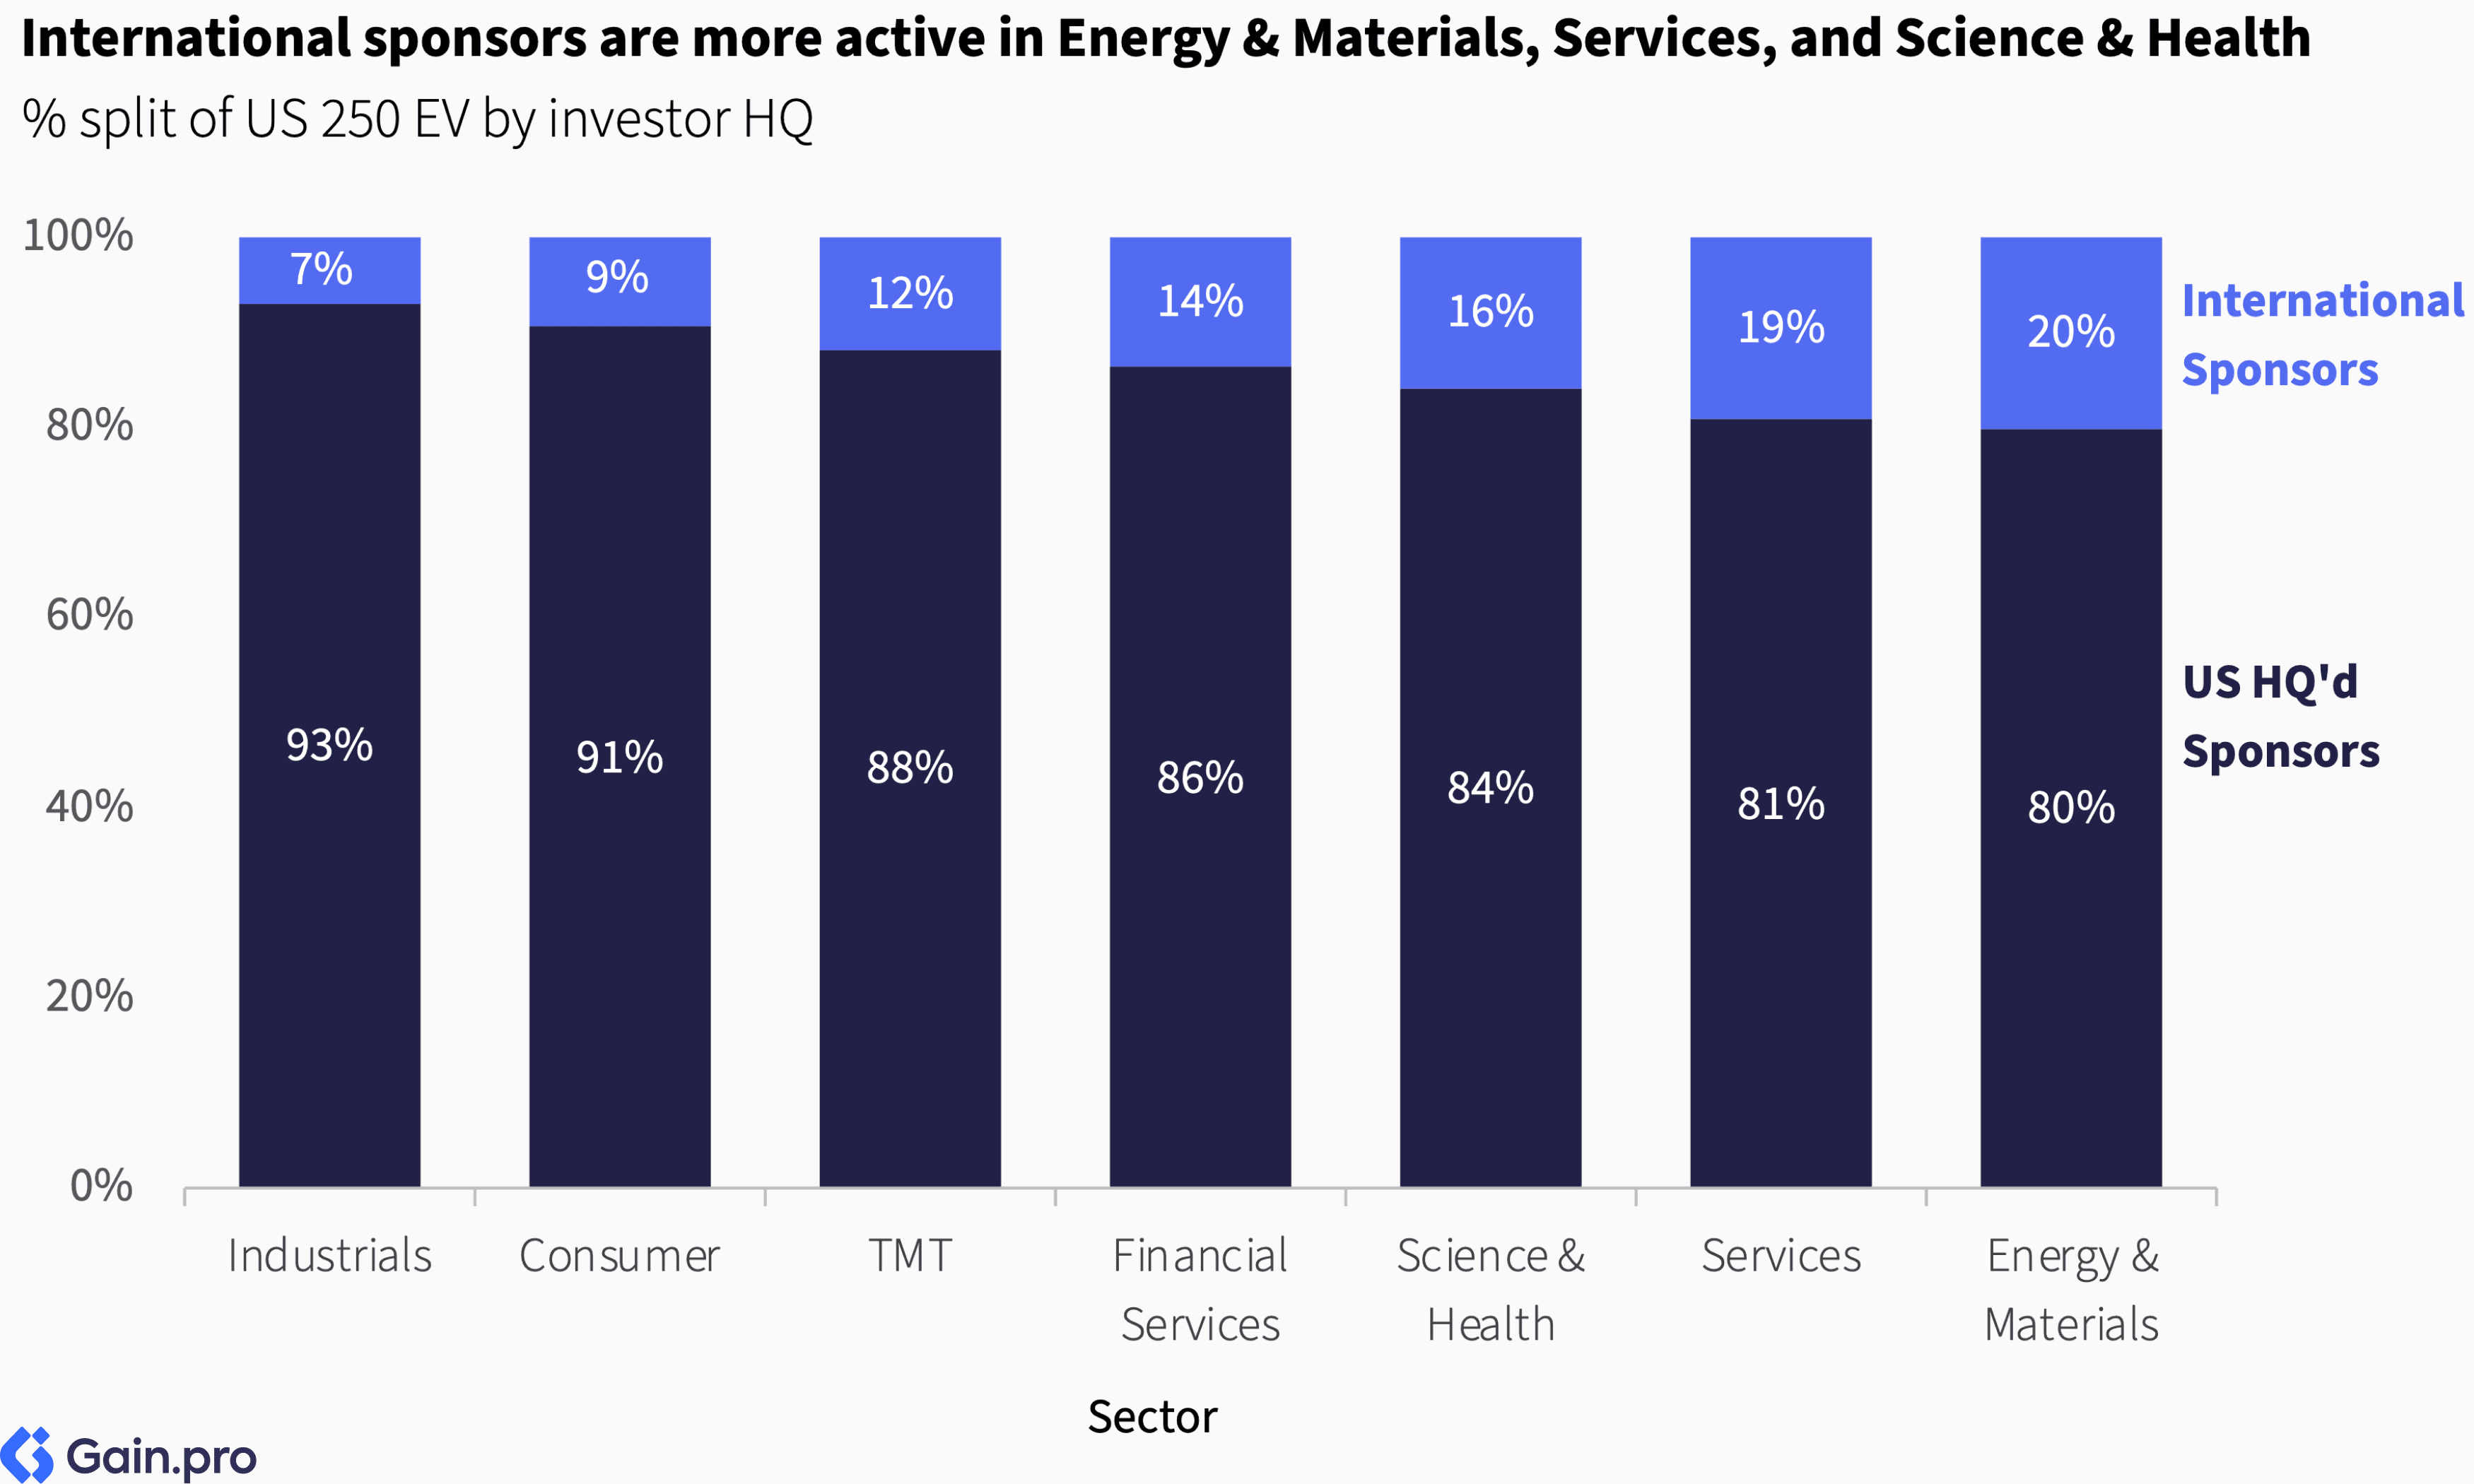
Leading the sector 50 rankings are Thoma Bravo (TMT), Blackstone (Services and Financial Services), Apollo (Industrials), KKR (Energy & Materials), Roark Capital (Consumer), and Sycamore Partners (Science & Health). International sponsors' presence is most notable in Energy & Materials (20%), Services (19%), and Science & Health (16%).
TMT is by far the largest PE sector in the US (34% of EV), followed by Services (20%) and Science & Health (12%). Combined, these three sectors account for over two-thirds of the US 250 EV. Geographically, the assets are concentrated in California (14%), Texas (12%), Illinois (9%), New York (6%), Florida (6%), and Massachusetts (6%), with the top 15 states representing 80% of US 250 EV.


Chapter 01: US 250 Investor Ranking
Blackstone has emerged as the largest private equity investor in the US, managing a total estimated EV of $195bn, followed by KKR (managing an EV of $143bn) and Apollo Global Management ($108bn).
Other investors in the top 10 include Thoma Bravo ($103bn), Hellman & Friedman ($79bn), Bain Capital ($76bn), Vista Equity Partners ($74bn), Carlyle ($63bn), Silver Lake ($61bn), and Clayton Dubillier & Rice ($60bn).
Collectively, the top 250 investors in the US manage an estimated EV of $3.5tn across 6,397 assets. On average, they have a portfolio EBITDA of $91m and manage 26 companies each.
Over the last 6 years, US 250 investors have invested in 2.5x as many new portfolio companies as they have exited. Specifically, there have been 5,688 new investments and 2,258 exits from these sponsors.
The table below lists all the top 250 investors in the US. Use the search bar or the arrows at the top to navigate through the ranking.
Dominant Investor HQs
US-headquartered sponsors dominate the US 250 ranking. They manage 86% of the total aggregate US 250 EV. The role of international sponsors remains limited, with their investments predominantly concentrated in larger assets.

New York is the largest hub for investors in our ranking, accounting for 34% of headquarters, followed by San Francisco (11%), Boston (9%), Chicago (6%), and Greenwich (6%). Other notable hubs include Los Angeles, Miami, Washington, D.C., and Dallas. Outside the US, London and Toronto stand out as the primary hubs.

Beyond the top 10, several major US-headquartered investors rank highly when grouped by region, including Roark Capital ($42bn), BDT & MSD Partners ($38bn), and GTCR ($25bn). Notable international investors active in the US market include EQT ($54bn US EV), GIC ($38bn), CPP Investments ($31bn), ADIA ($30bn), Permira ($30bn), Partners Group ($29bn), CVC ($25bn), and Ardian ($23bn). Despite this presence, international sponsors represent only 14% of total US 250 EV — with European sponsors at 7%, Canadian at 4%, and other international investors at 3%.

Investor Concentration
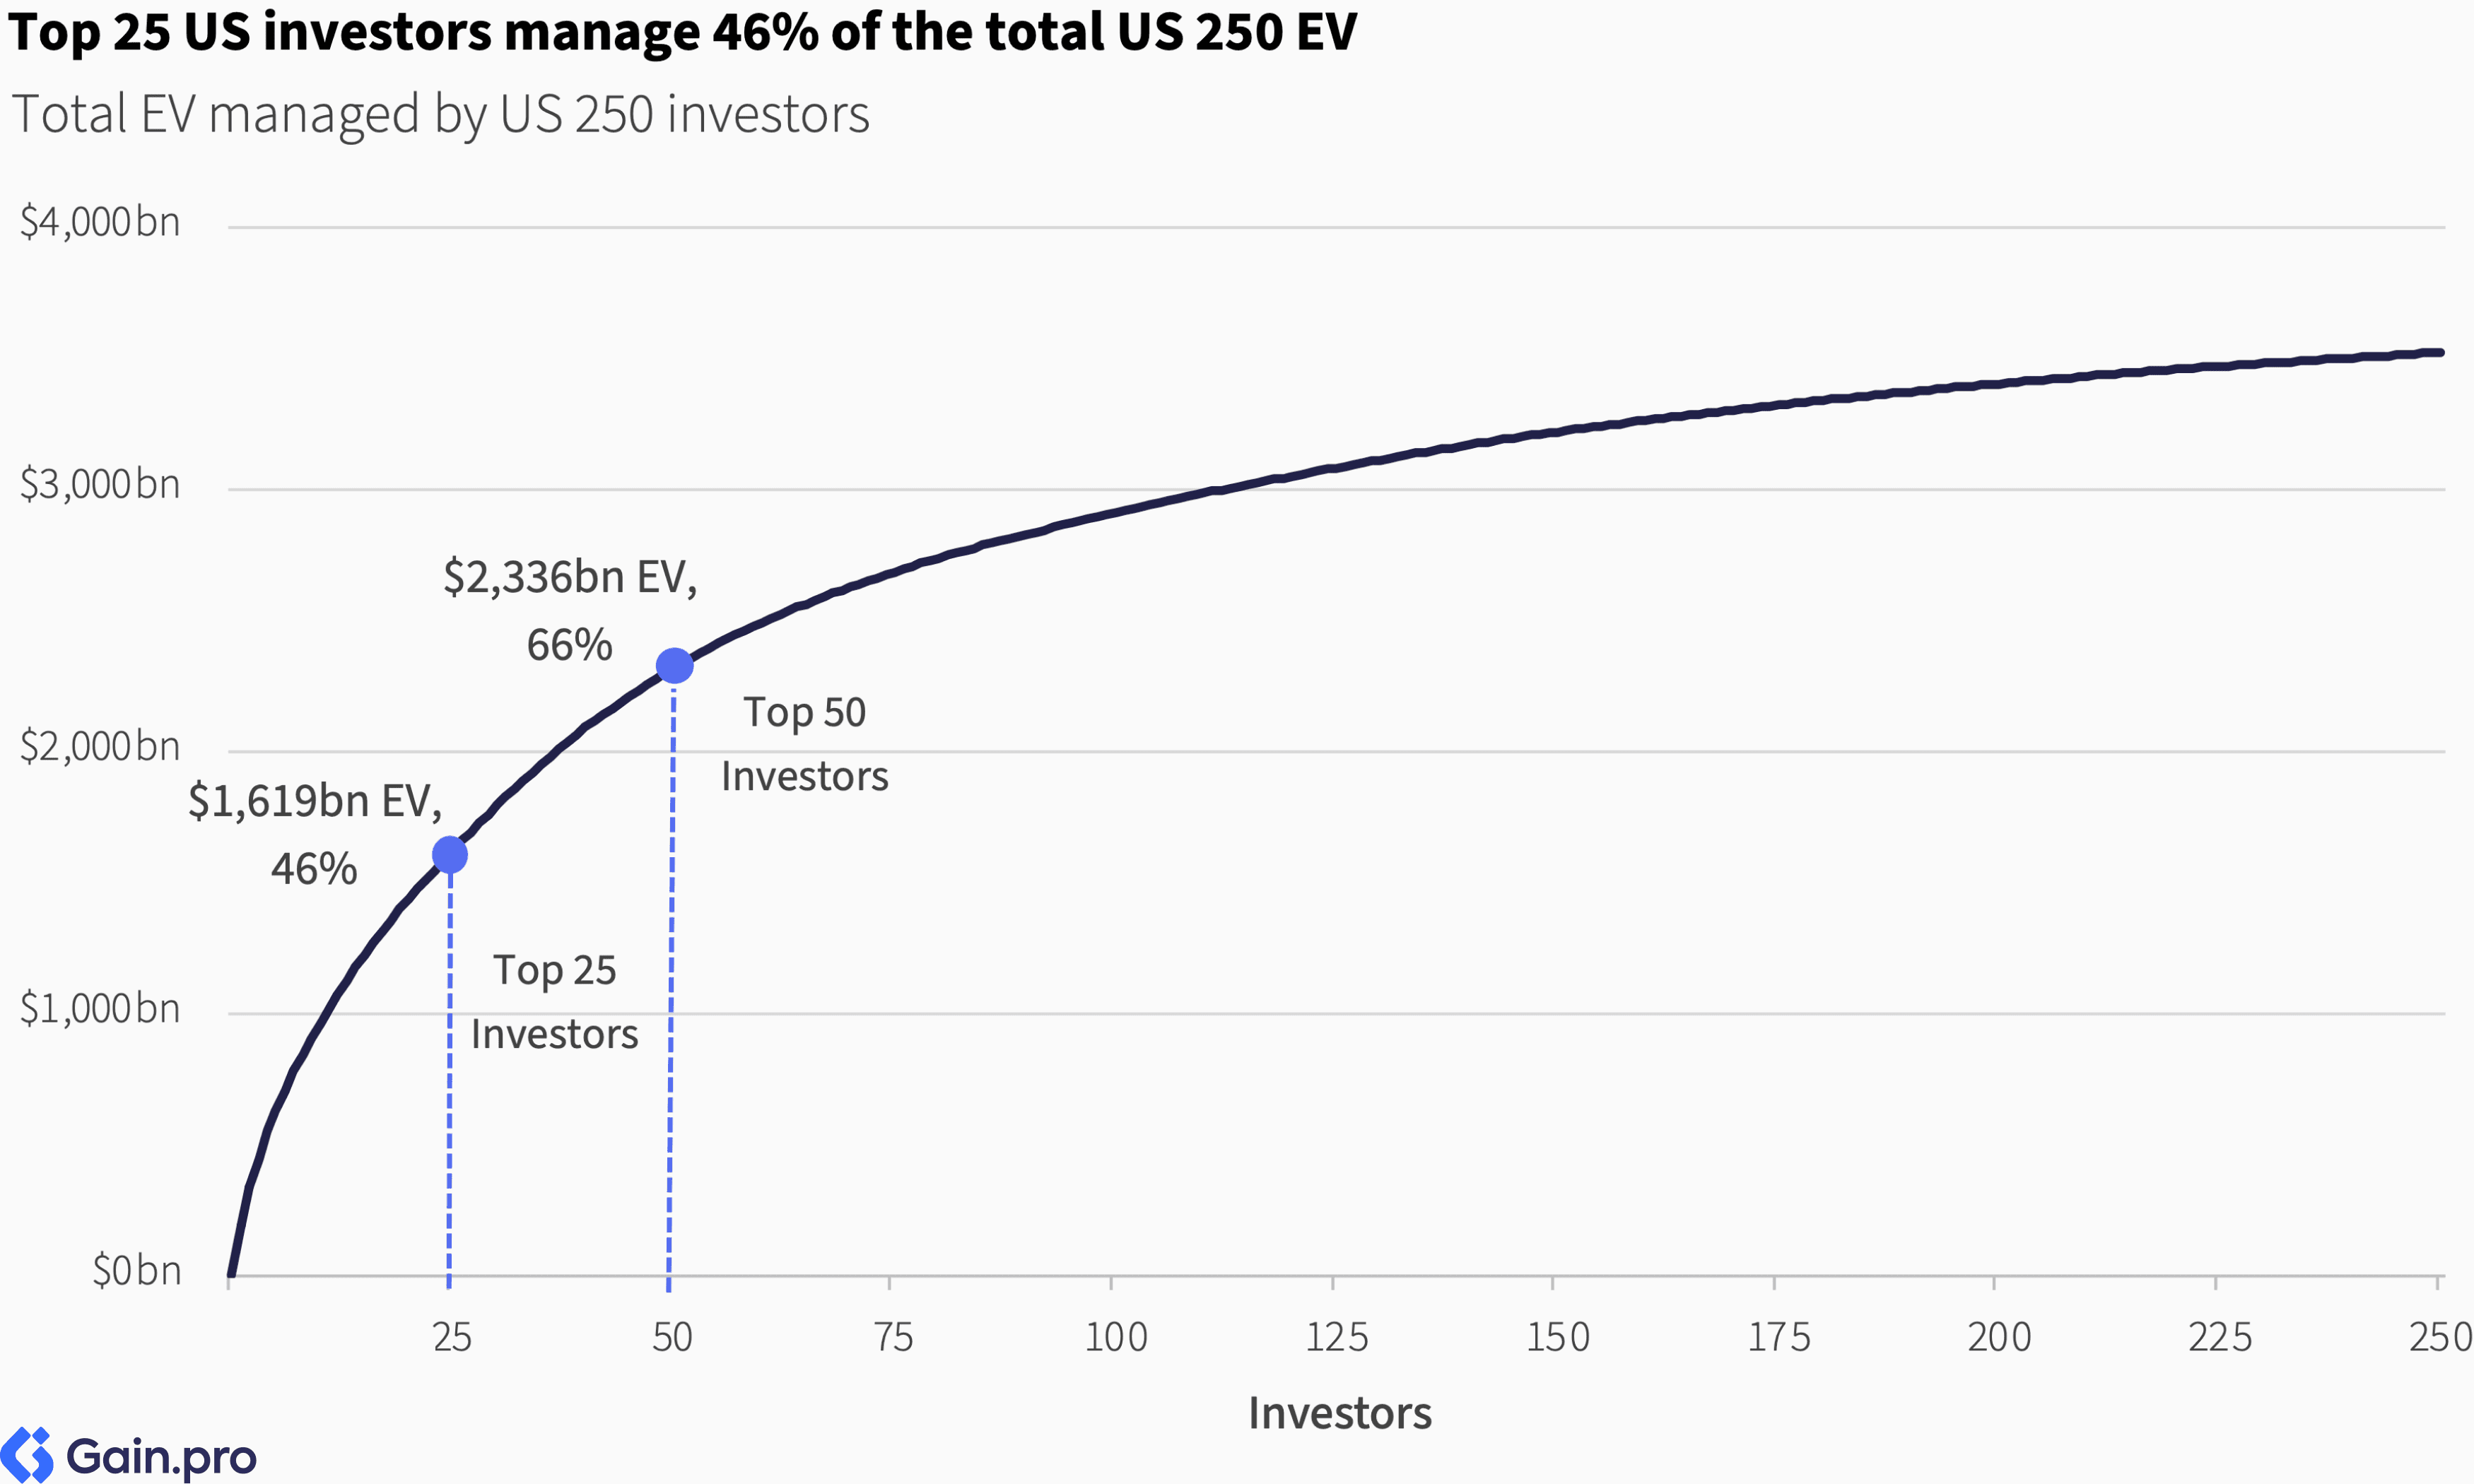
The US 250 landscape is fairly concentrated at the upper end, with the top 25 investors managing 46% of aggregate EV. PE firms, like other asset managers, benefit from inherent scale advantages. While concentration is increasing in PE, the market still remains less concentrated compared to public asset management or the advisory landscape. Notably, most growth among buyout players has been organic, with limited M&A between PE firms themselves. Instead, consolidation occurs primarily when firms expand into adjacent strategies such as private credit or infrastructure, often through acquisitions.
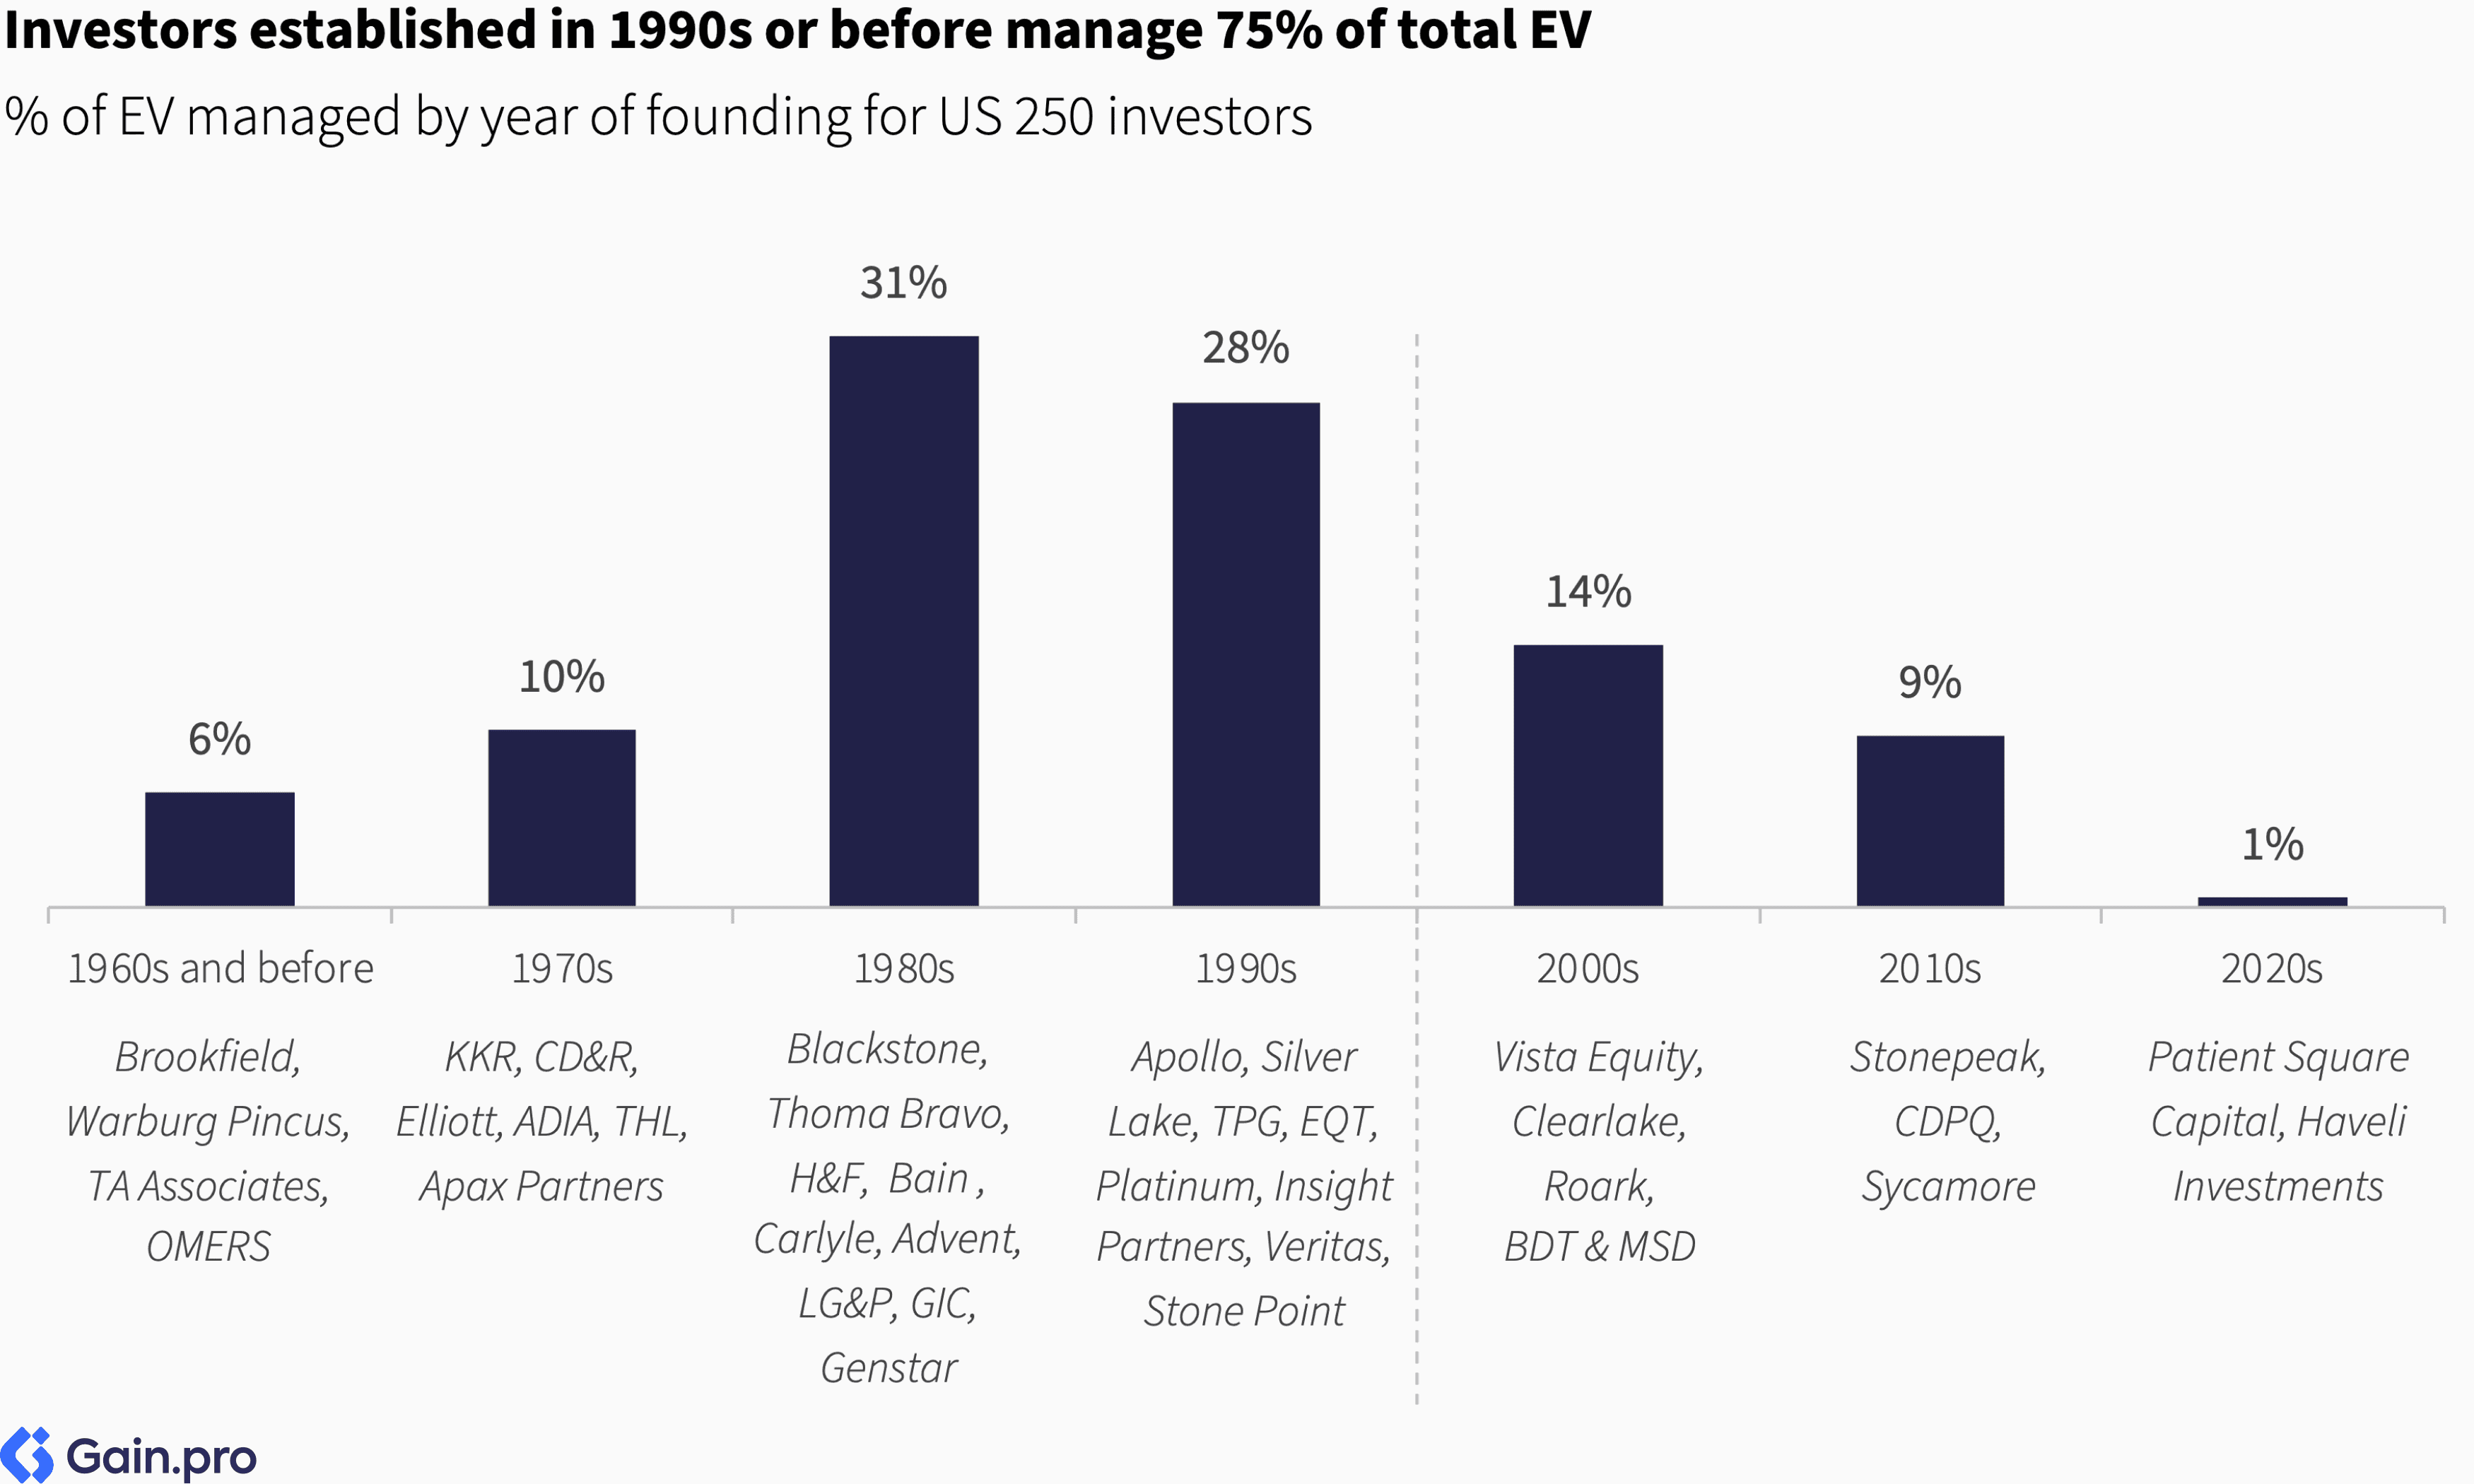
Building scale in private equity takes time. This is reflected in the distribution of managed EV by founding year. Investors established in the 1990s or earlier manage 75% of total EV. Nine of the top 10 firms in our ranking were founded during or before the 1990s, with Vista Equity Partners (2000) being the sole exception.
Despite its significant size, the US private equity market remains small compared to the vast US public equities market. US 250 investors manage $3.5 trillion in enterprise value — just 5% of the ~$70 trillion US public equity market. In fact, the aggregated US 250 EV is smaller than individual giants like NVIDIA, Microsoft, and Apple, with ‘The Magnificent 7’ companies alone accounting for six times the US 250 EV.
Portfolio Concentration
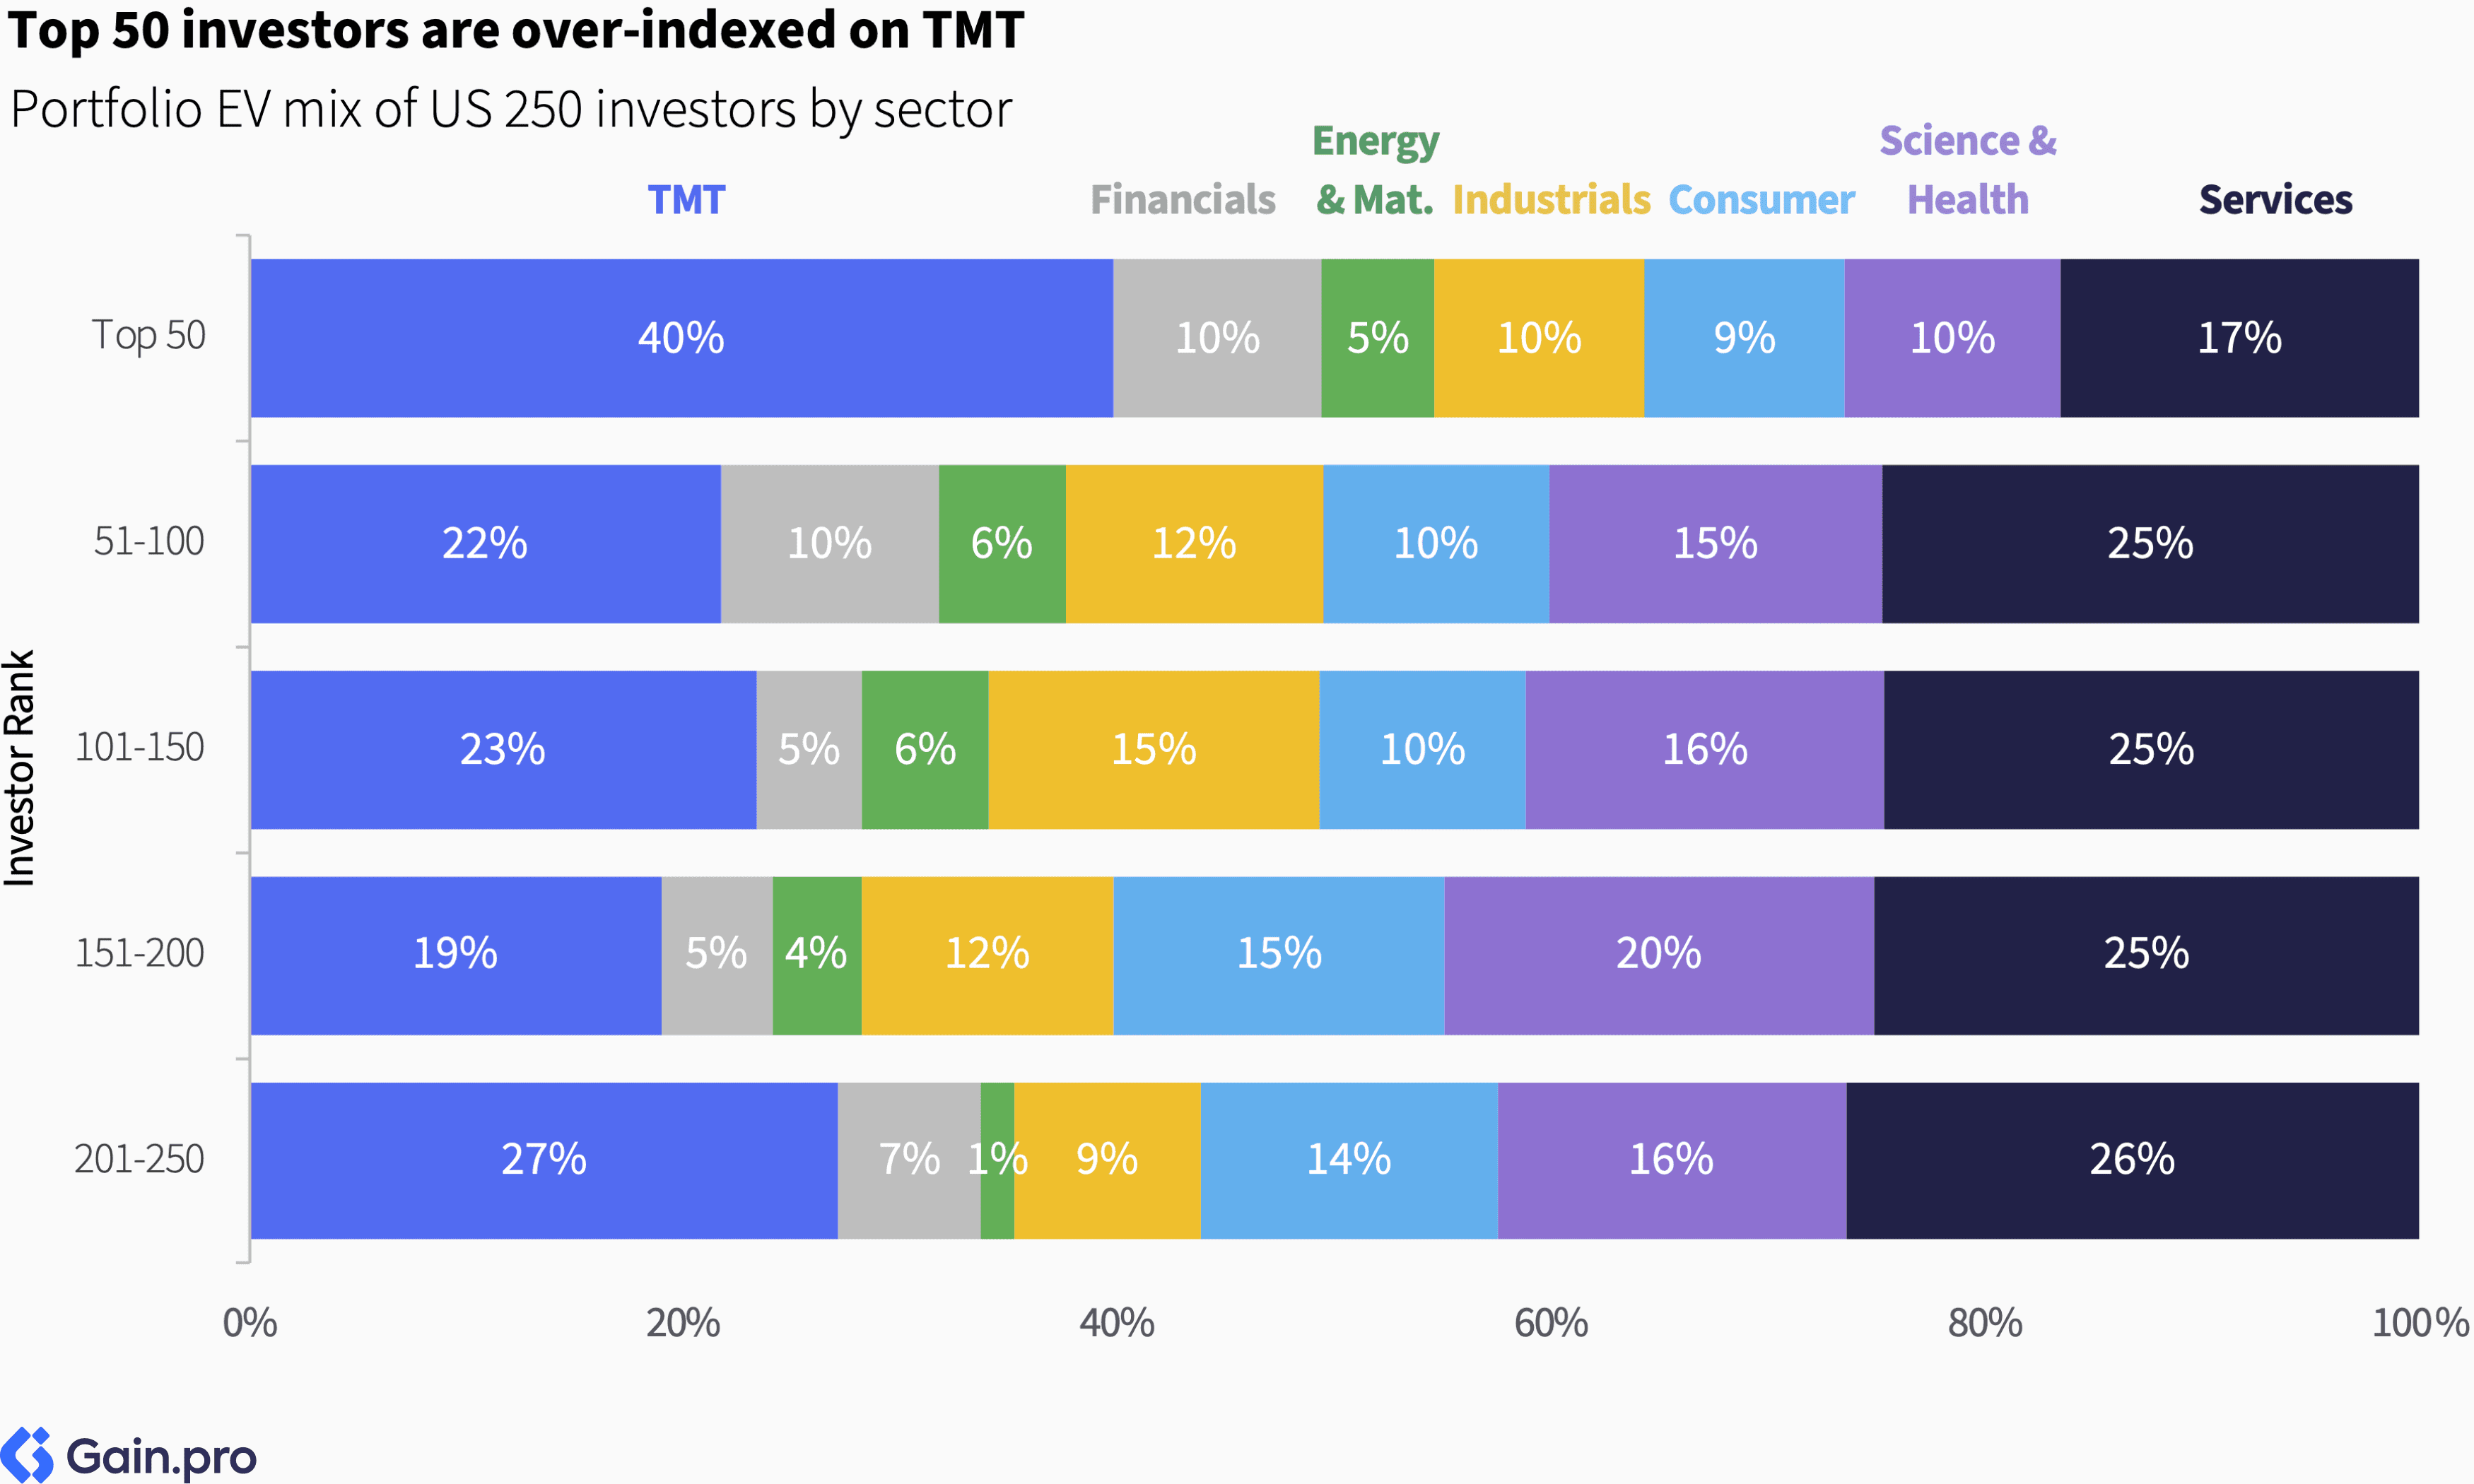
Compared to the overall US 250, the top 50 investors are more concentrated in TMT. They are less concentrated in Science & Health and Services. Notably, investors ranked 50-200 are overweight Services and Industrials relative to the top 50, while being underweight in TMT. Interestingly, the share of TMT rises again for investors ranked 201-250, driven by their investments in emerging tech and software businesses.
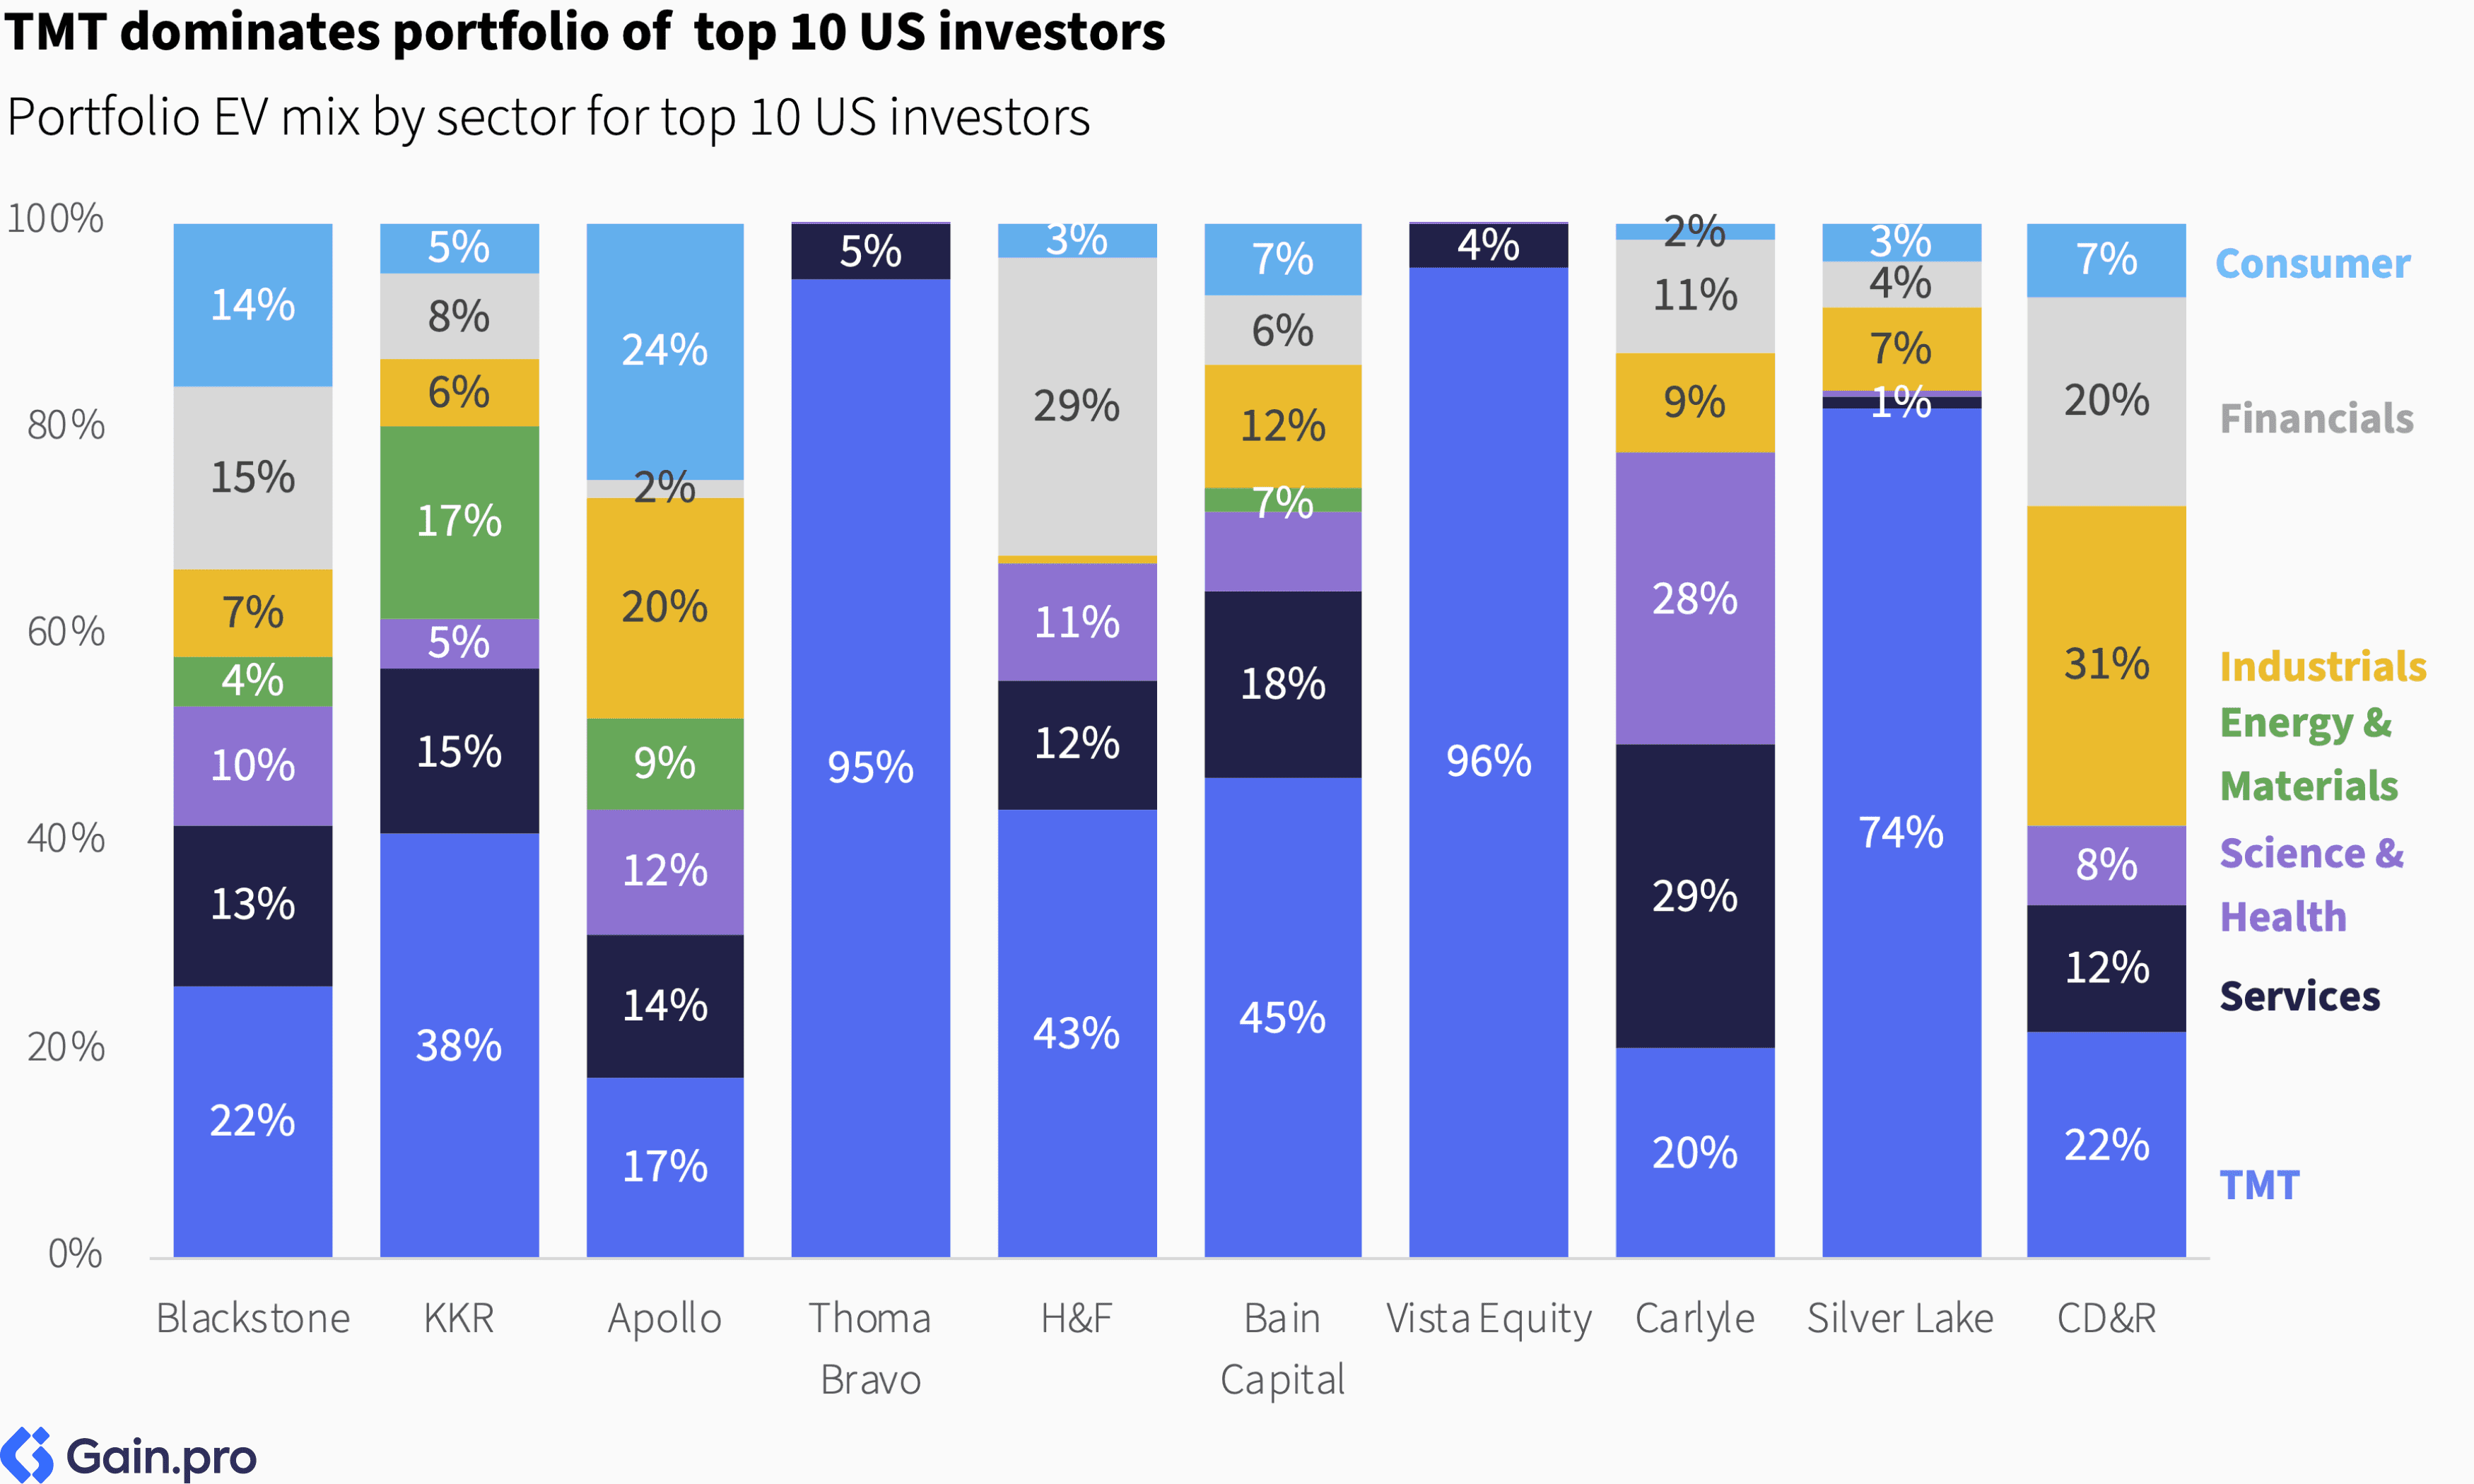
Among the top 10 investors, Thoma Bravo, Vista Equity, and Silver Lake all have more than 70% exposure to TMT. Blackstone, KKR, Apollo, and Bain Capital, in contrast, have more balanced portfolios. Hellman & Friedman stands out for its focus on Financials (29% of EV), Clayton, Dubilier & Rice for its focus on Industrials (31%) and Financial Services (20%), and Carlyle for its focus on Services (29%) and Science & Health (28%).
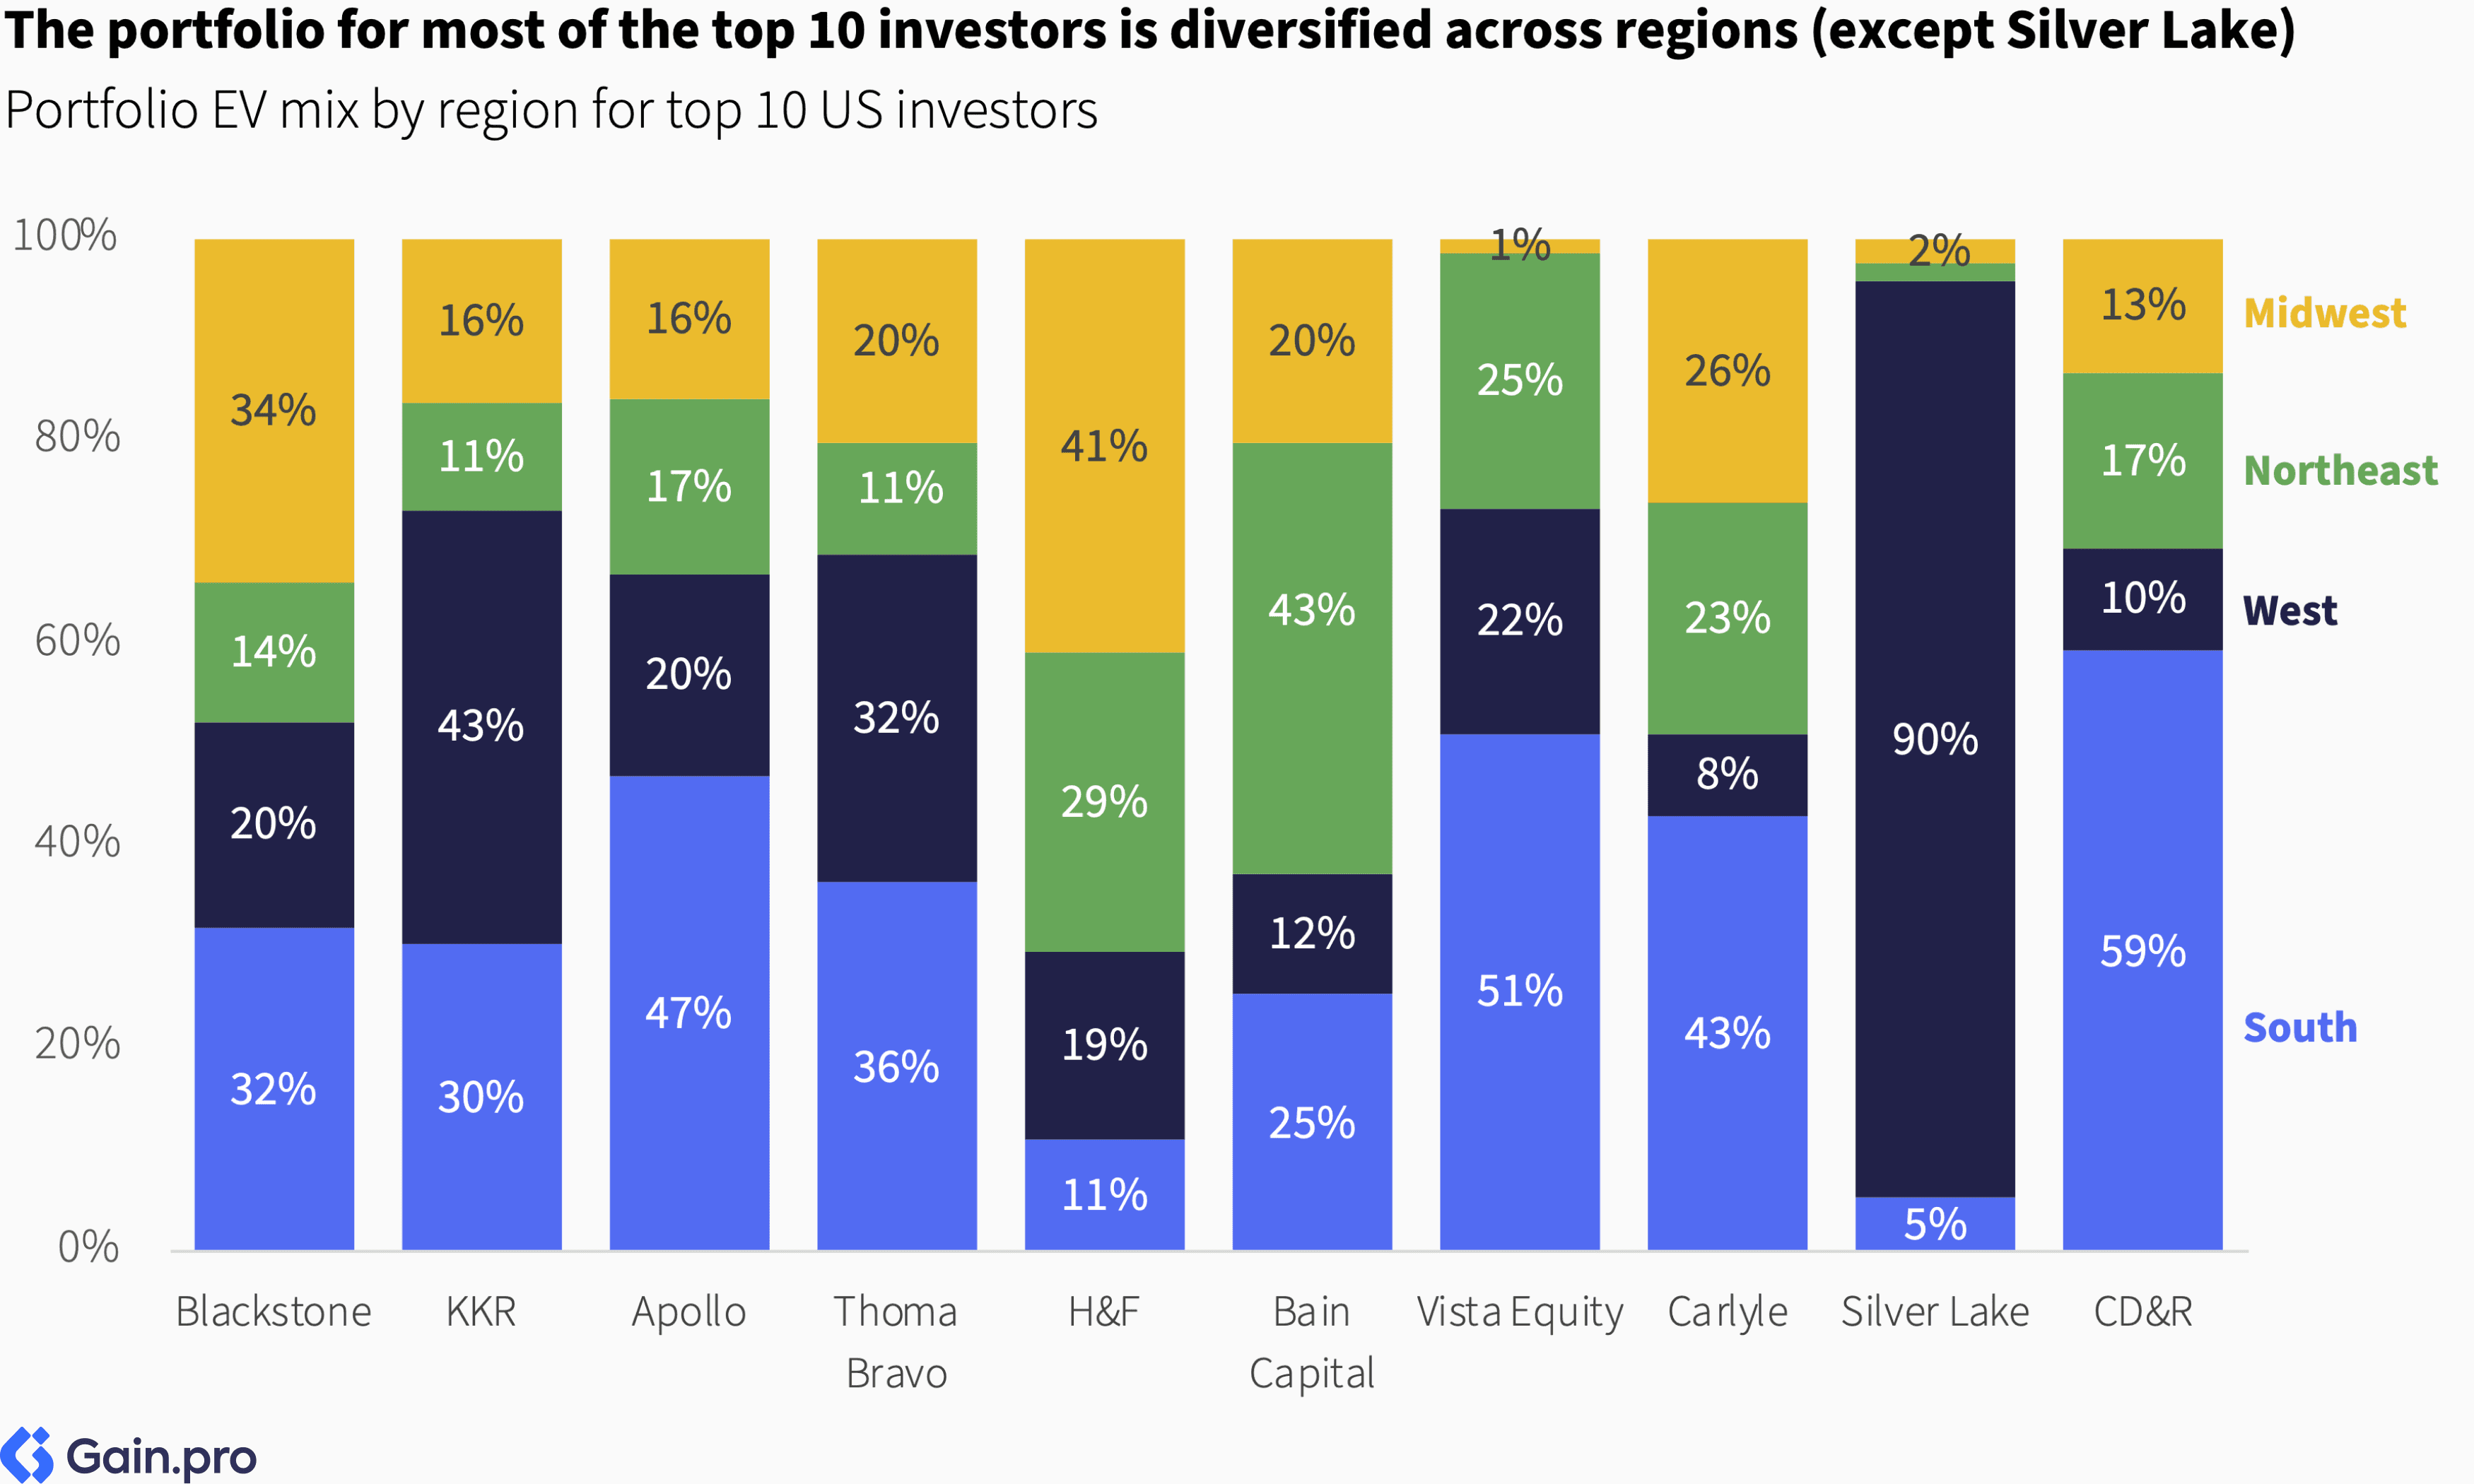
Regionally, the portfolios for the top 10 investors are well diversified. The only exception is Silver Lake, with 90% of its portfolio EV concentrated in the West.
Chapter 02: Sector 50 Rankings
This table showcases the top 50 private equity firms ranked by sector in the US. Use the buttons to navigate between the different sector rankings.
Top Investors
Leading the sector 50 rankings are Thoma Bravo (TMT), Blackstone (Services and Financial Services), Apollo (Industrials), KKR (Energy & Materials), Roark Capital (Consumer), and Sycamore Partners (Science & Health). Thoma Bravo in TMT and Roark Capital in Consumer stand out for their strong sector focus, with 95% and 80% of their portfolio EV concentrated in these sectors, respectively.

Sector Insights
By sector, TMT is by far the largest PE sector in the US (34% of EV), followed by Services (20%) and Science & Health (12%). Combined, these three sectors account for over two-thirds of the US 250 EV. At the subsector level, the largest ones are Software (24%), Professional Services (10%), Manufacturing (9%), Healthcare Services (7%), and Technical Services (6%).

Broadly, the sector mix for PE entry activity has changed. The share of TMT (+8pp) and Services (+5pp) has grown as investors have gravitated towards asset-light and fast-growing businesses that hold a growing share of the economy. The share of Consumer (-5pp) and Industrials (-10pp) has come down, driven by slowing underlying growth rates and a challenging exit environment.

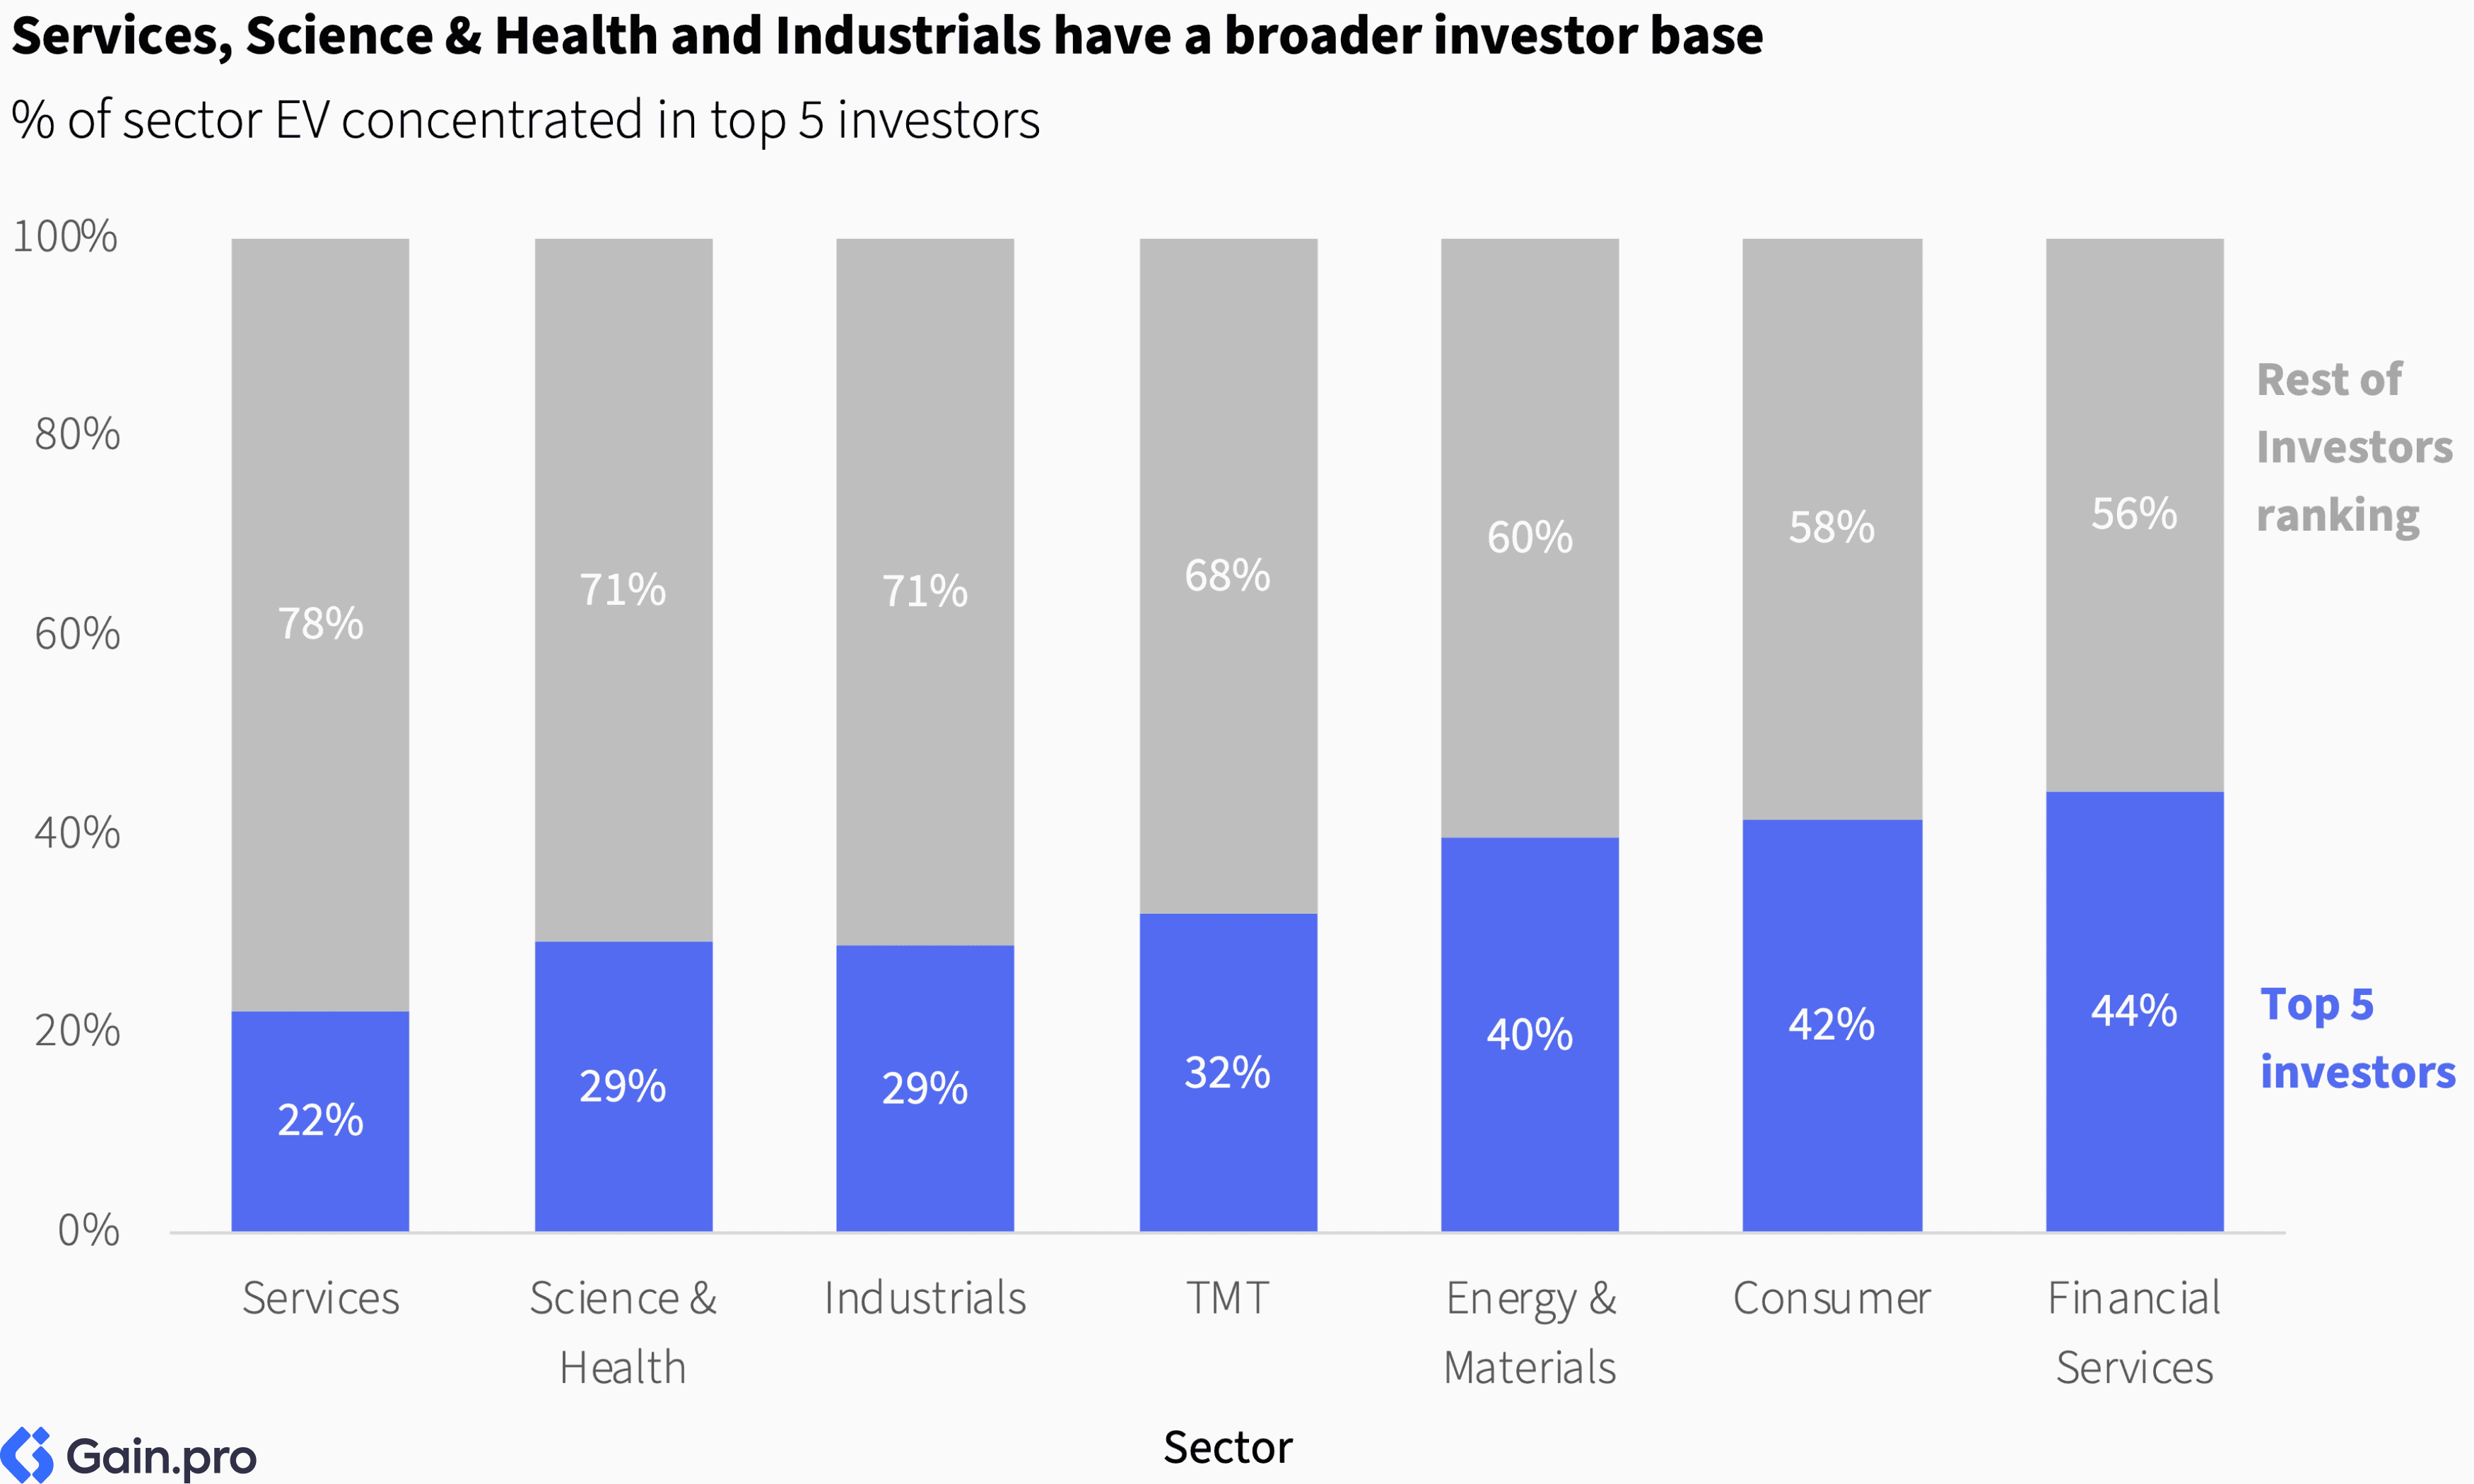
By sector, Consumer, Financial Services, and Energy & Materials are the most concentrated in terms of investor ownership. The top 5 investors account for more than 40% of EV in each of these sectors. On the other hand, Services, Science & Health, and Industrials exhibit a broader investor base, with multiple investors participating across assets of varying sizes.
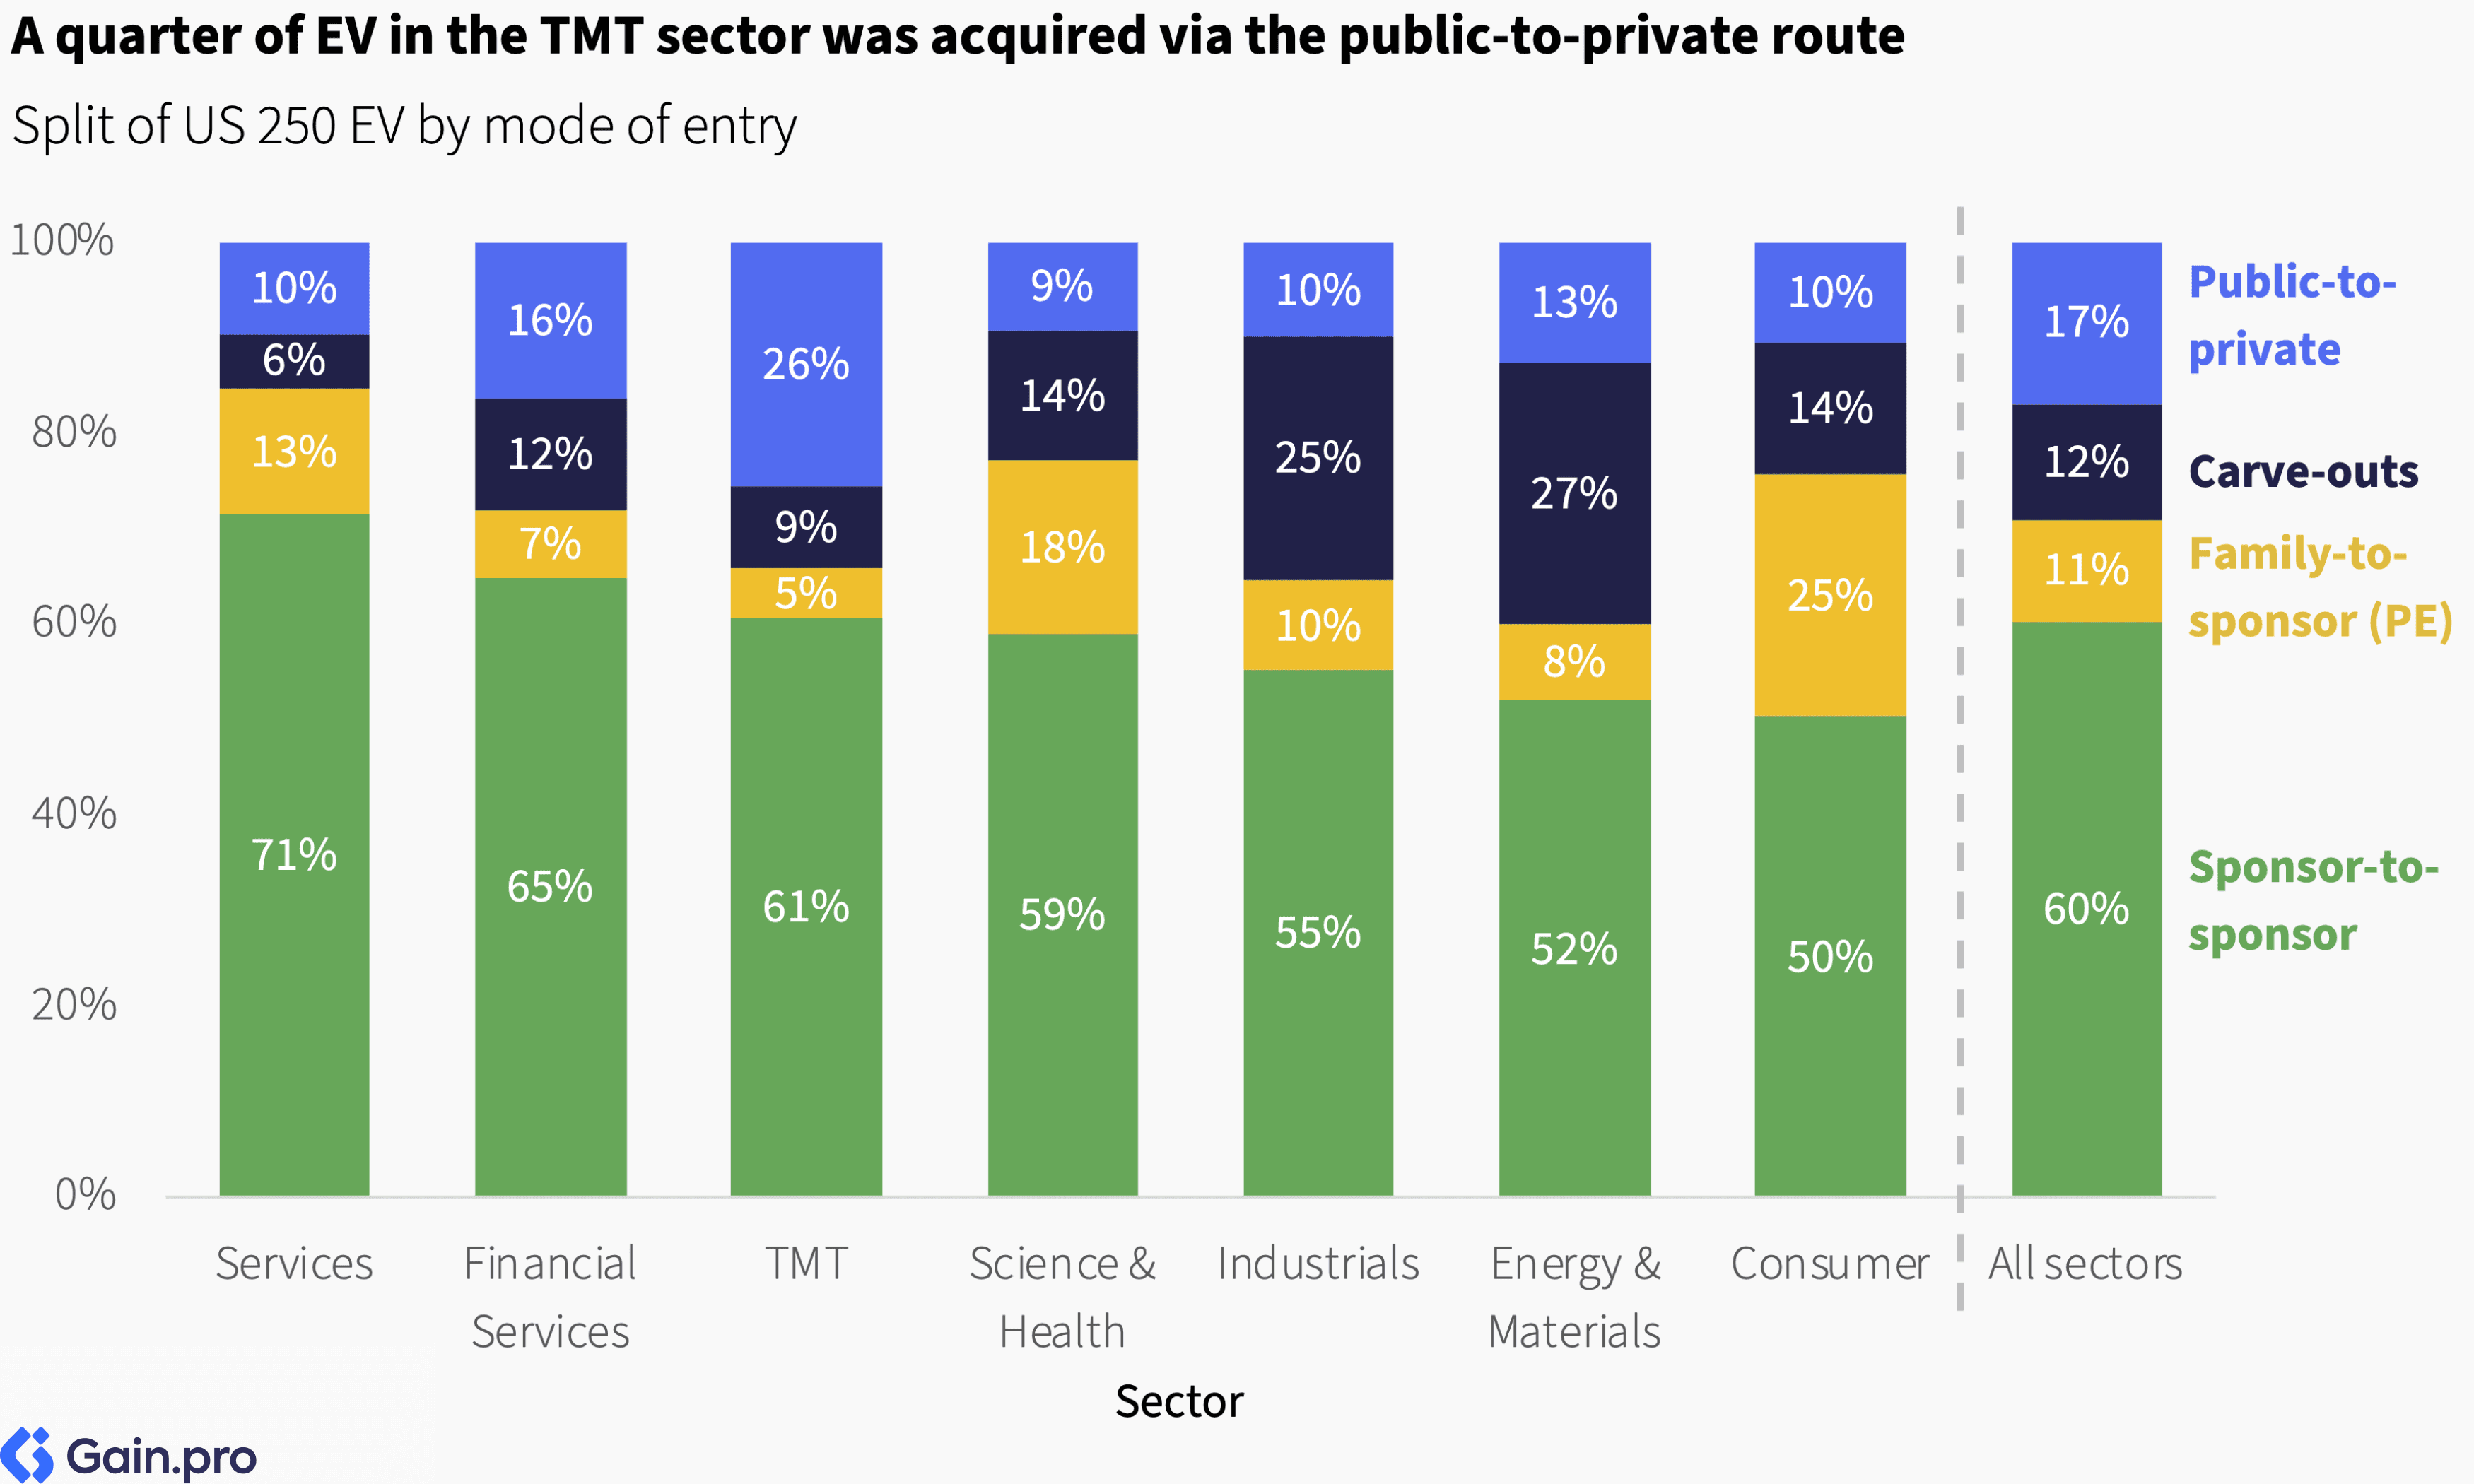
26% of US 250 EV in TMT was acquired through the public-to-private route — the highest among all sectors. Broadly, the sponsor-to-sponsor route remains the most common, representing approximately 60% of EV acquired across sectors (Services being slightly higher at 71% of EV). Carve-outs are notably more common in Energy & Materials (27%) and Industrials (25%), driven by large-scale conglomerates divesting assets to realign their strategic focus.
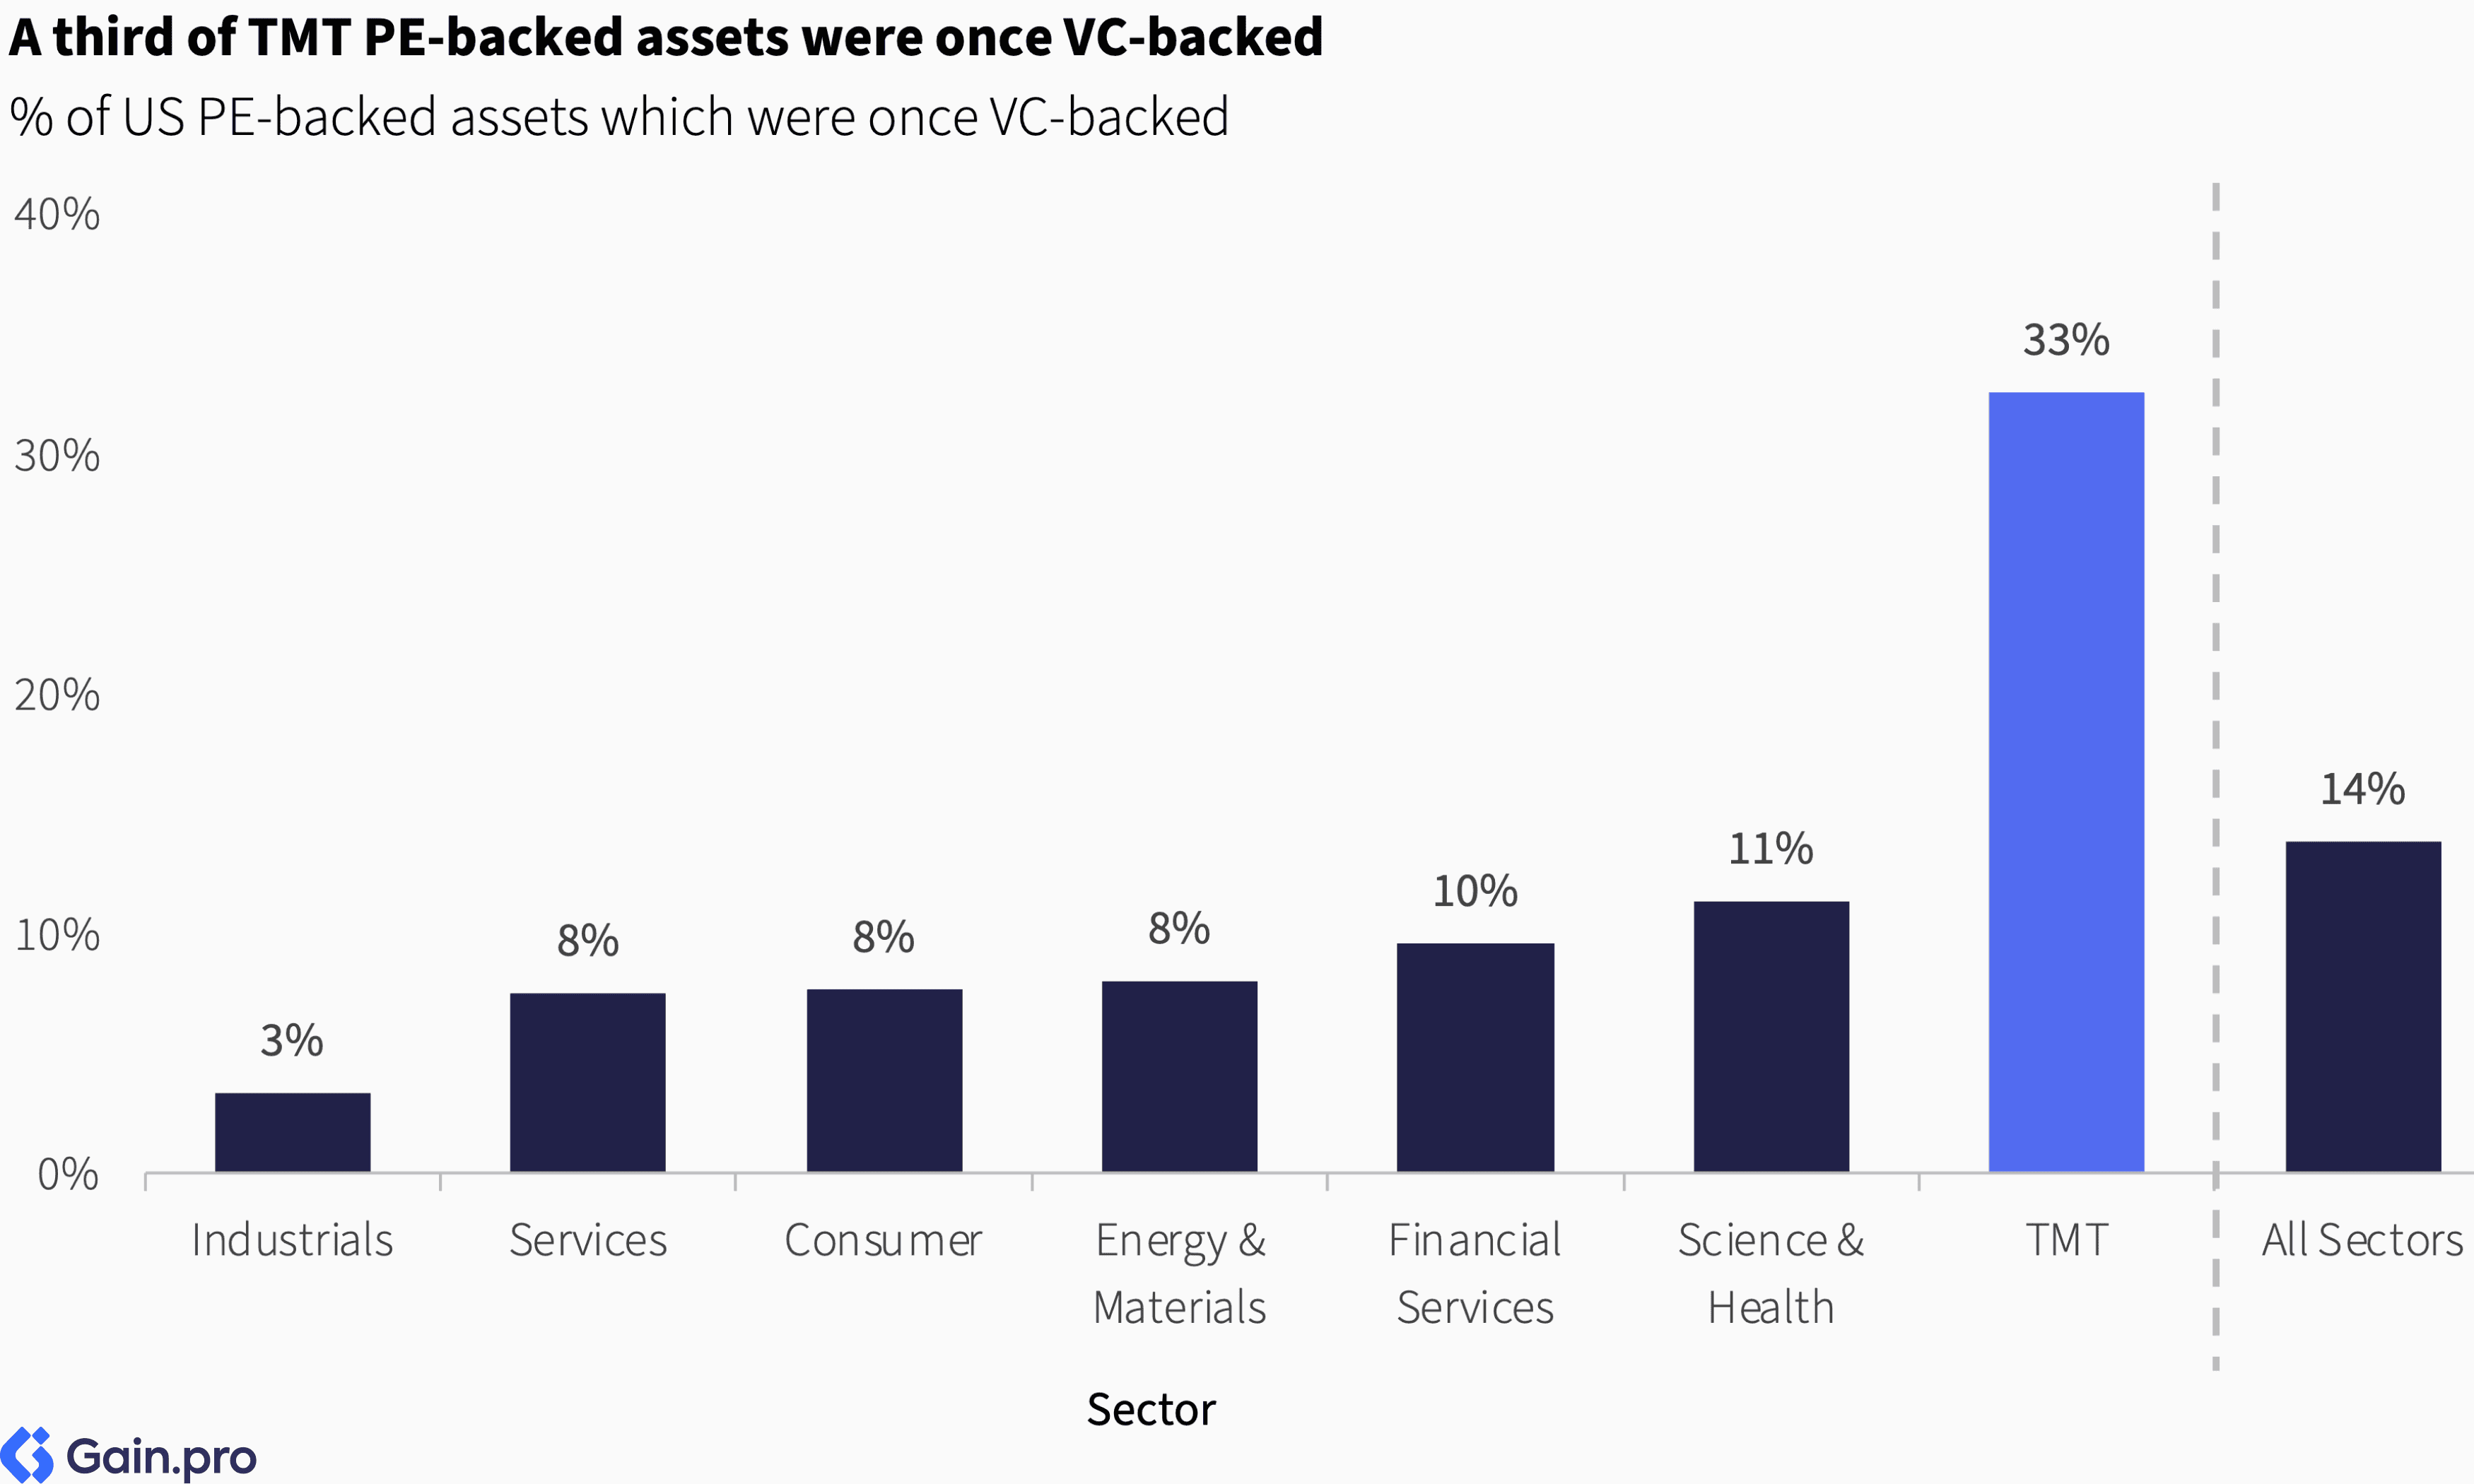
A third of TMT PE-backed assets were previously VC-backed. This represents a natural progression of ownership as companies mature and require additional capital. Biotech is another subsector with a high concentration of formerly VC-backed assets.
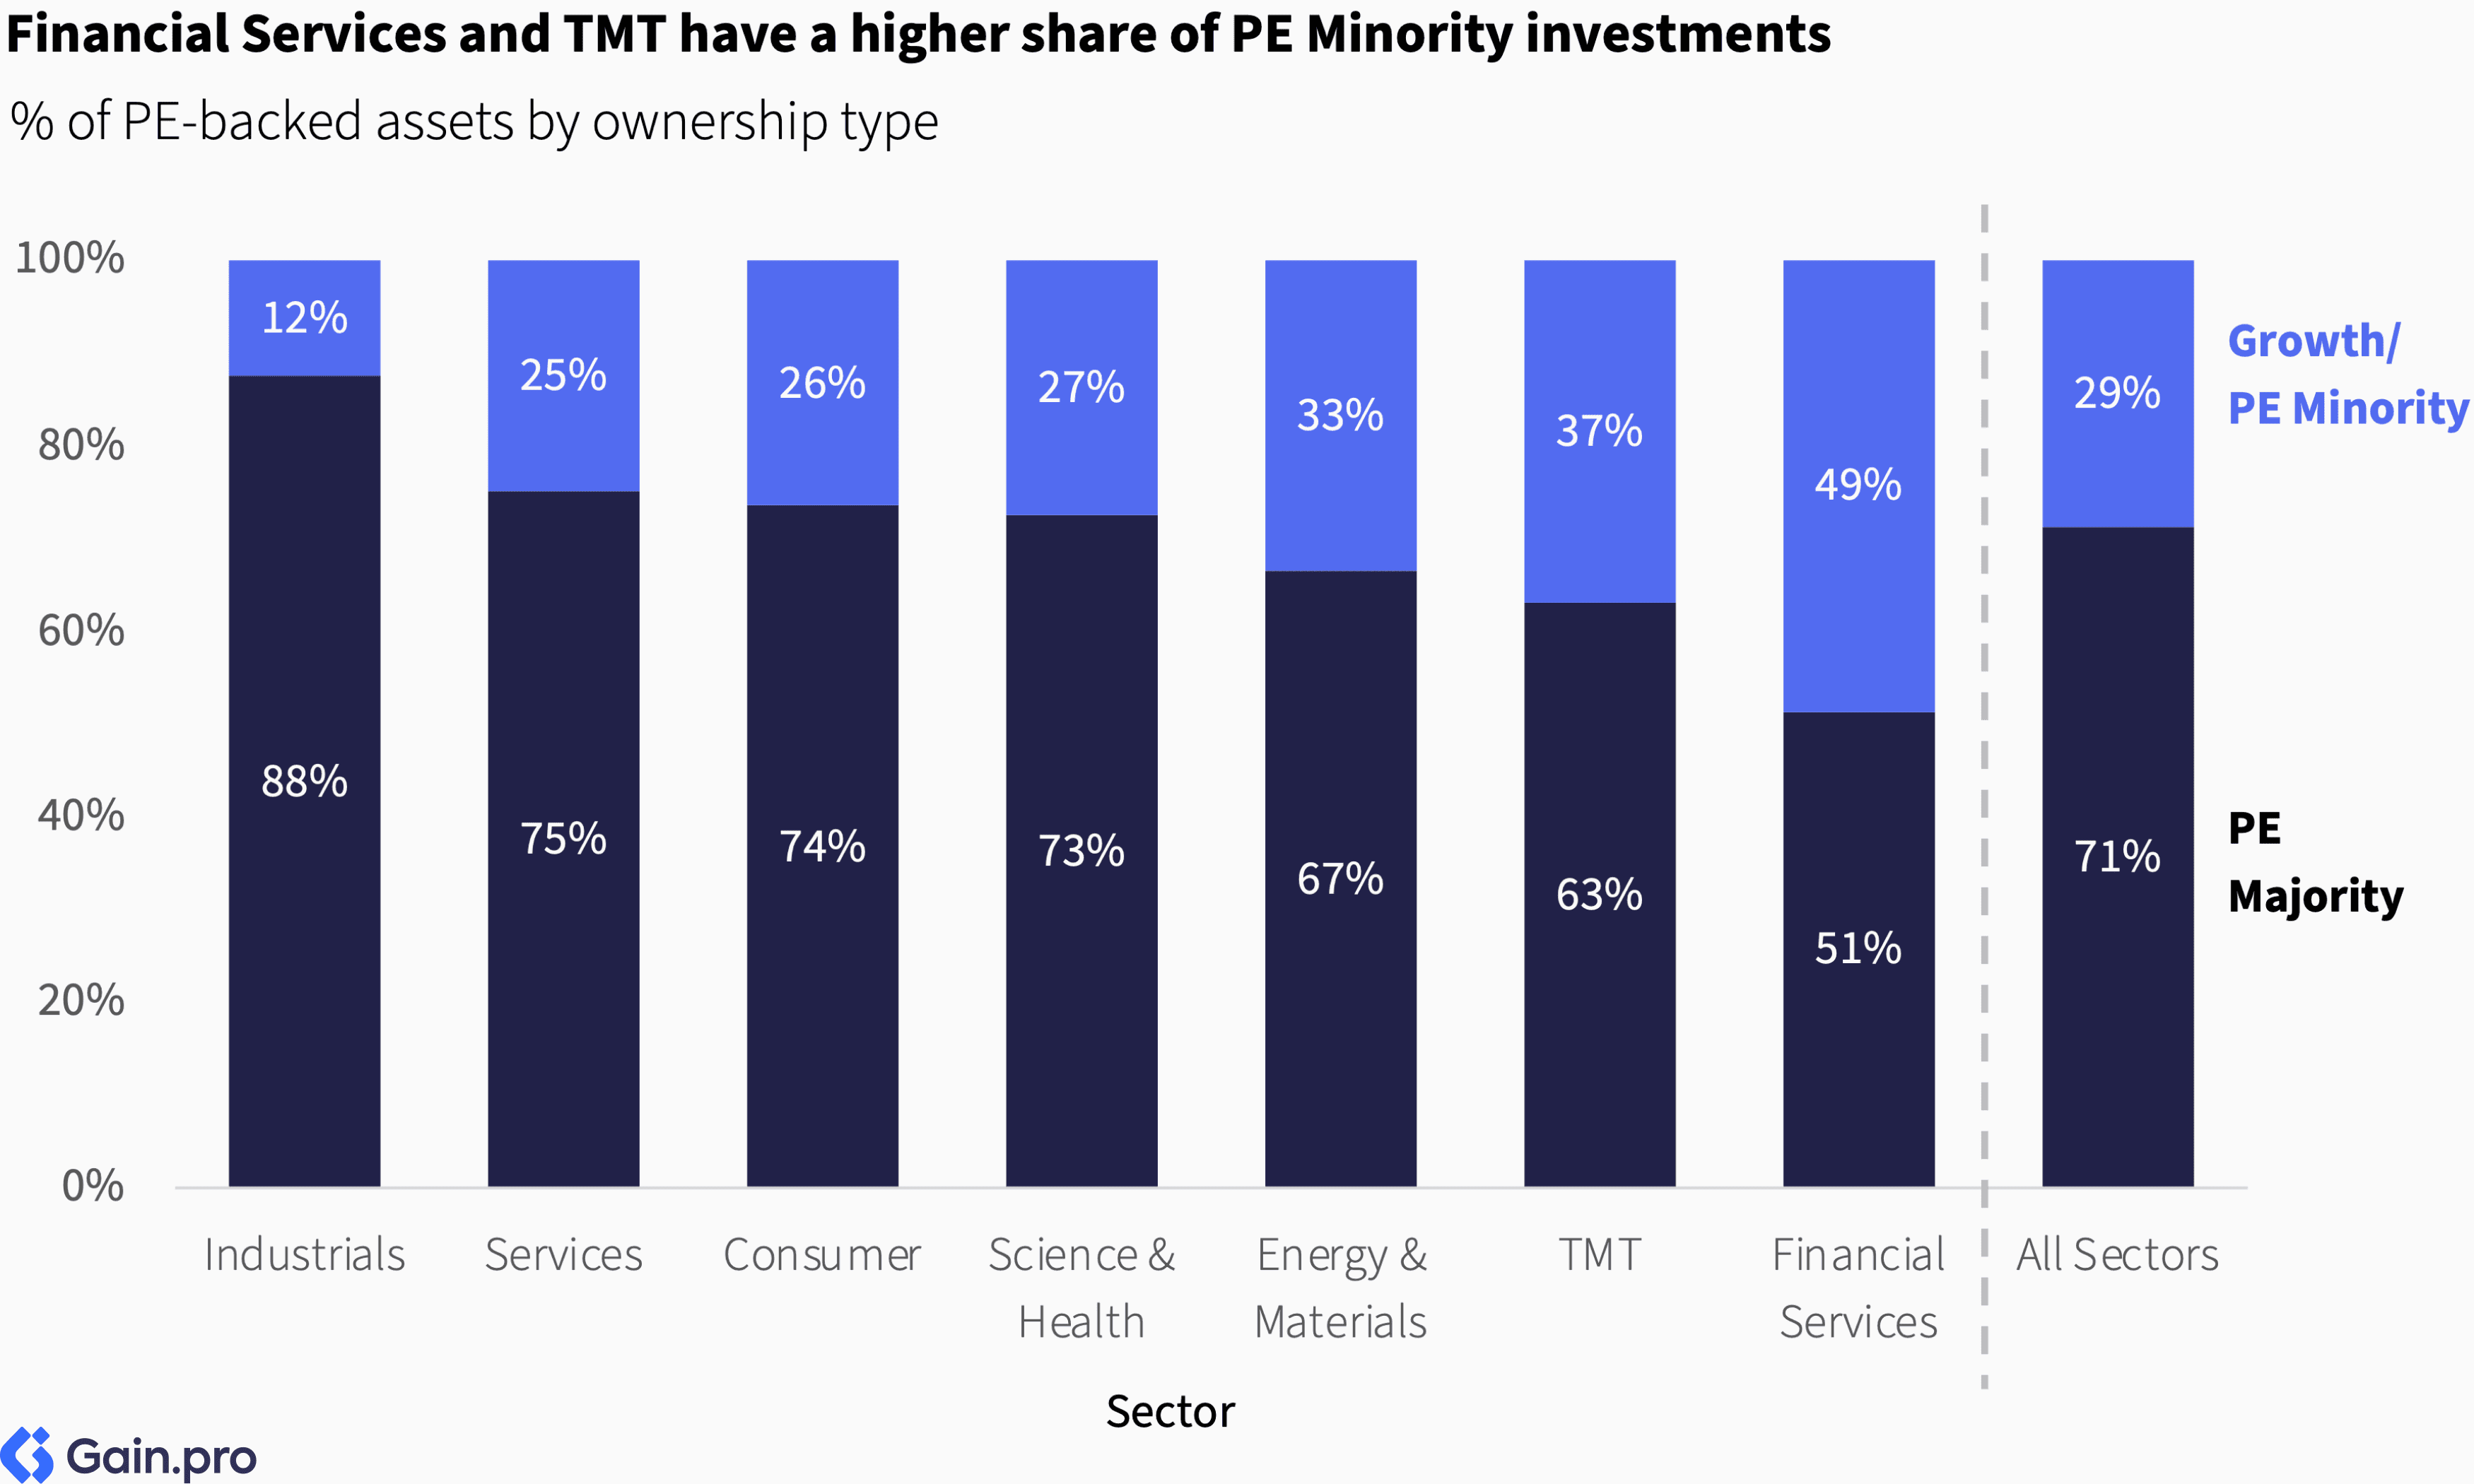
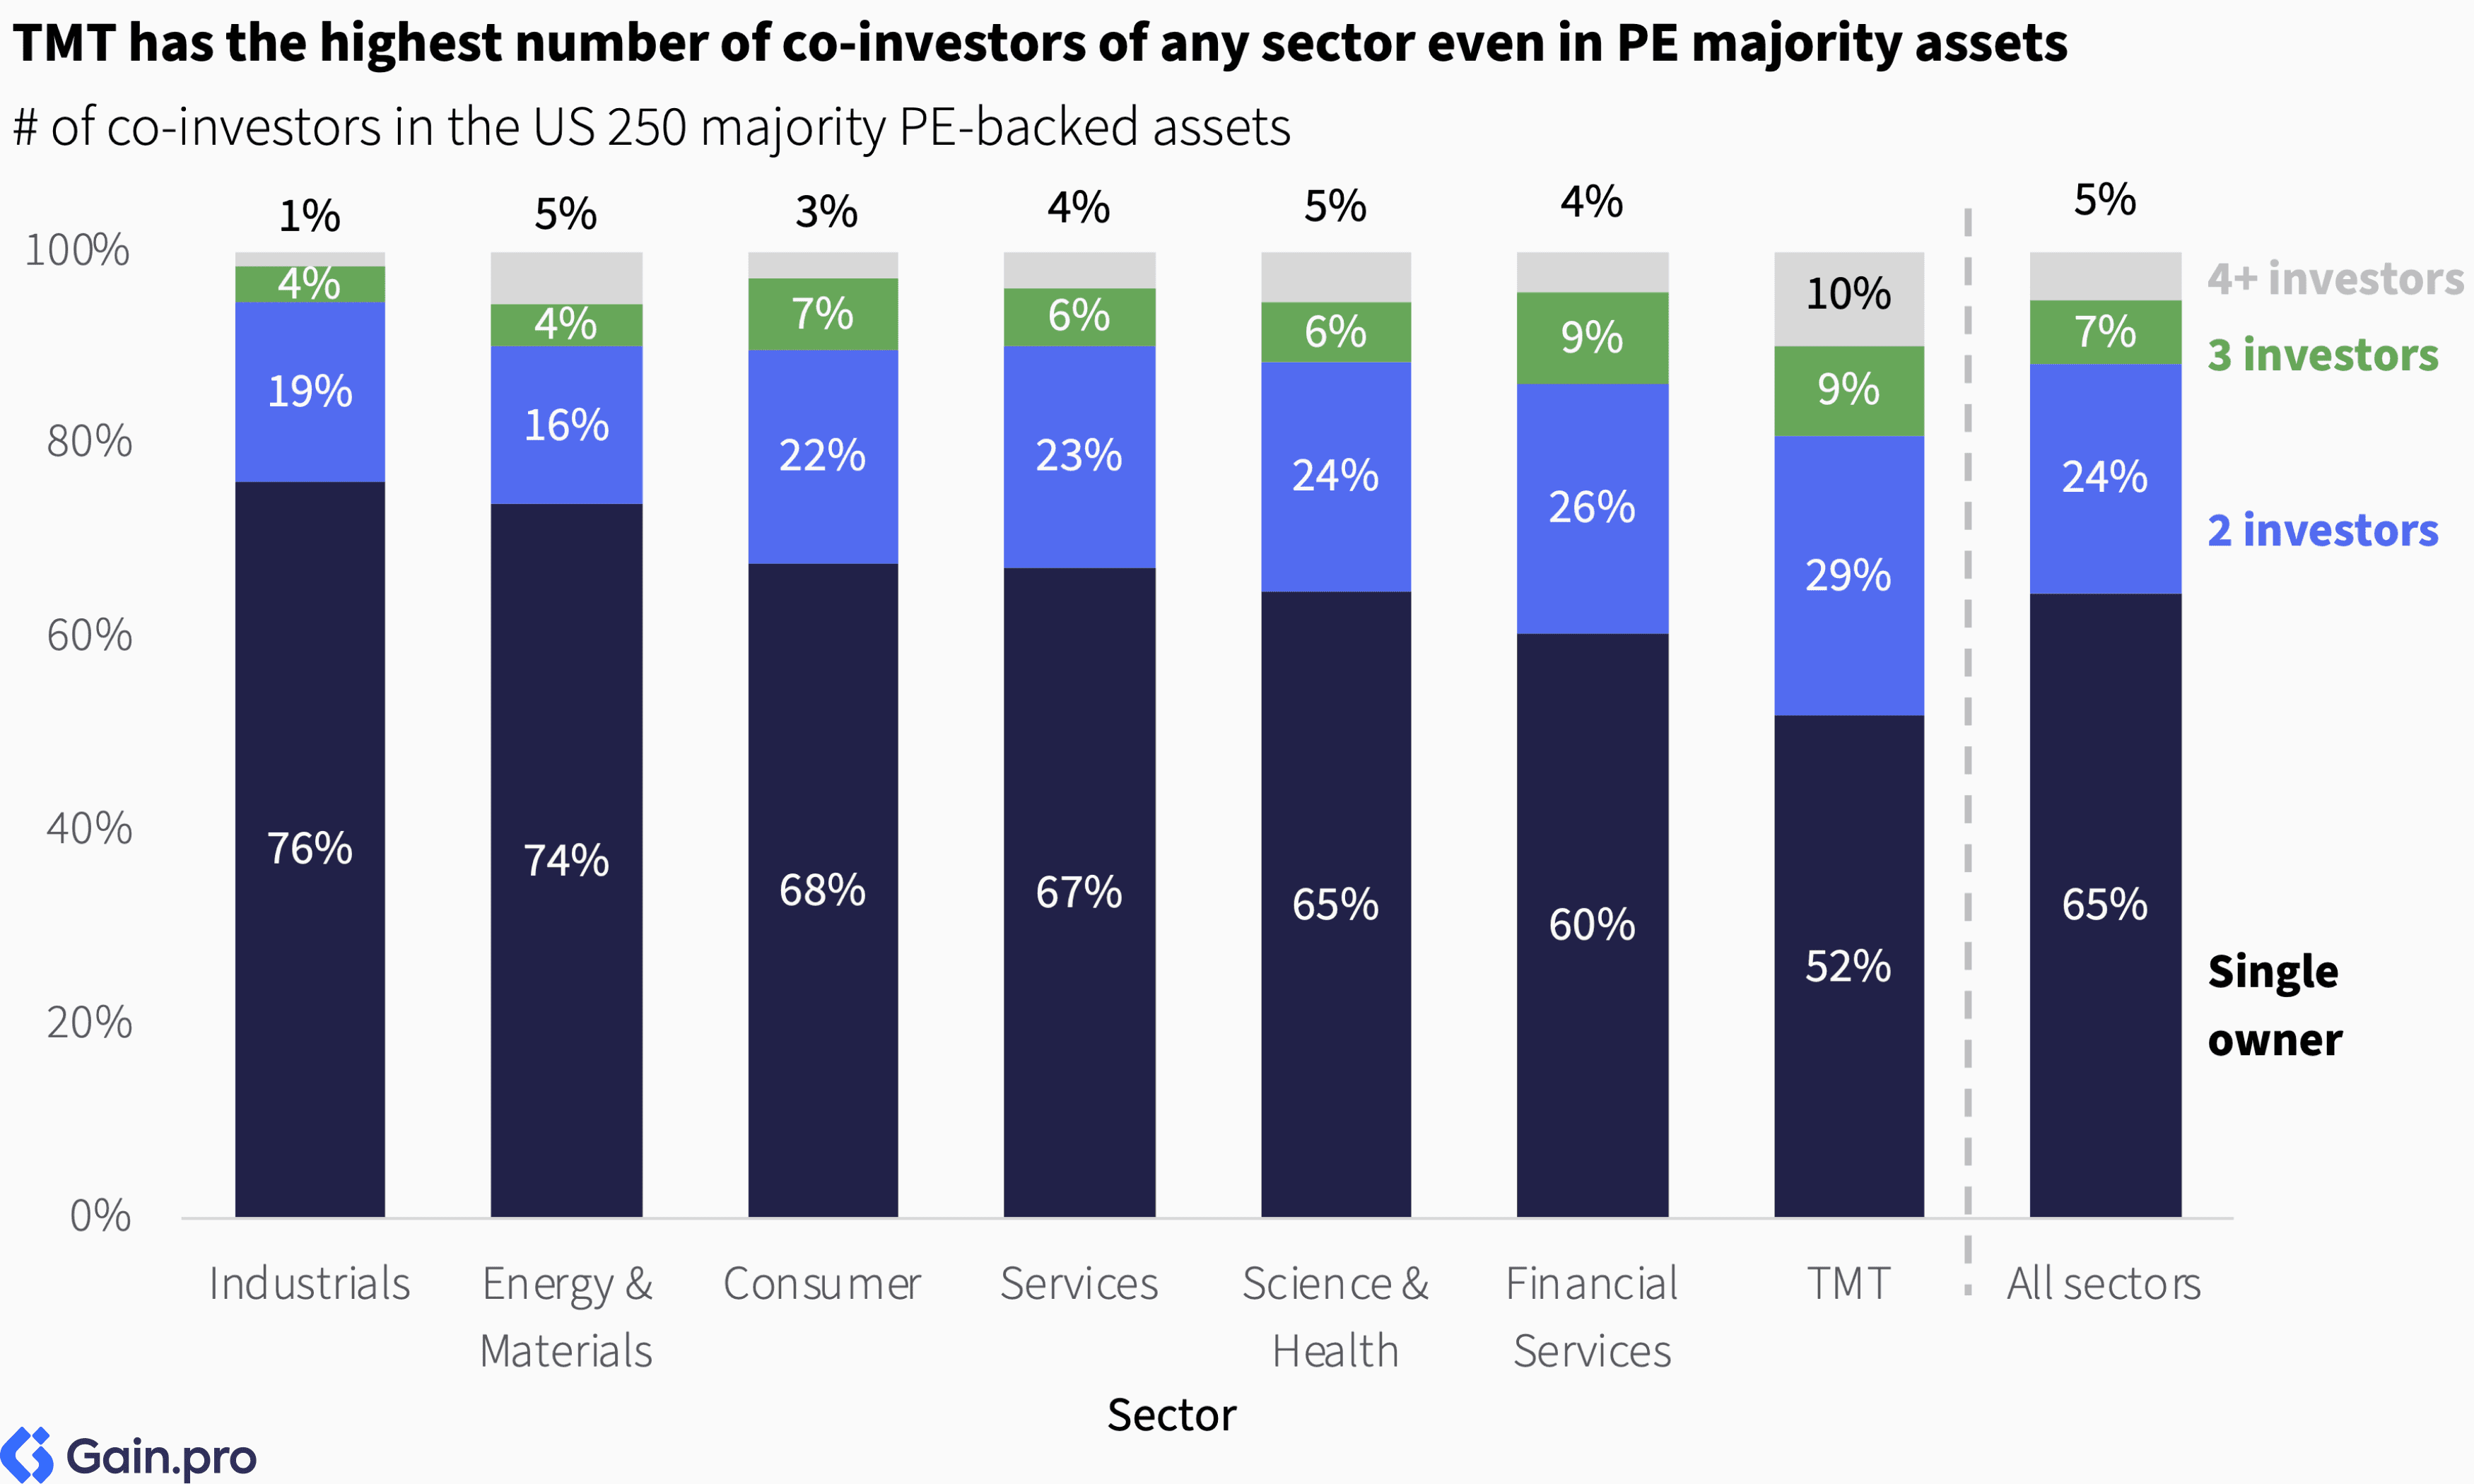
TMT and Financial Services showcase a stronger tilt towards PE minority investments, driven by a higher share of growth equity investments. In contrast, Industrials (88%), Services (75%), and Consumer (74%) are dominated by traditional majority buyouts, sectors where there is more of an opportunity for operational transformation.
Even within PE majority-owned assets, TMT tends to have multiple co-investors. 48% of TMT assets have at least two PE co-investors. This often reflects early-stage VC investors retaining stakes or reinvesting alongside new PE investors. In contrast, Industrials and Energy & Materials show more concentrated ownership, with over 70% of assets controlled by a single owner.
Domestic sponsors dominate across all sectors. International sponsors' presence is most notable in Energy & Materials (20%), Services (19%), and Science & Health (16%).
Chapter 03: Region 50 Rankings
This table showcases the top 50 private equity firms ranked by region across the US. Use the buttons to navigate between the different regional rankings.
Top Investors
Leading the region 50 rankings are Blackstone (Midwest and South), KKR (West), and Bain Capital (Northeast). Often, the regional leaders are far from isolated — many of the same firms dominate across multiple regions, demonstrating the breadth of their portfolios.

Regional Insights
The South holds the largest share of US 250 EV, supported by large concentrations in Texas (12%), Florida (6%), and Georgia (5%). California, which contributes 14% of EV—the most of any state—drives the West's share. The Midwest has a smaller share of US 250 EV, with Illinois (9%) as its largest state. In the Northeast, meanwhile, New York (6%) and Massachusetts (6%) dominate. Overall, the US 250 assets are highly concentrated geographically, with the top four states holding approximately 40% of EV and the top 15 accounting for 80%.

By city, New York, Chicago, and Houston serve as the leading hubs for portfolio company headquarters, with Austin, Atlanta, Dallas, Boston, and San Francisco forming the next tier. Other notable hubs include Denver, Charlotte, Phoenix, Los Angeles, and Nashville.

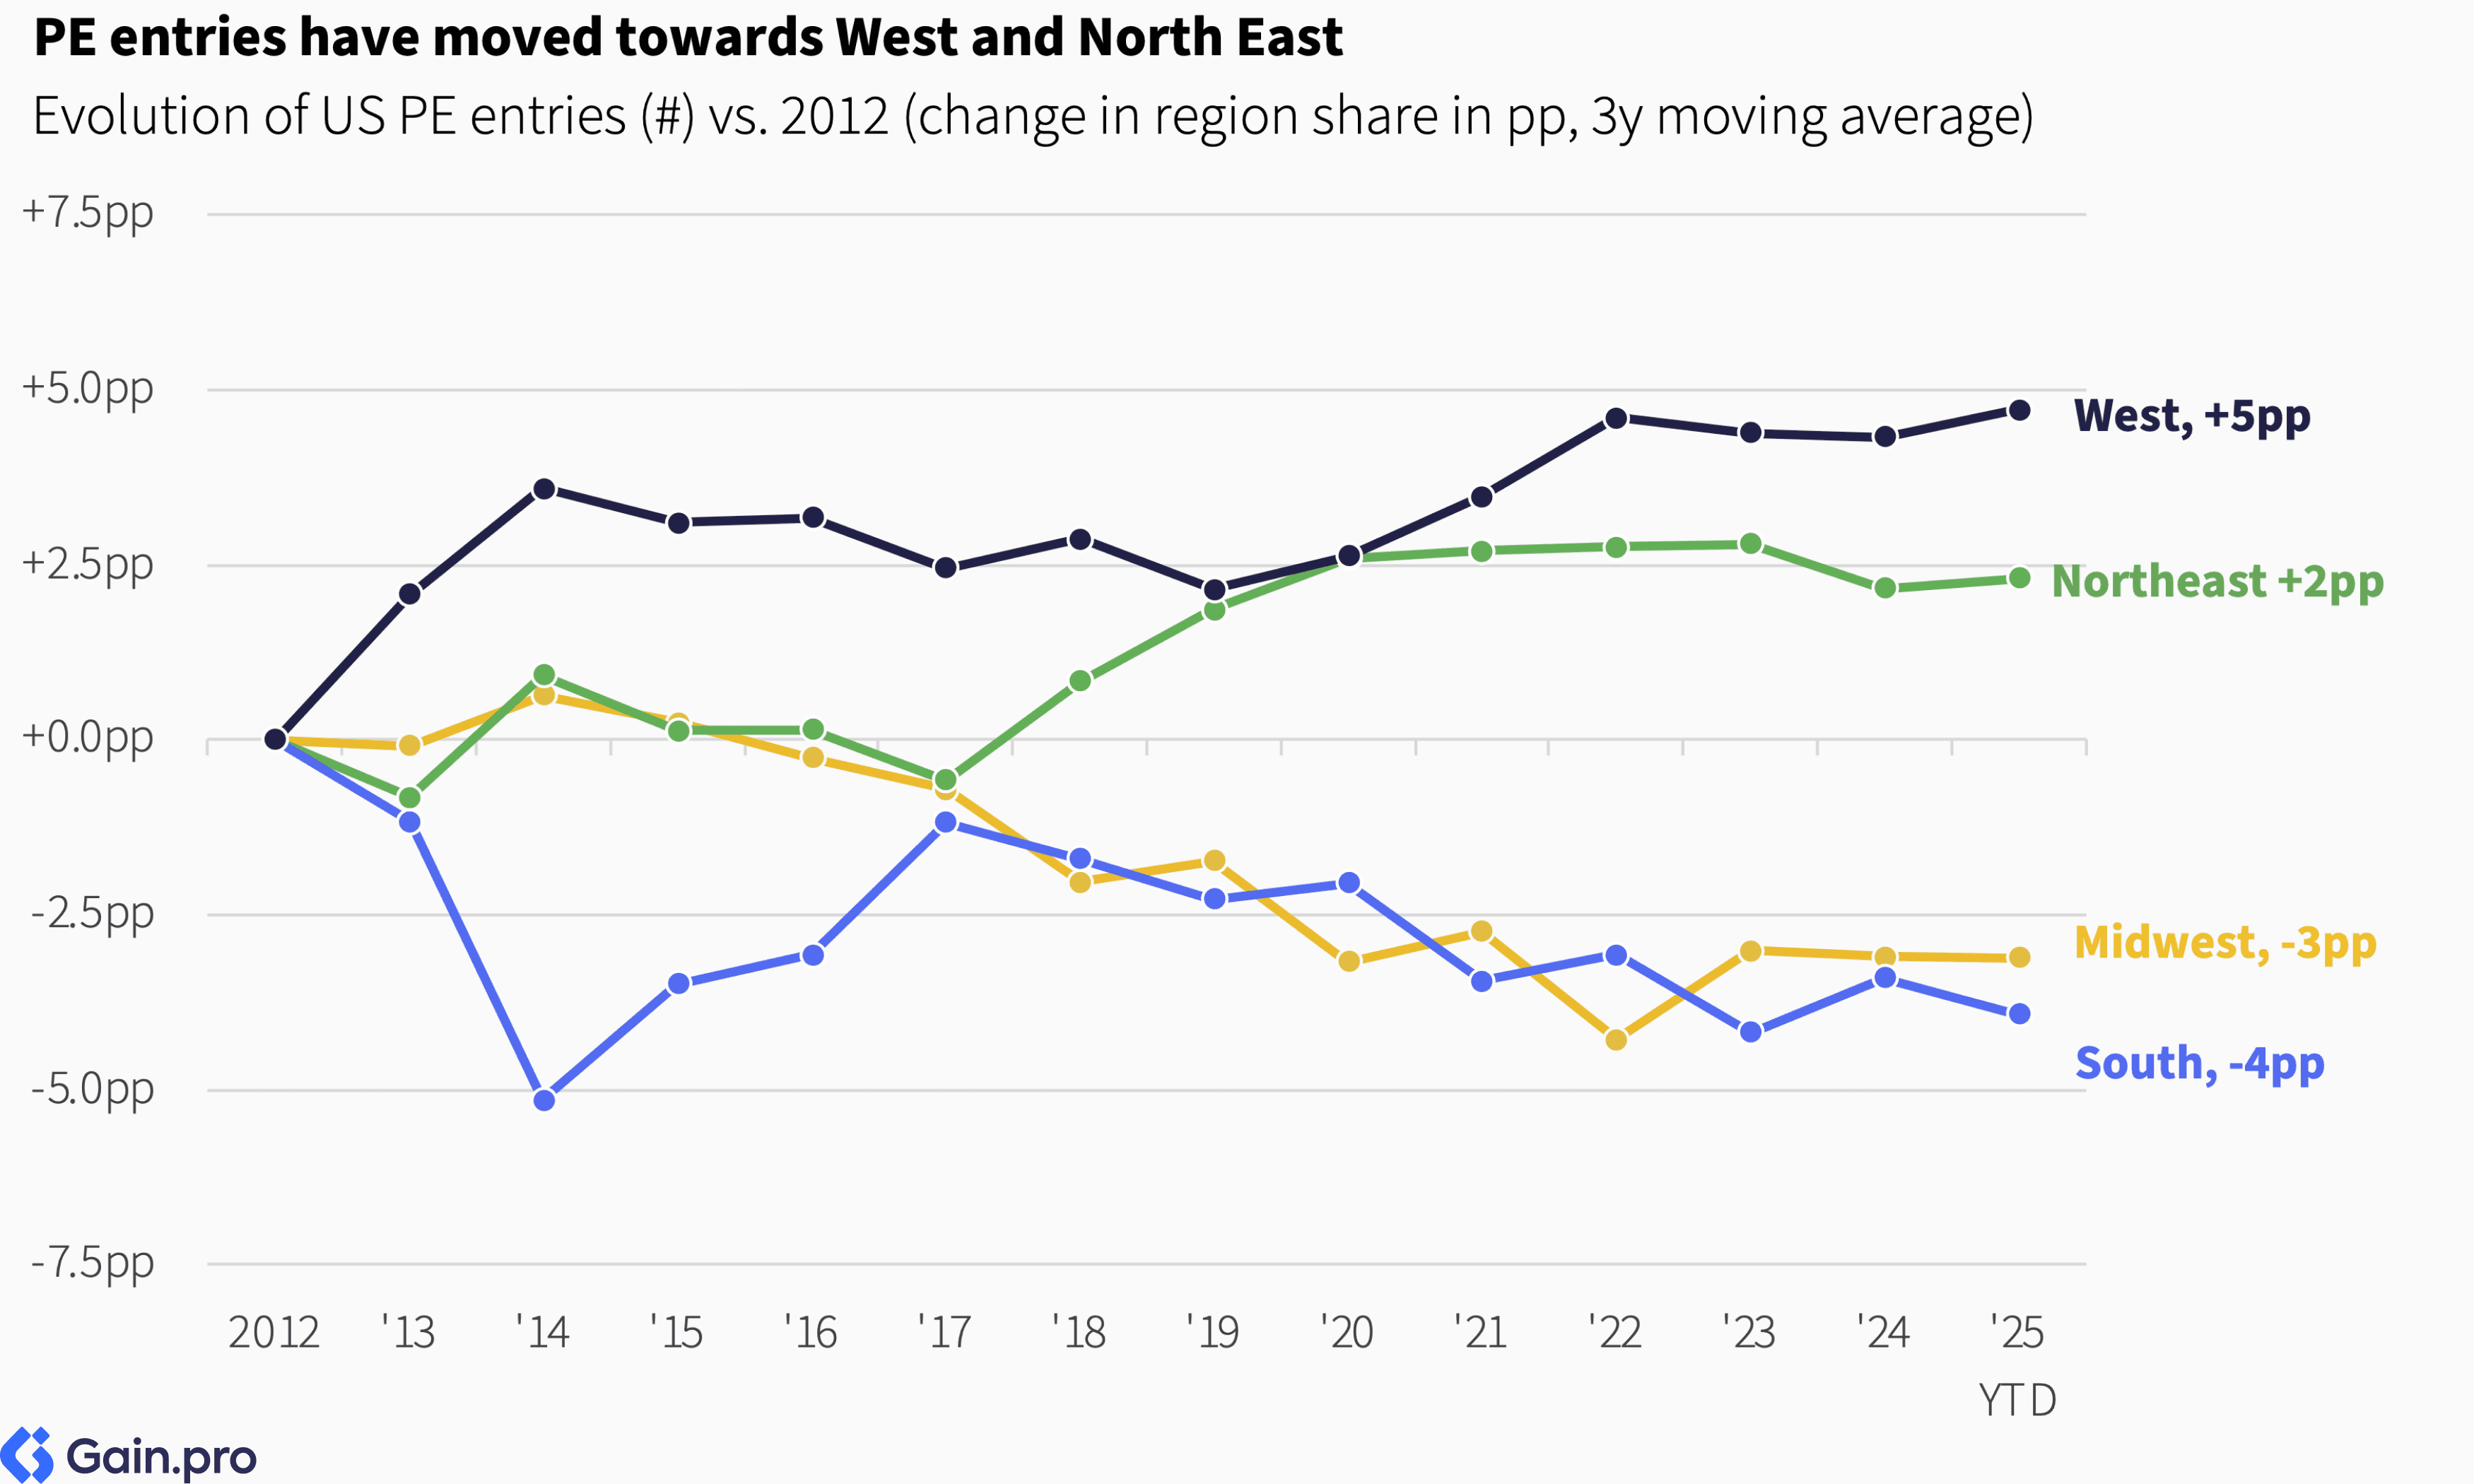
Over the last decade, the share of PE entries has grown for the West and the Northeast. This shift reflects both regions' higher concentration of TMT assets, a sector that has gained significant traction among PE investors during this period.
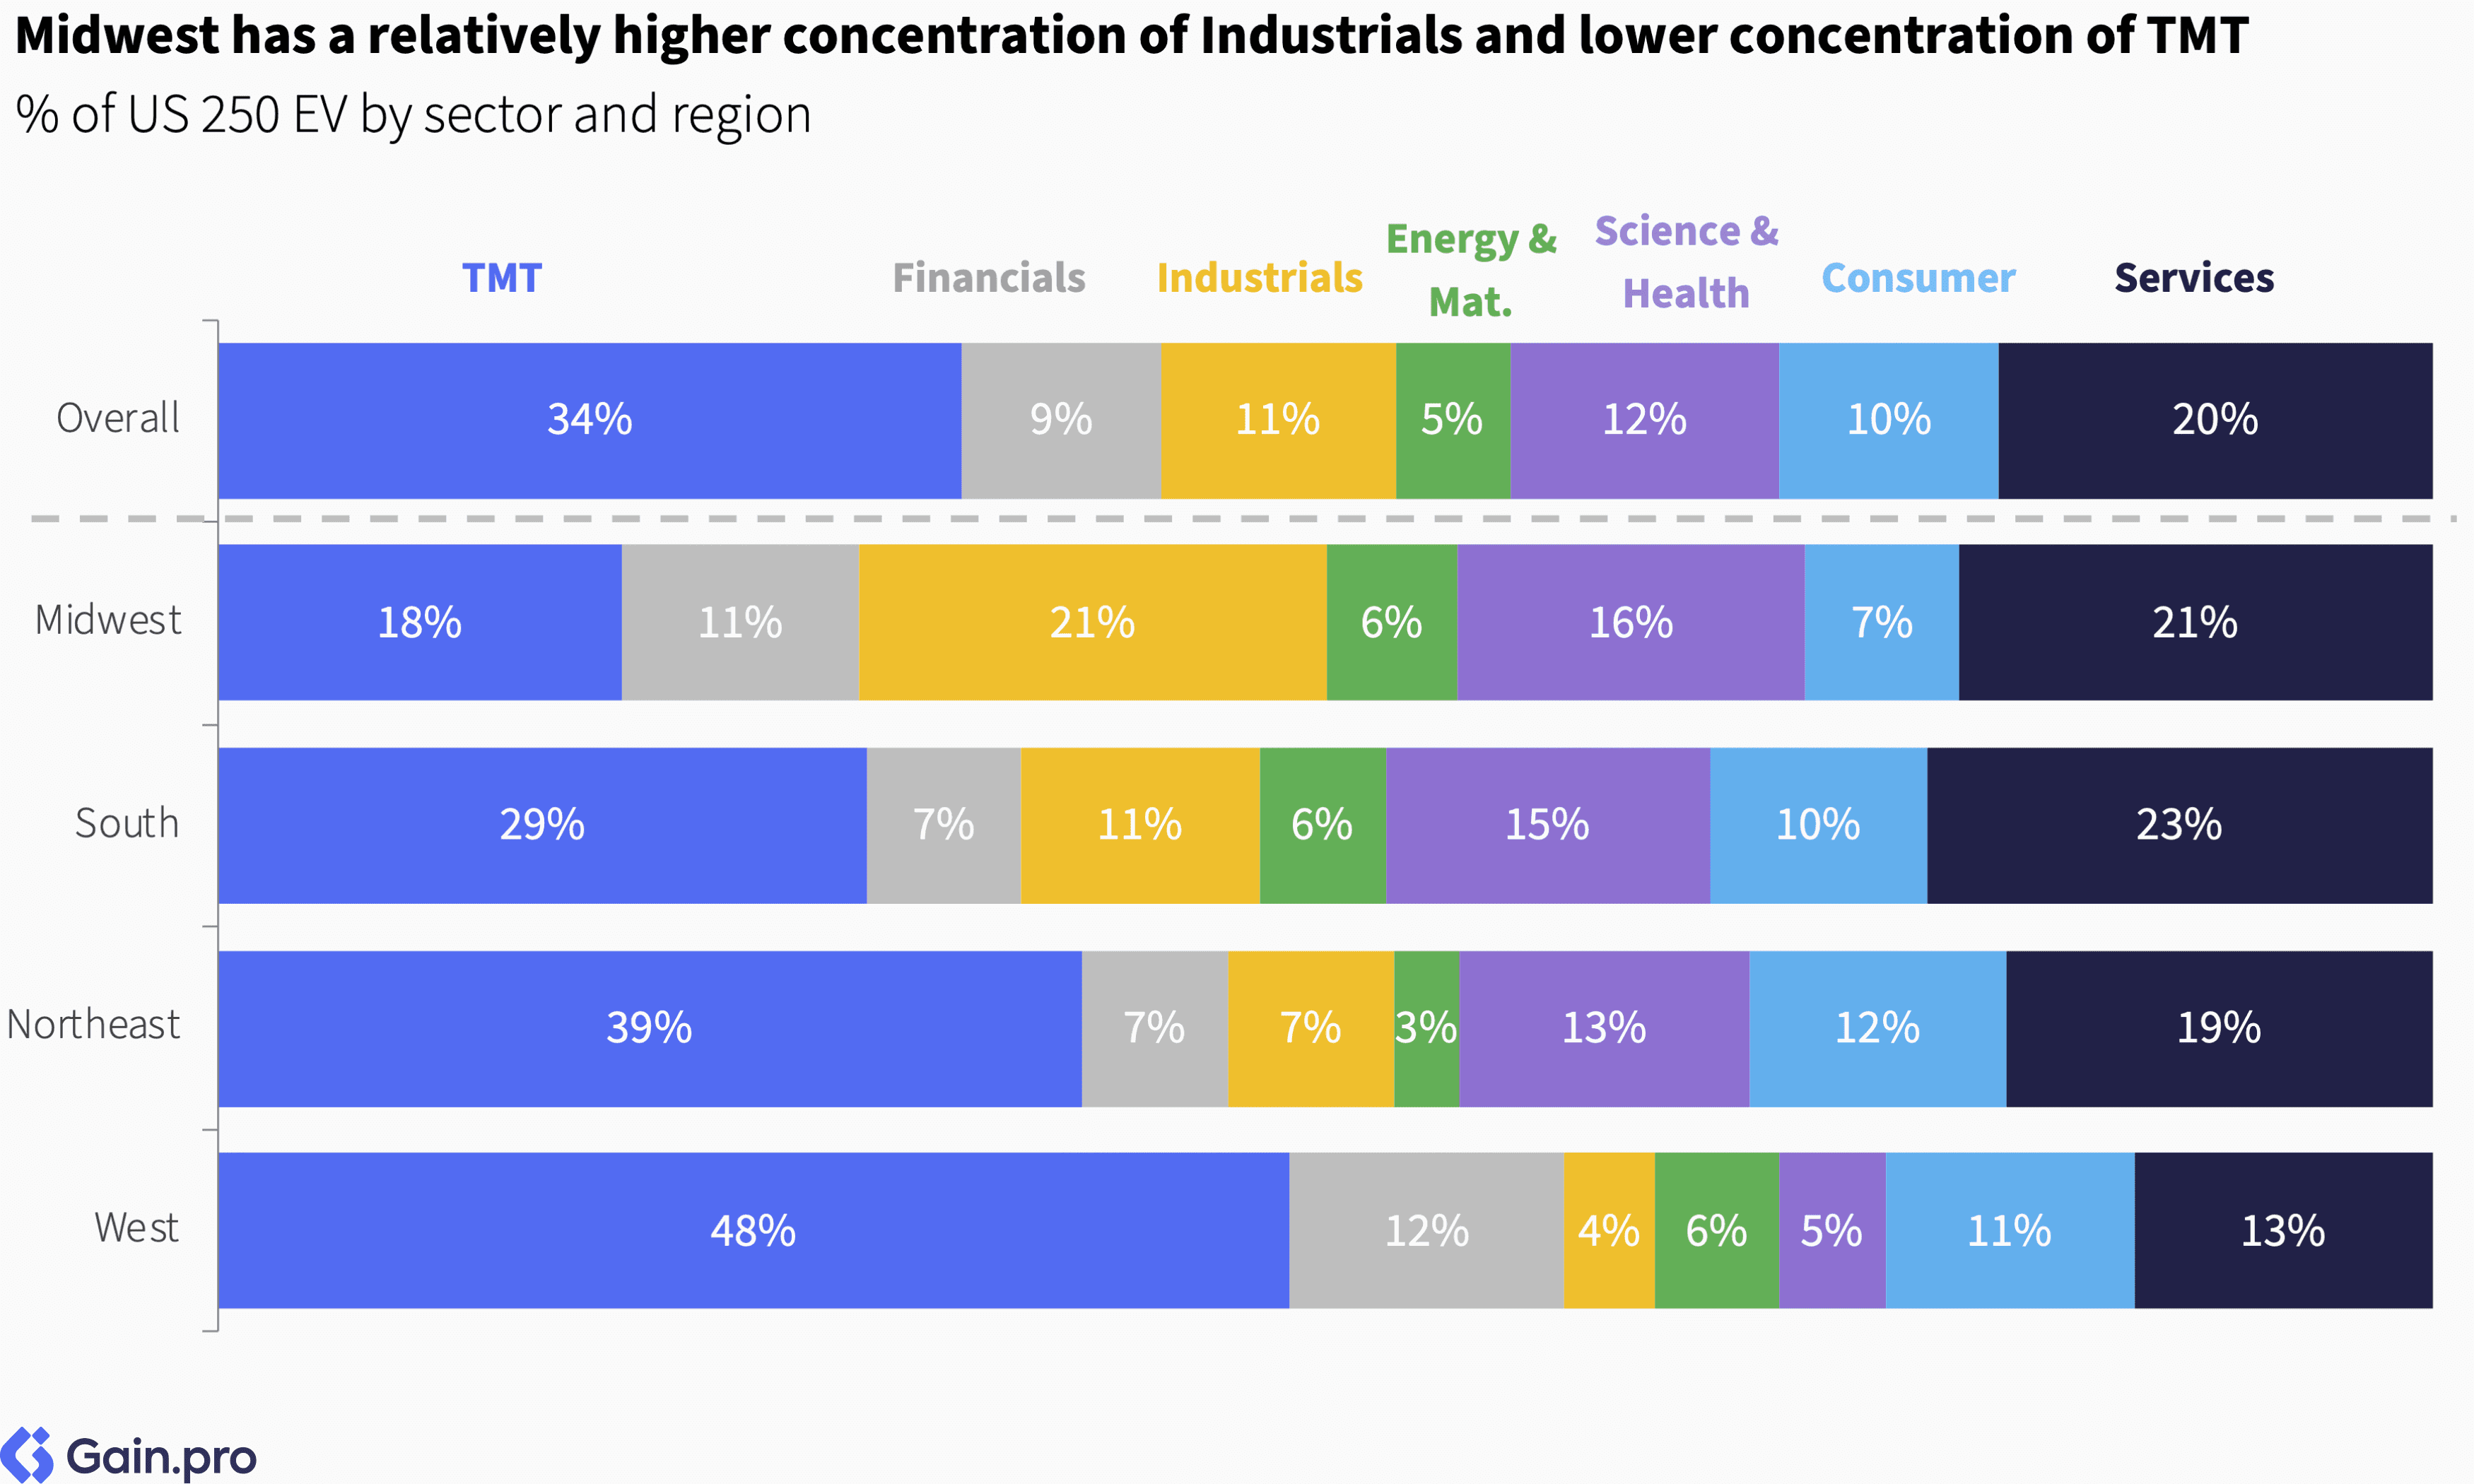
TMT is now the largest sector in three of the four US regions, with the Midwest being the only exception, where Services (21%) and Industrials (21%) have a stronger presence. In the West, TMT's share of 48% far surpasses other sectors, and is almost 4x larger than the next biggest sector.
Chapter 04: Portfolio Insights
In this section, we explore the investment portfolios of the top 30 PE investors in the ranking, analyzing key metrics such as EBITDA range, growth rates, buy-and-build activity, holding periods, and the sector/regional makeup of their US investments.
Note: We exclude from this analysis investors who have less than 5 data points for a particular metric.
By Size
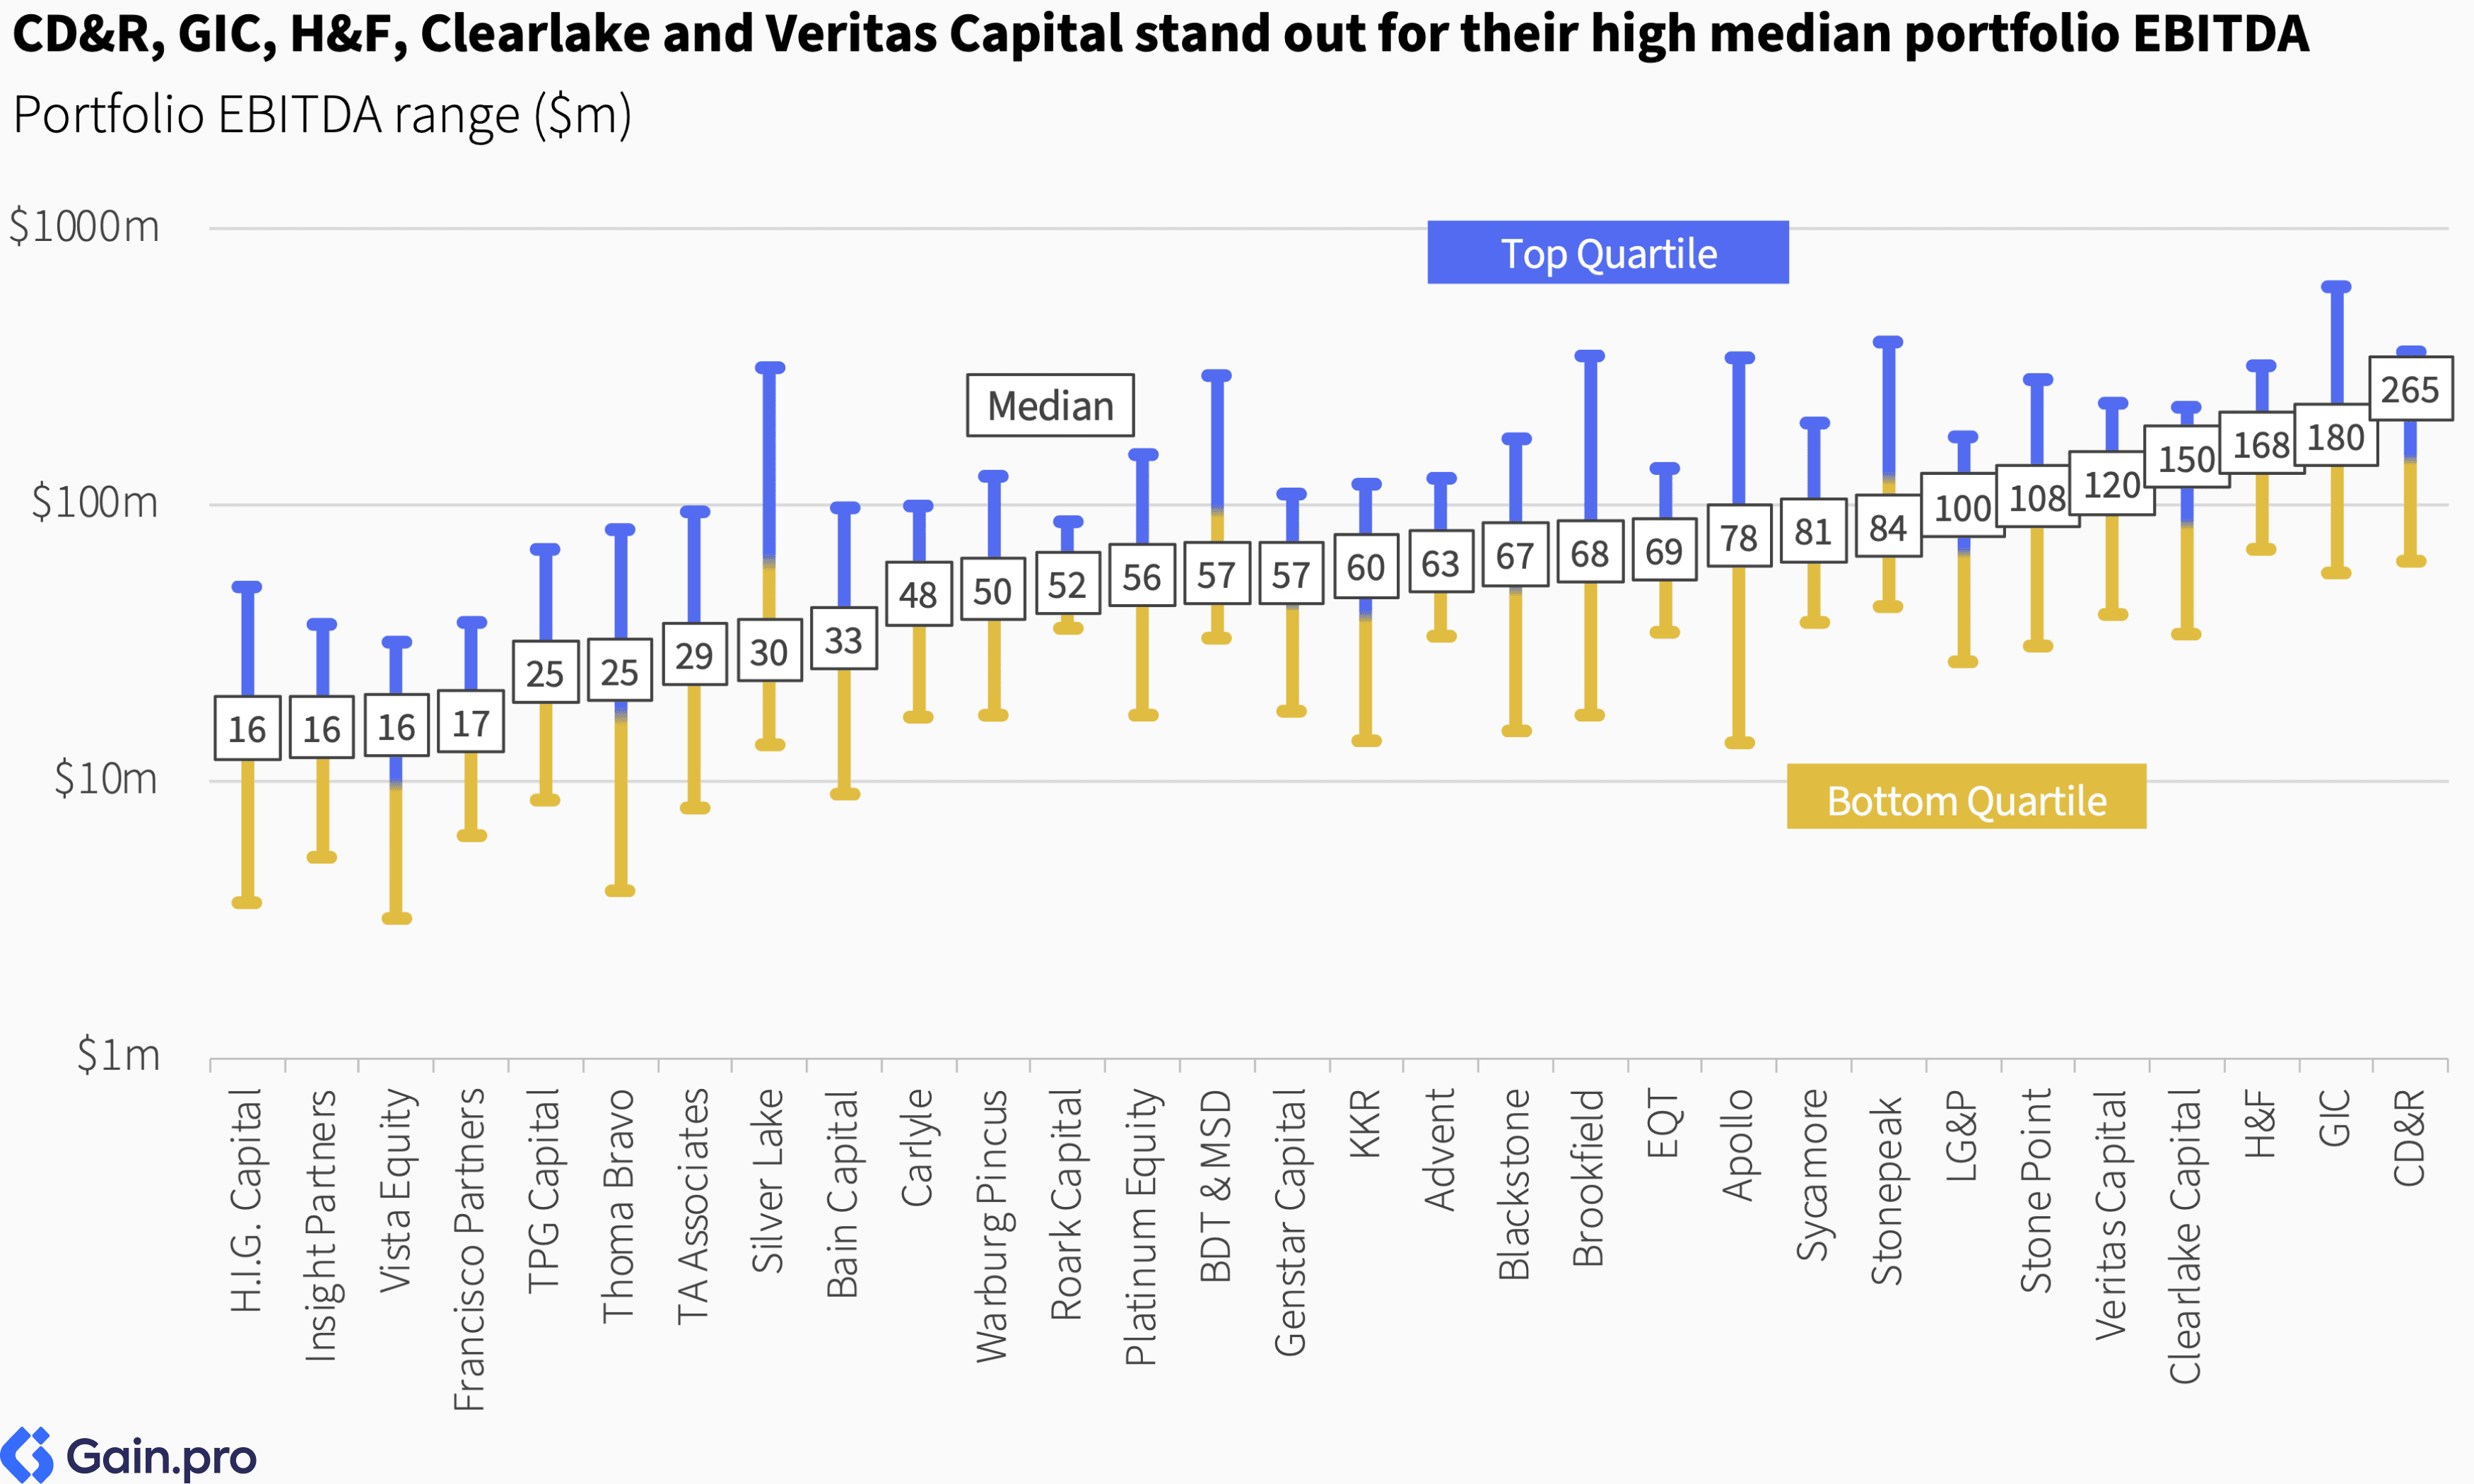
Clayton, Dubilier & Rice (CD&R), GIC, Hellman & Friedman (H&F), Clearlake Capital, and Veritas Capital stand out for their exceptionally high median portfolio EBITDA figures. CD&R, H&F, and Veritas Capital do larger but fewer majority deals. GIC, meanwhile, takes mostly minority stakes in large assets.
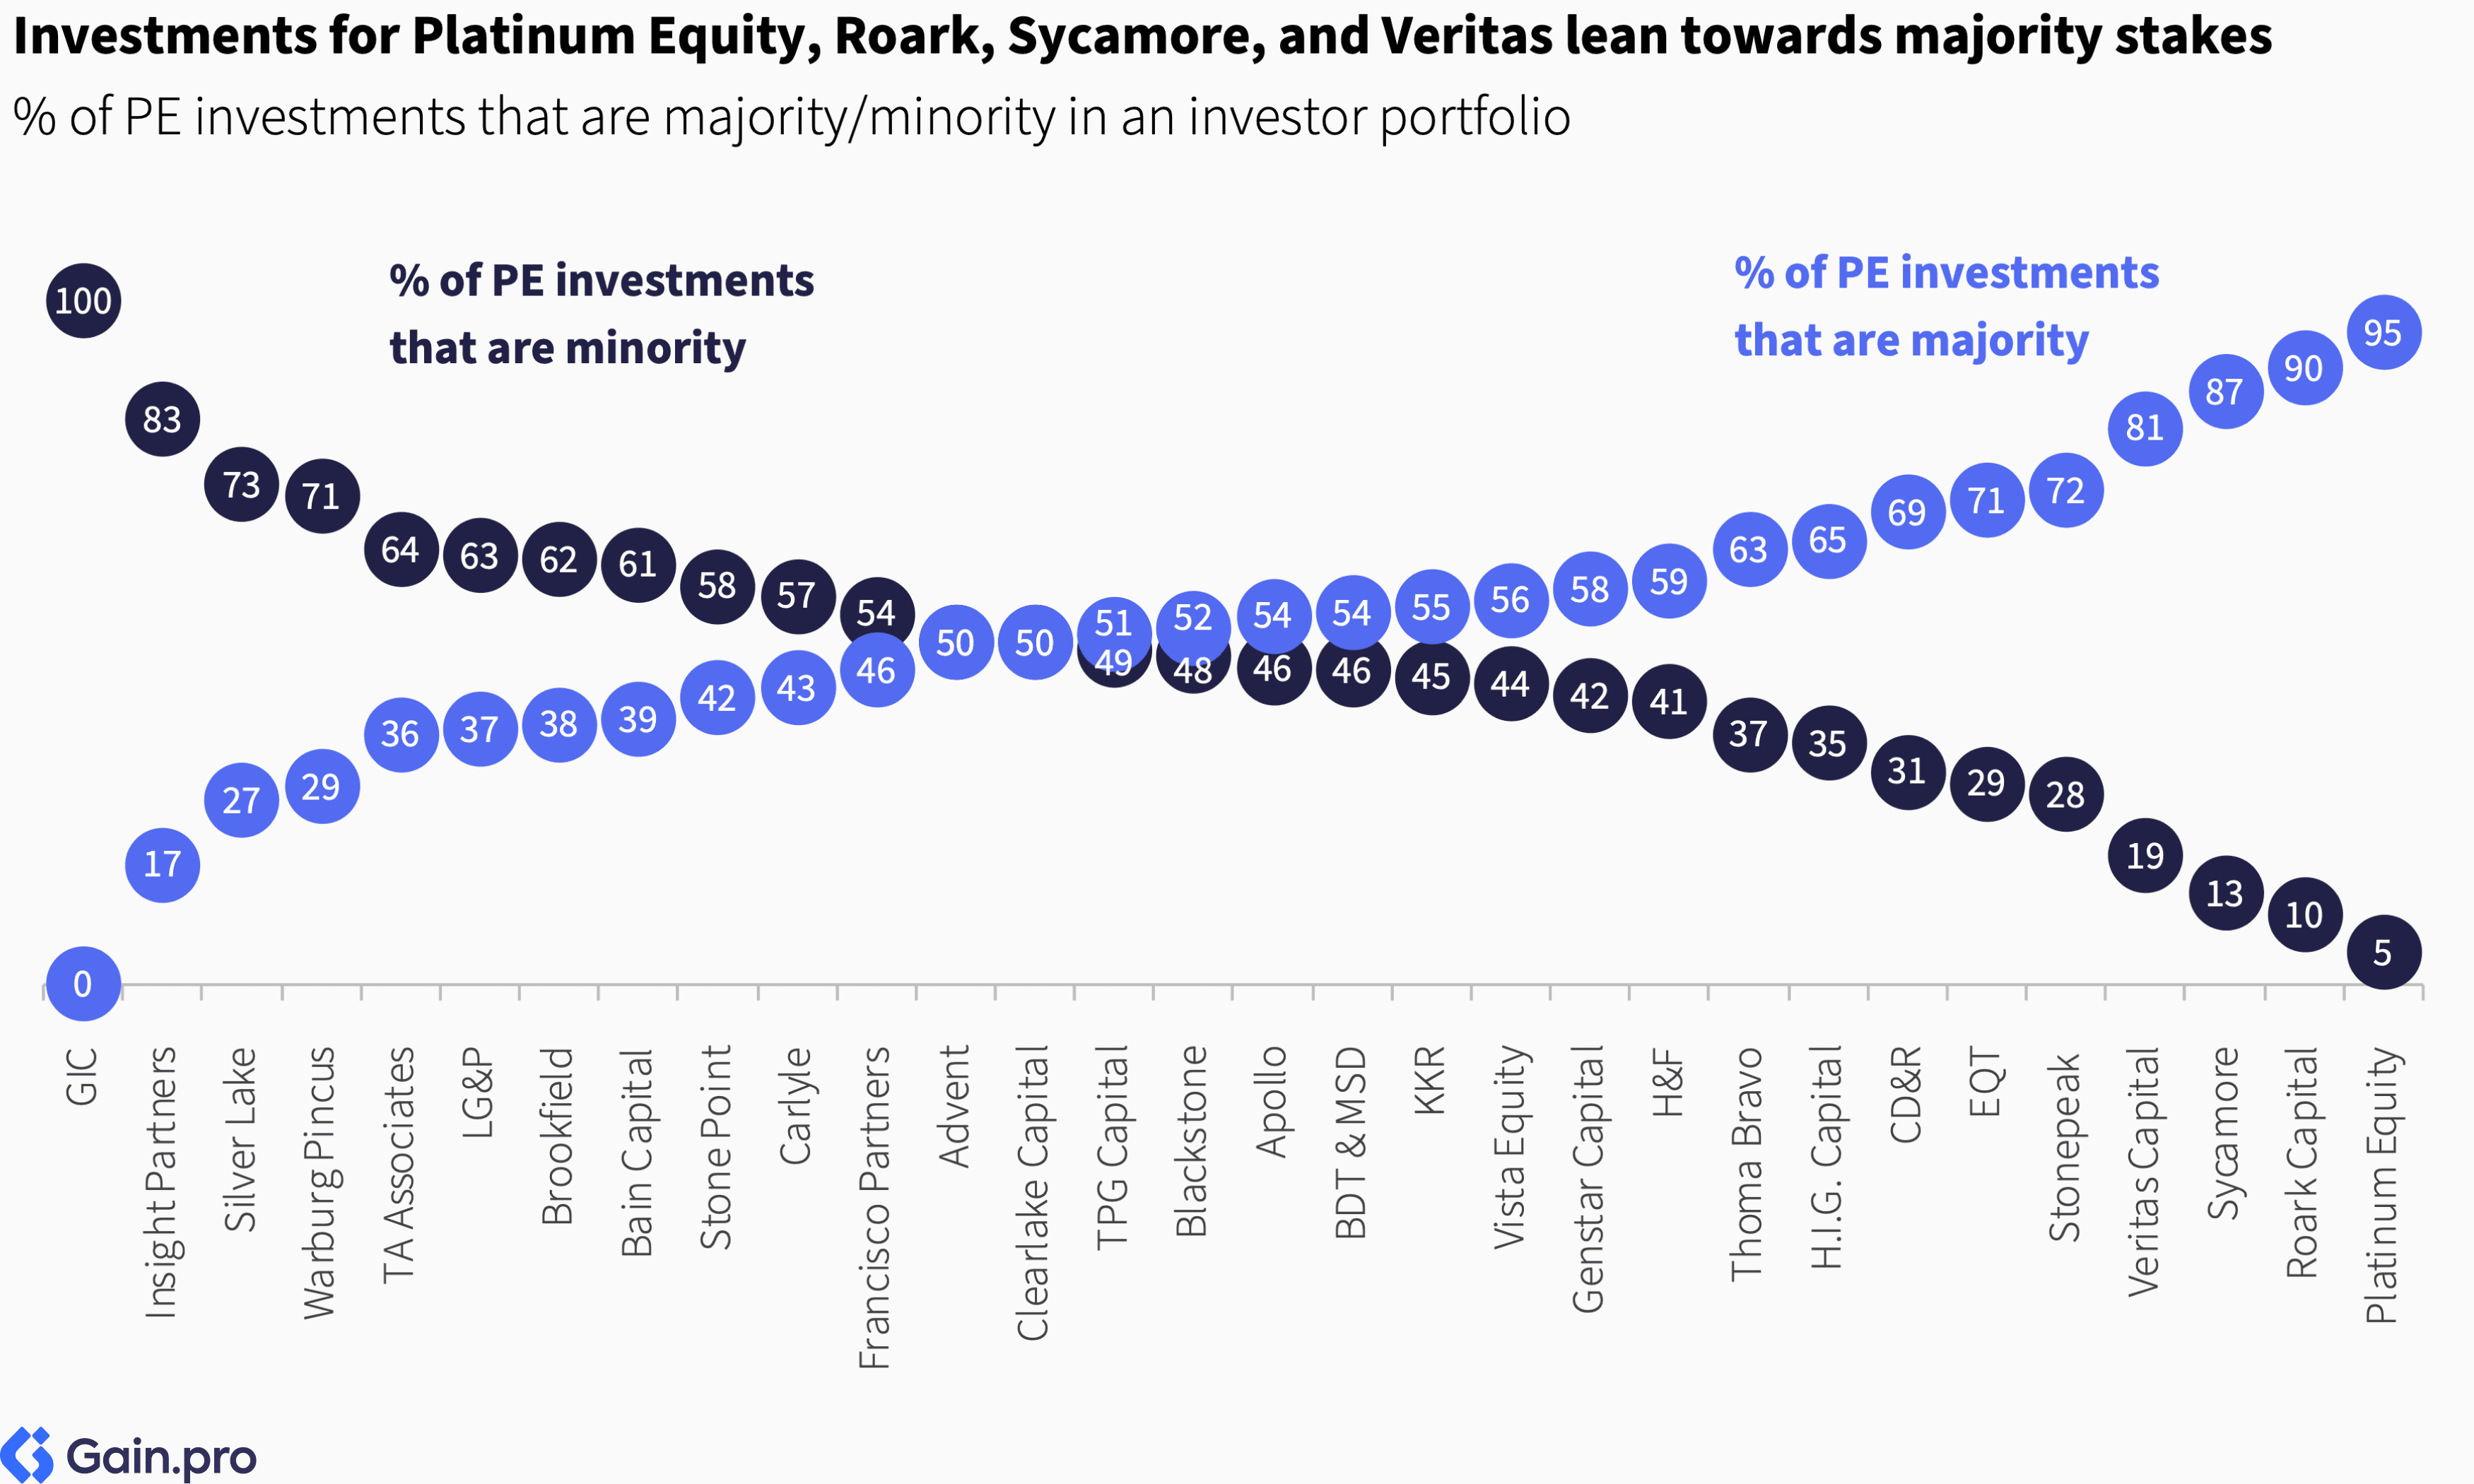
The preference for majority versus minority stakes differs among the top investors. Investments for GIC, Insight Partners, Silver Lake, and Warburg Pincus lean towards minority stakes, whereas Platinum Equity, Roark Capital, Sycamore and Veritas Capital typically default to majority deals.
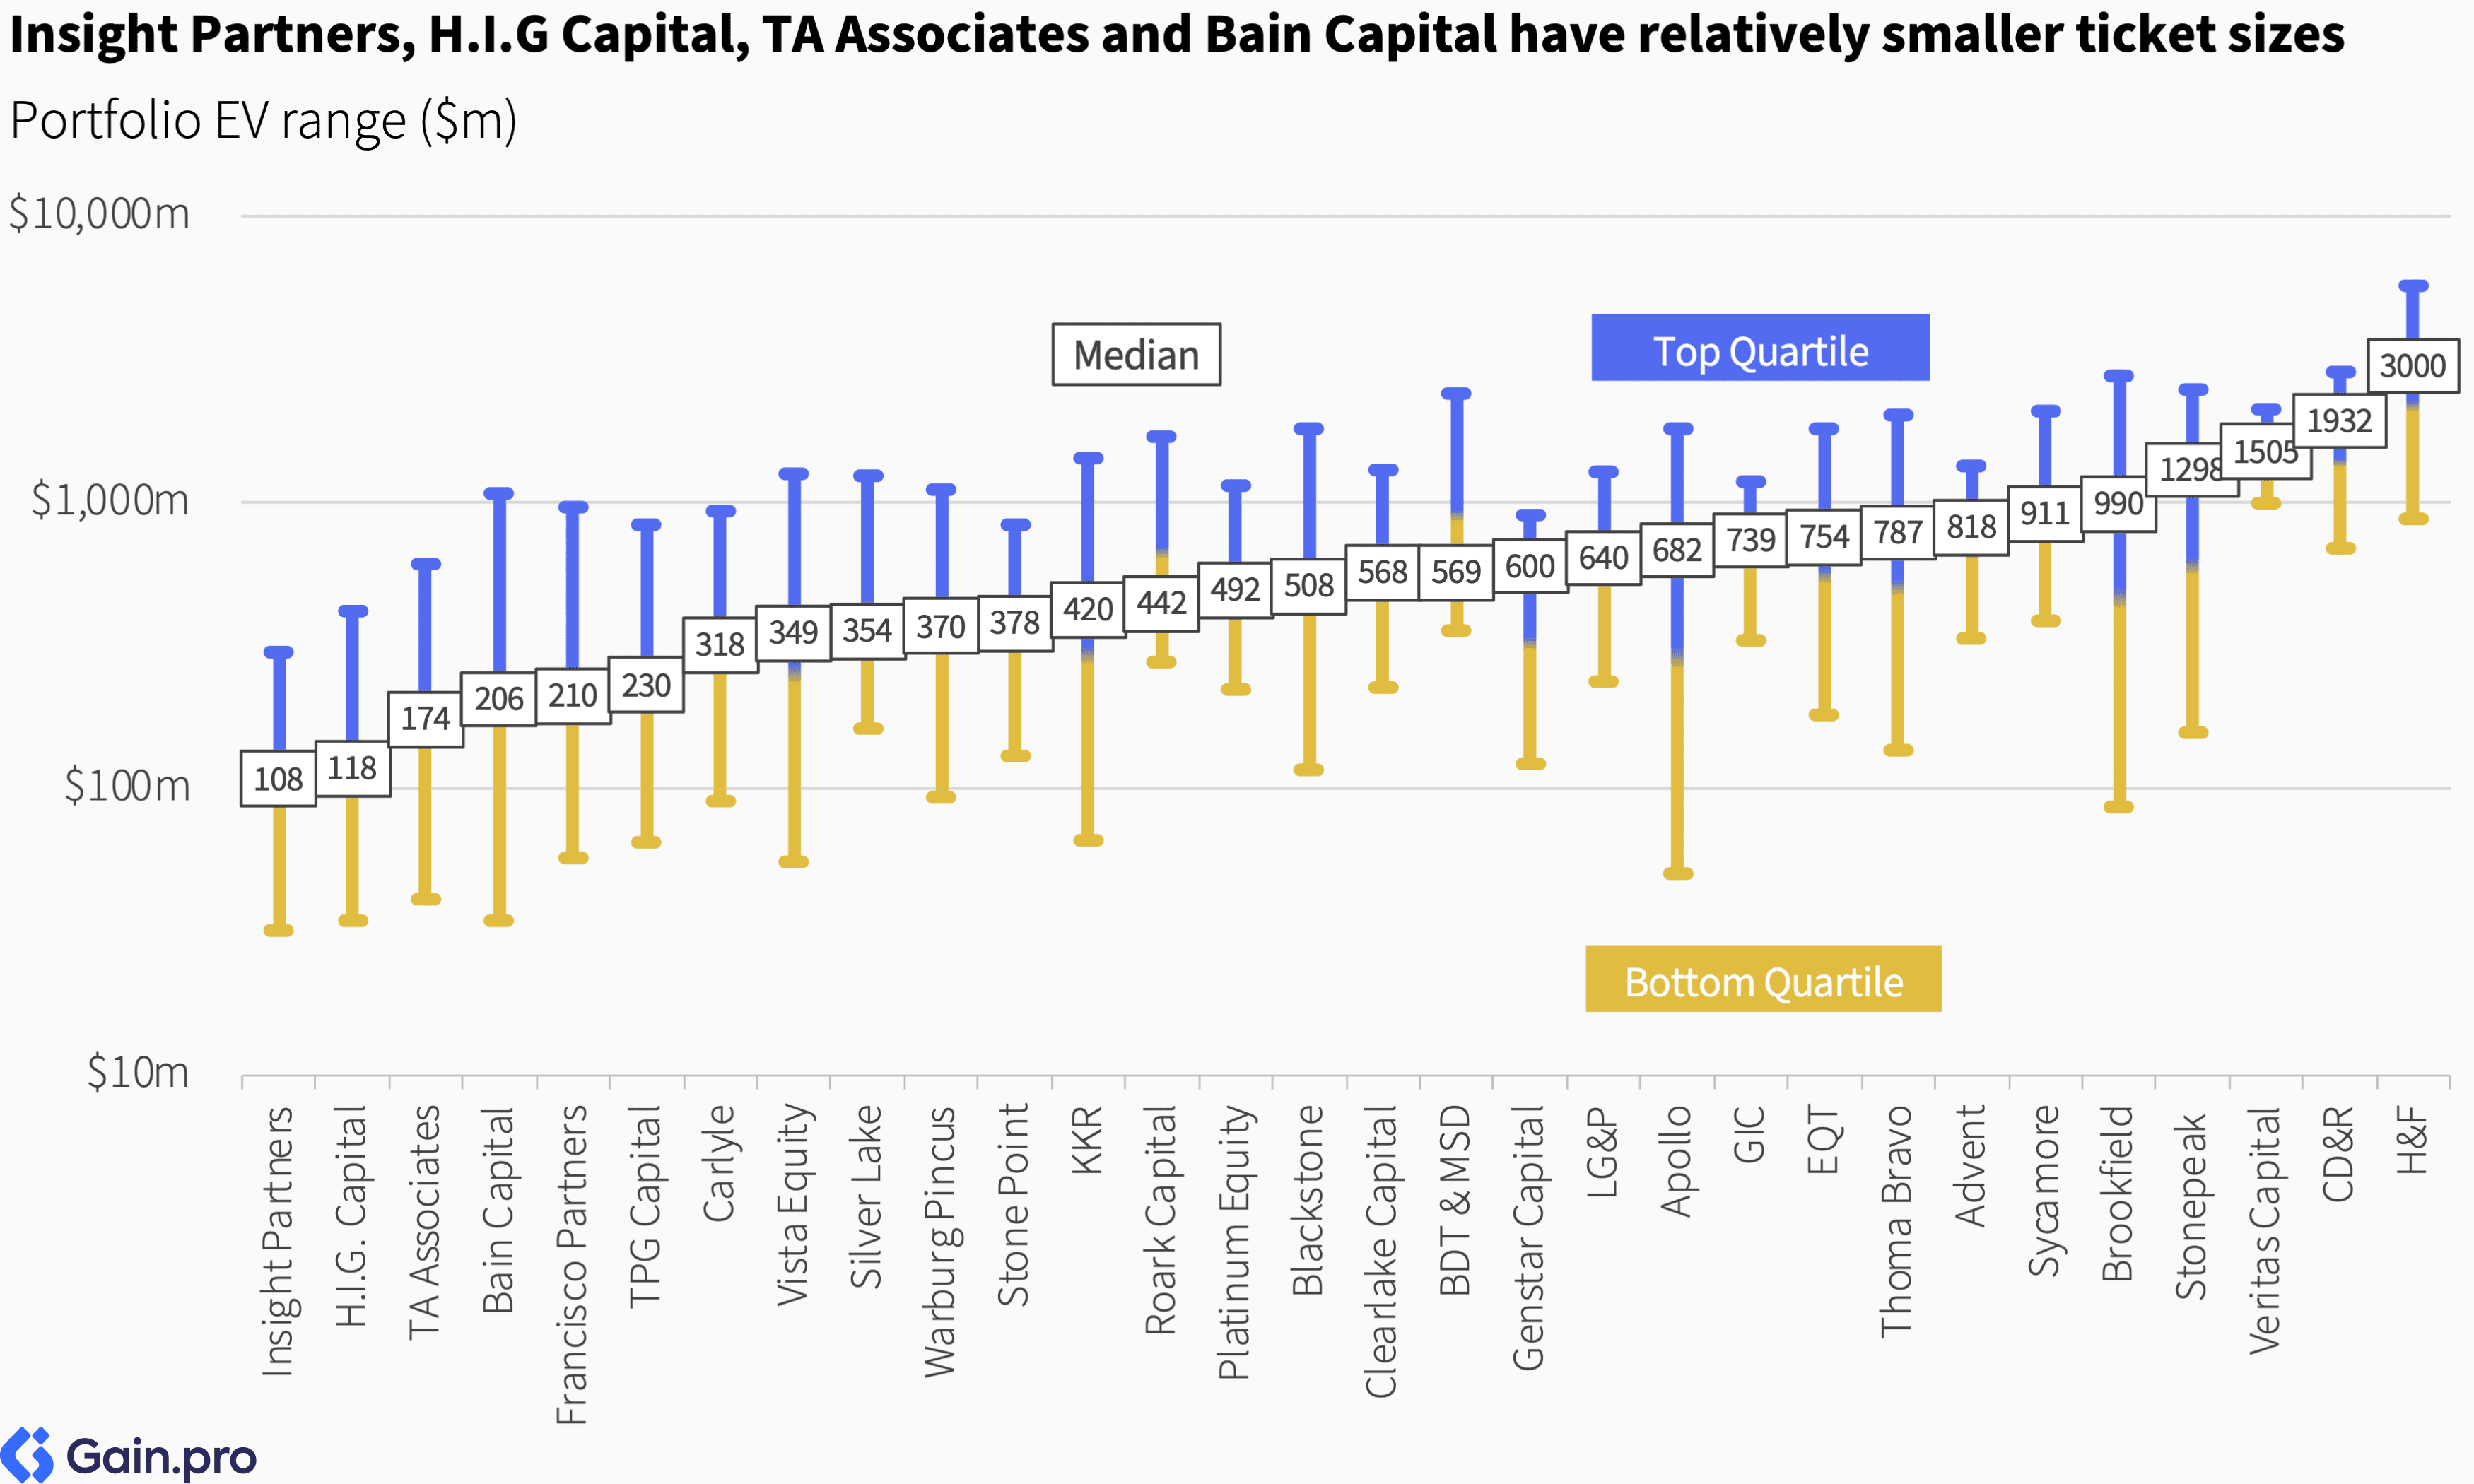
Insight Partners, H.I.G. Capital, TA Associates, Bain Capital, and Francisco Partners have relatively smaller ticket sizes. They all (except H.I.G. Capital) focus more on the TMT sector and have a relatively higher share of minority investments. H.I.G. Capital, on the other hand, is primarily focused on the mid-market. In contrast, H&F, CD&R, and Veritas Capital take more concentrated positions, deploying substantial capital in large investments.
By Entry Type
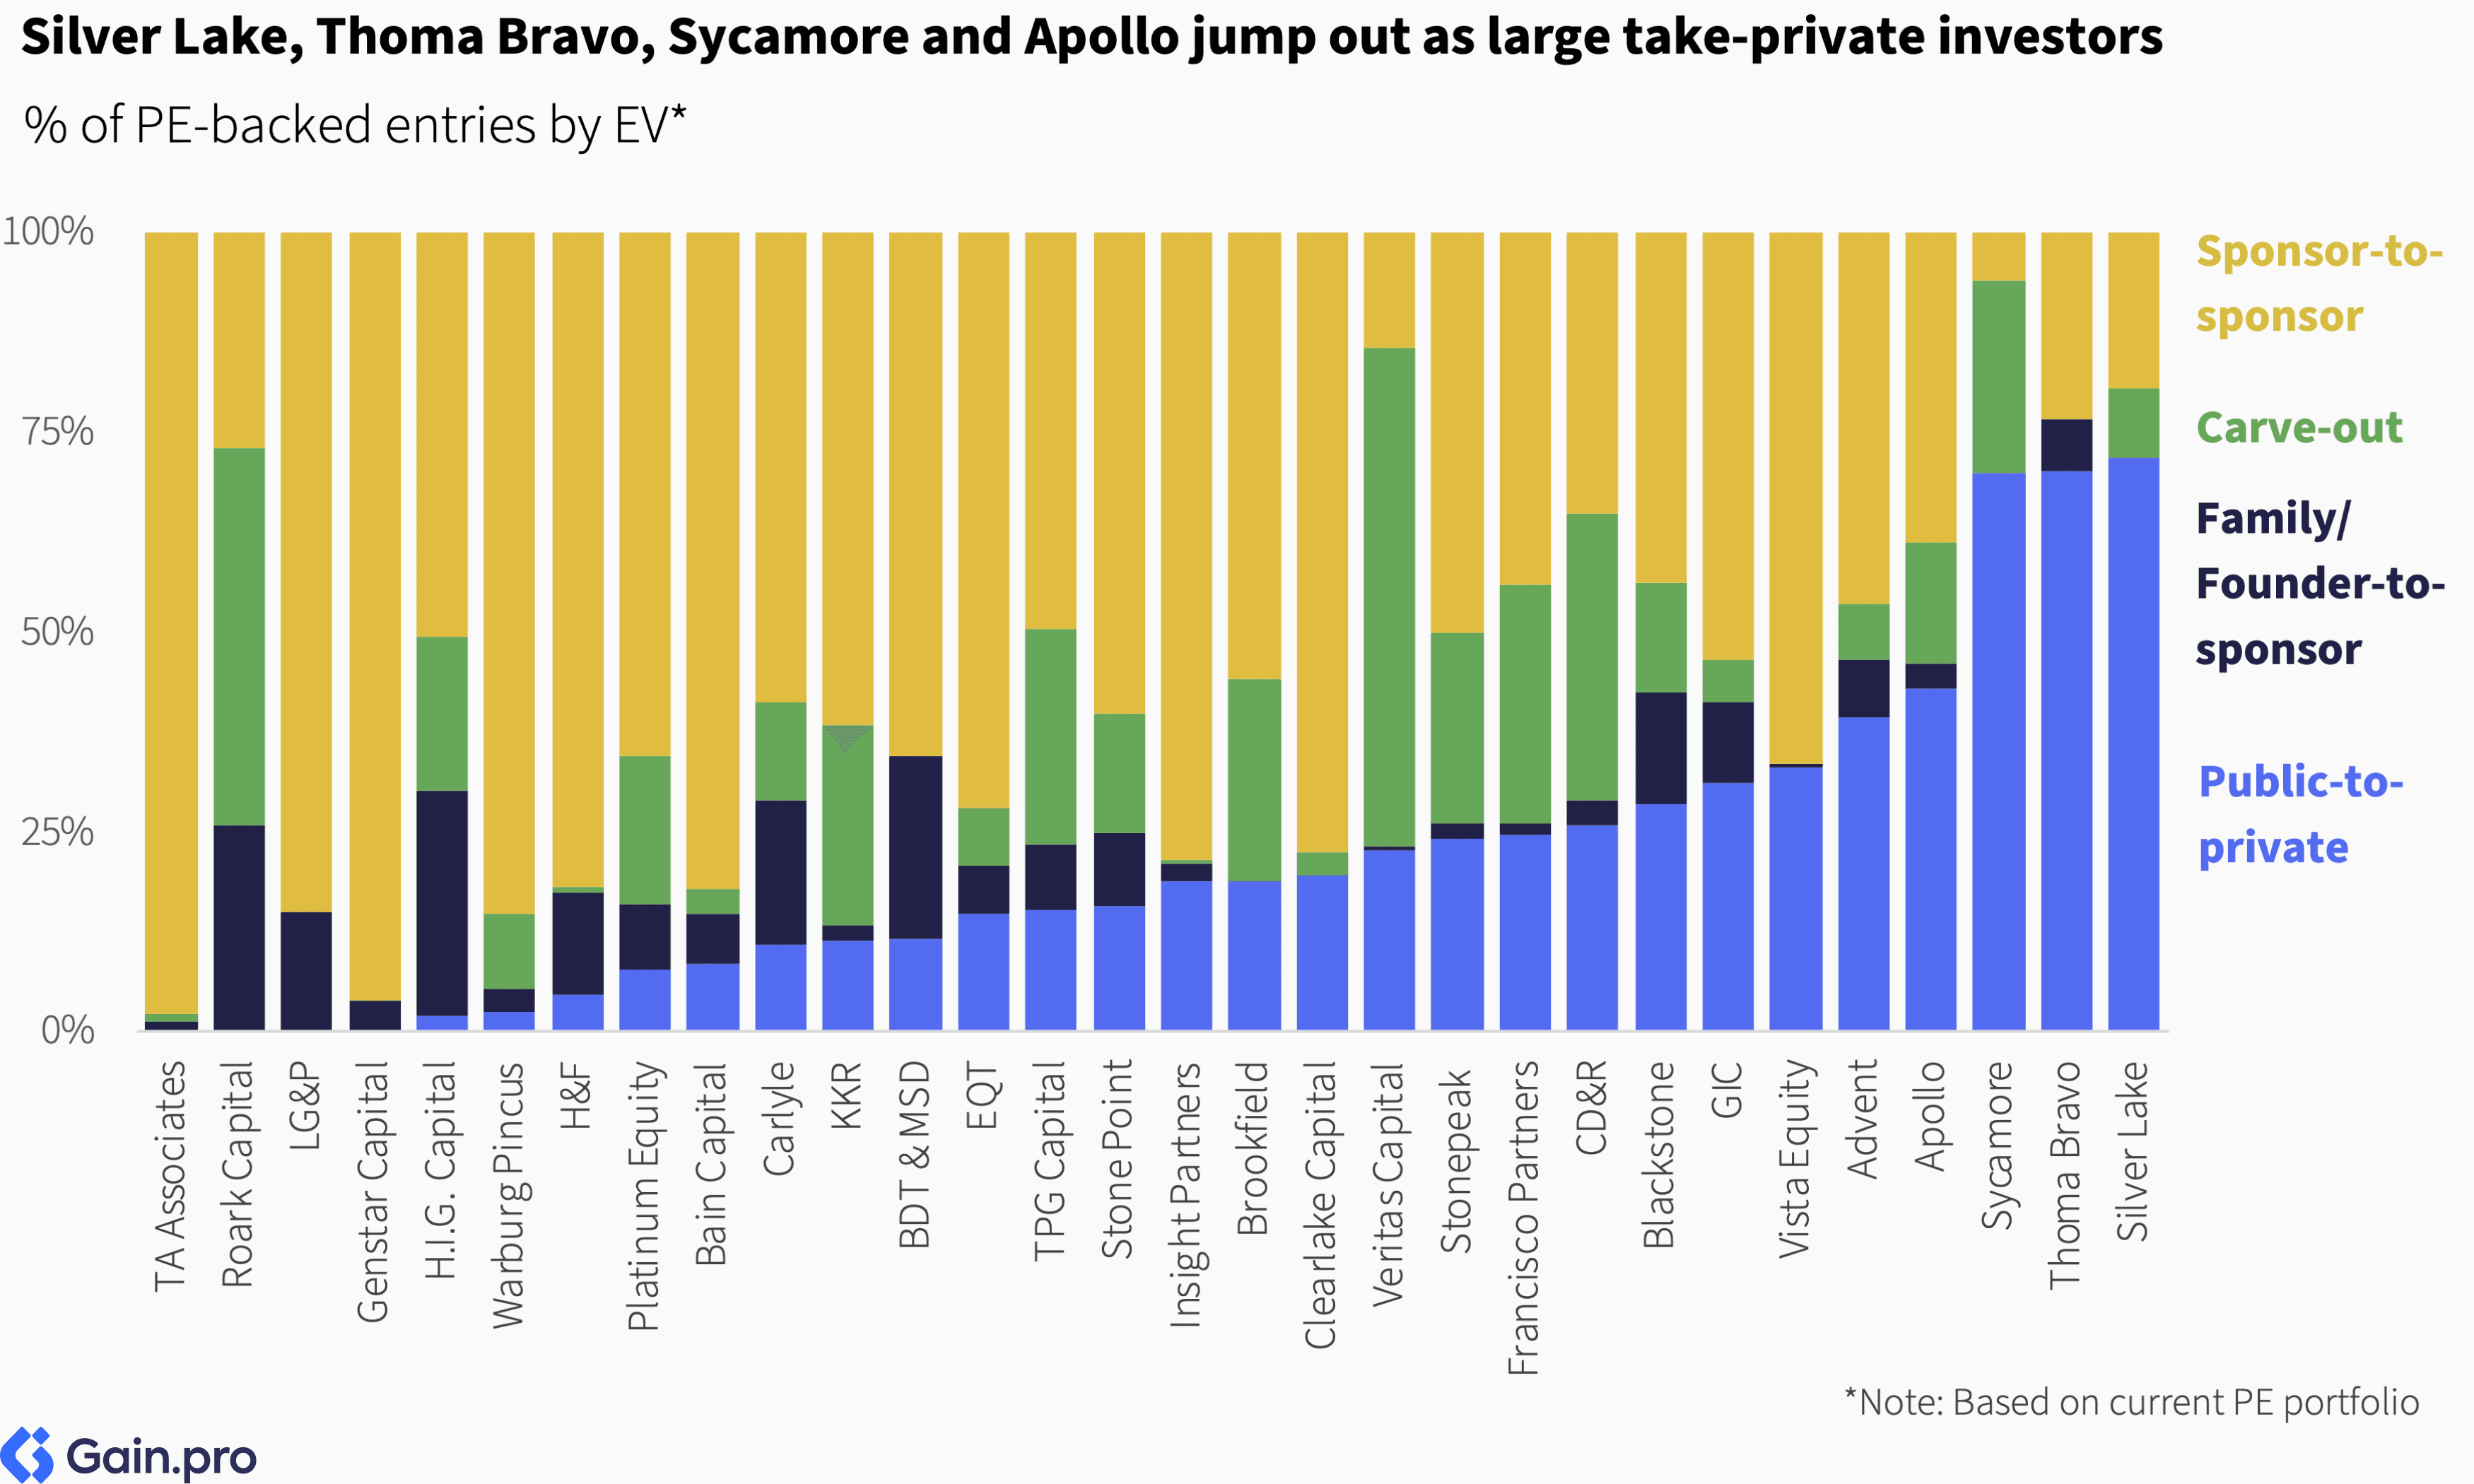
Silver Lake, Thoma Bravo, Sycamore, and Apollo jump out as large take-private investors, while Roark Capital and Veritas Capital stand out for their focus on carve-outs. Broadly though, sponsor-to-sponsor remains the most popular entry type, with only a few investors getting meaningful dealflow via the family/founder-to-sponsor route.
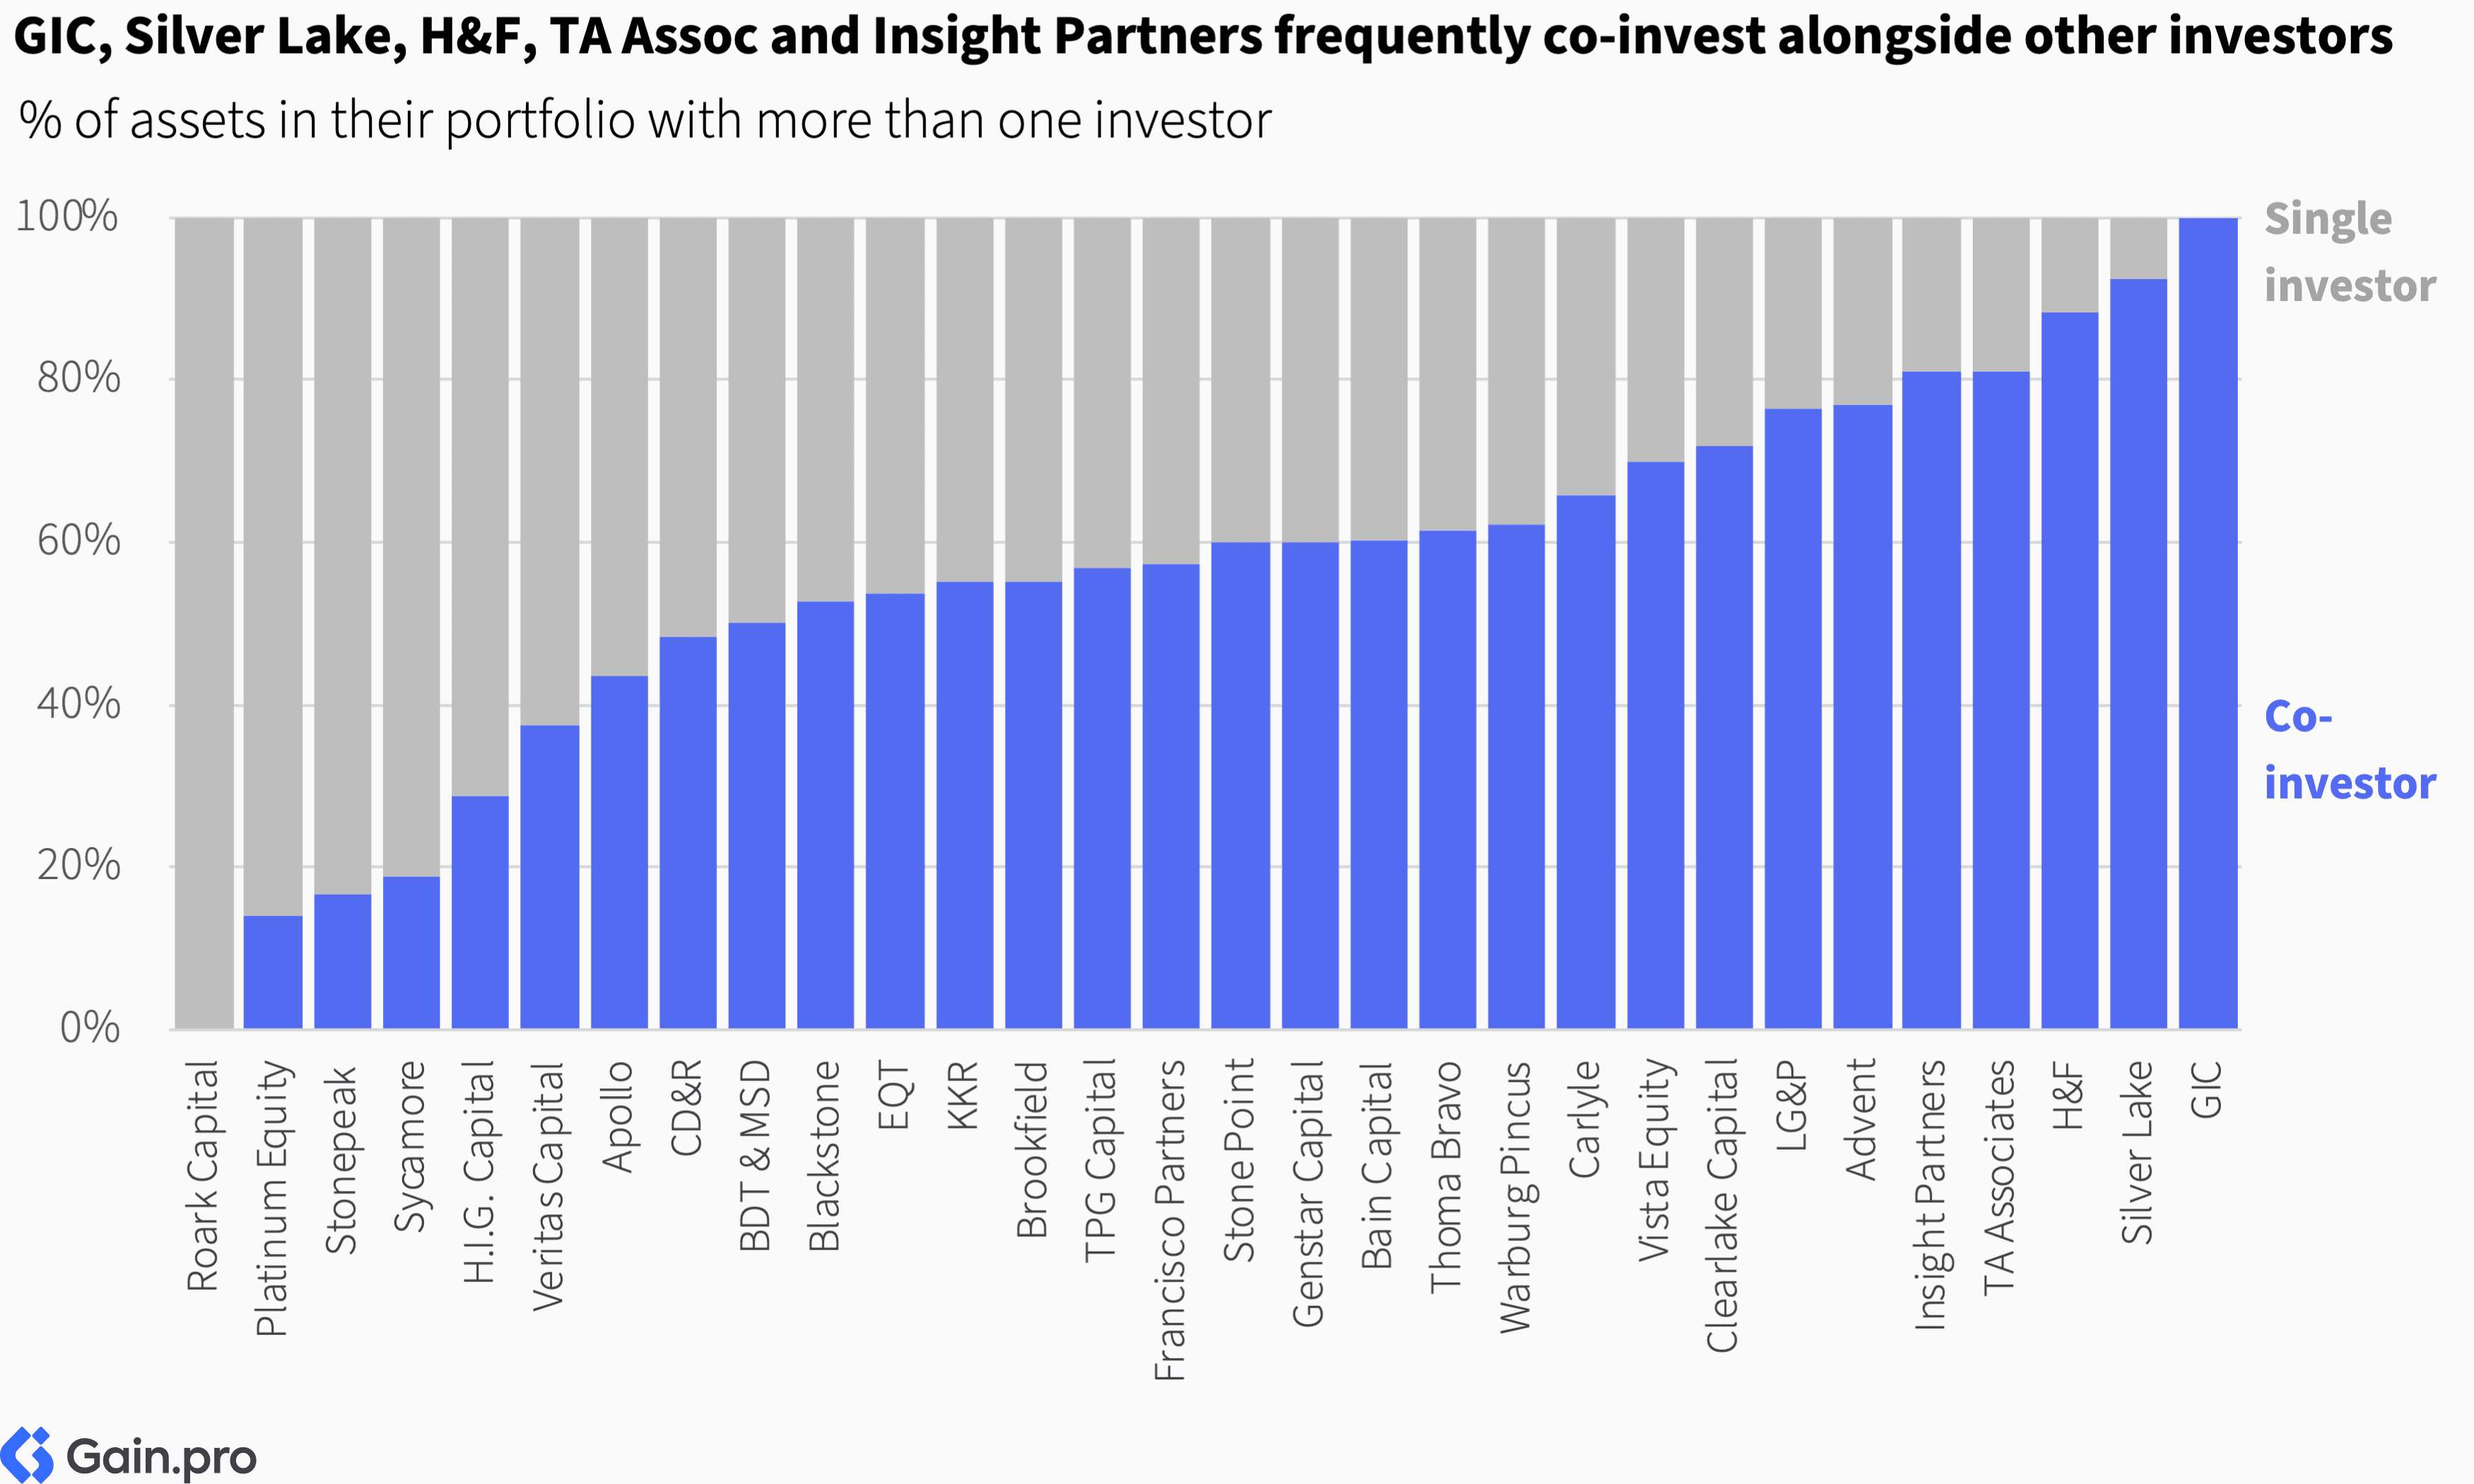
GIC, Silver Lake, H&F, TA Associates, and Insight Partners frequently co-invest alongside other investors, with over 80% of their portfolio investments made in partnership with other investors. Roark Capital, Platinum Equity, and Stonepeak, in contrast, default to an individual ownership.
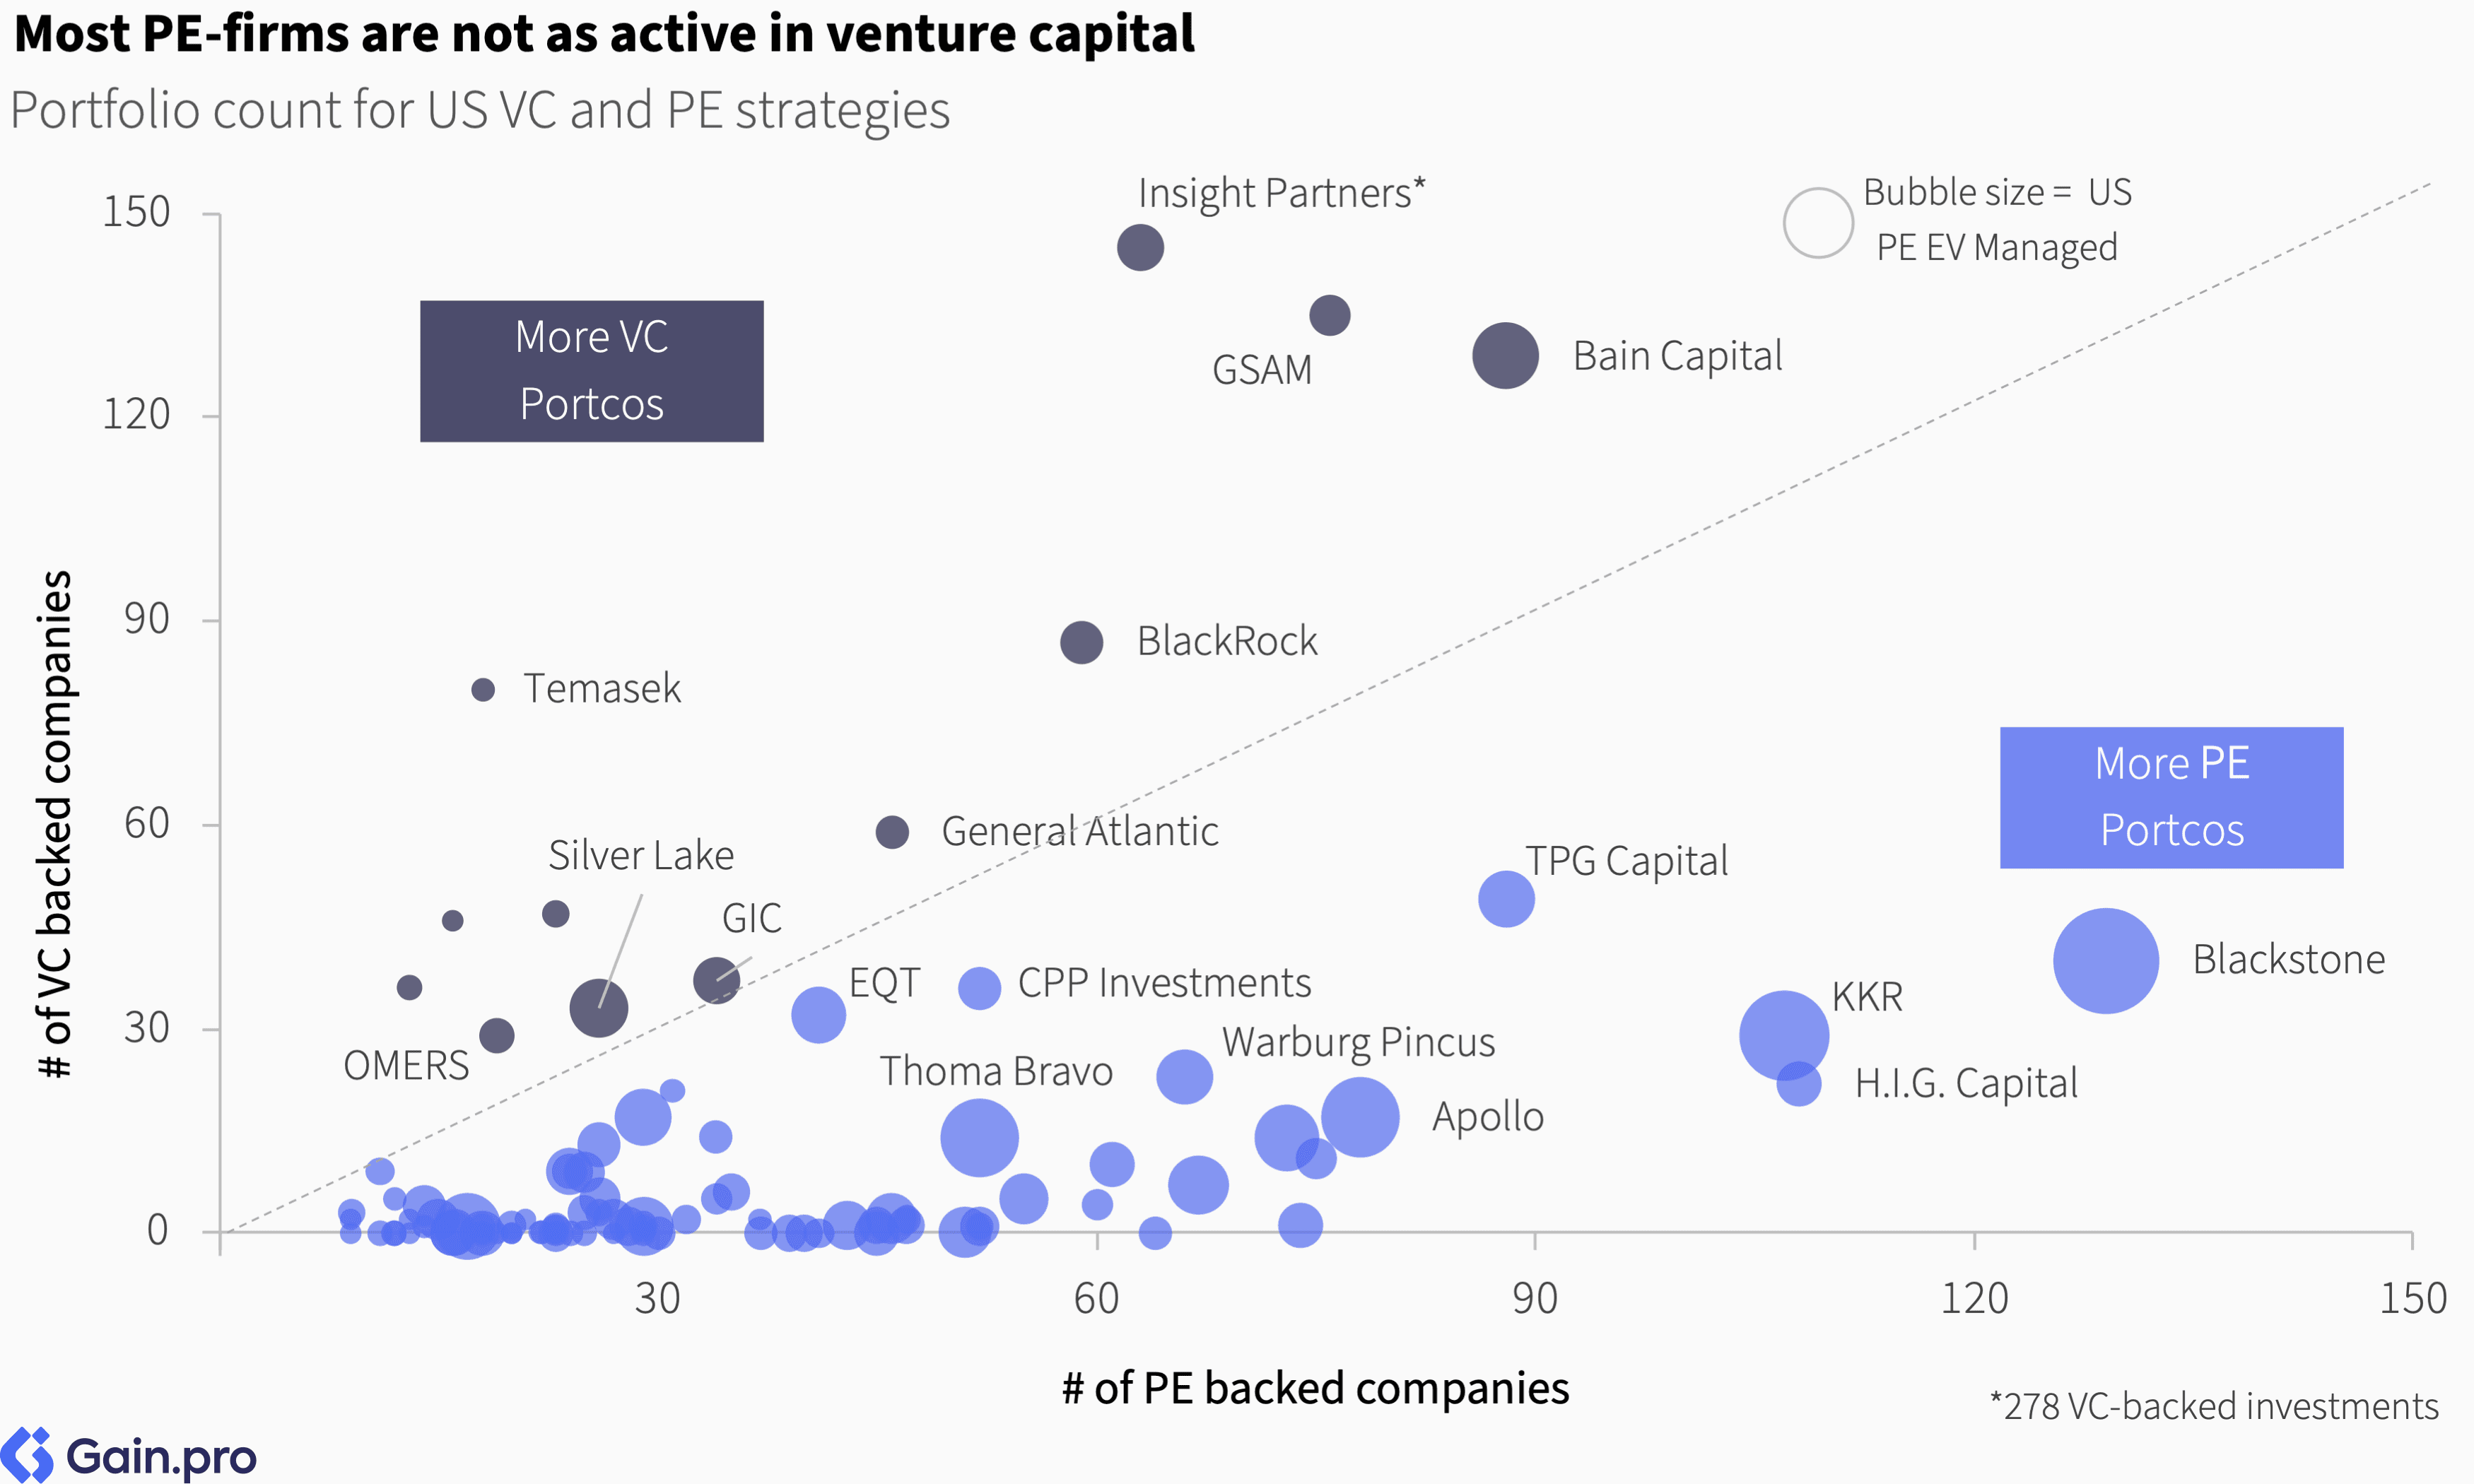
Most PE firms are not as active in Venture Capital. Exceptions include Insight Partners, GSAM, Bain Capital, BlackRock, Temasek, Silver Lake, General Atlantic, and GIC, who hold more investments in their VC strategies than in PE by count.
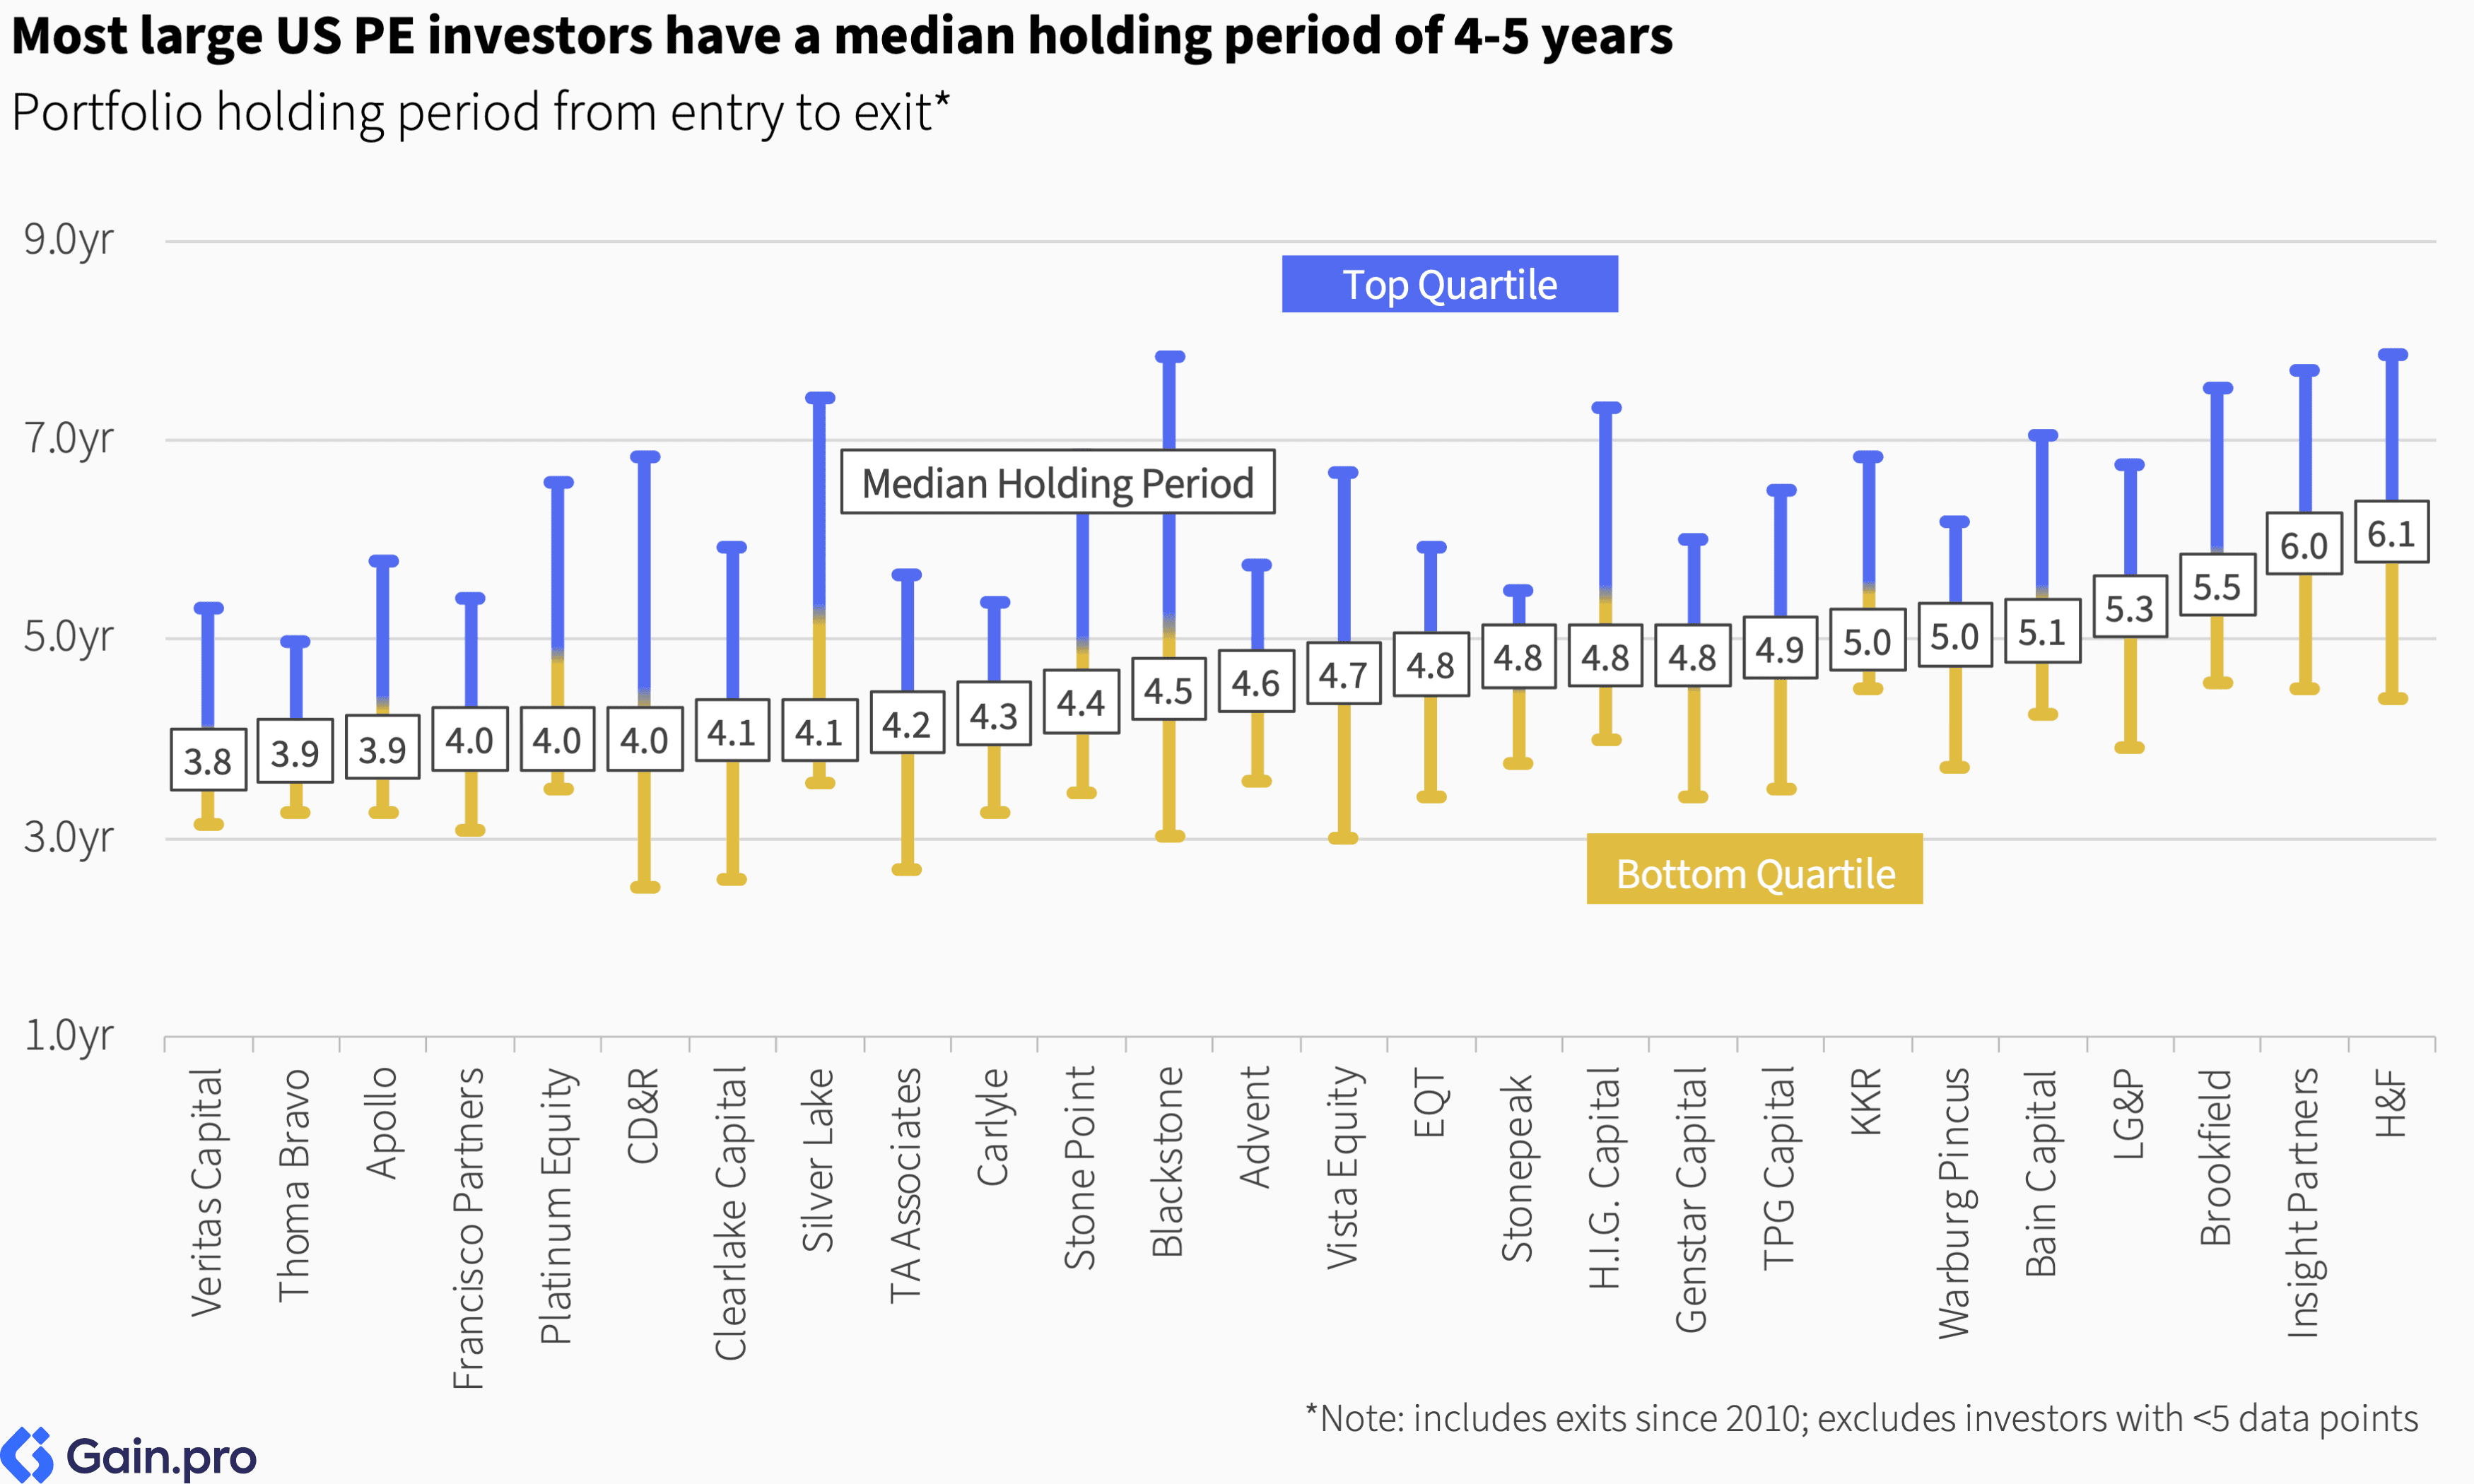
Most large US PE investors hold PE assets for an average of 4-5 years. However, Hellman & Friedman, Insight Partners, and Brookfield hold investments slightly longer, with average holding periods of 5.5-6 years.
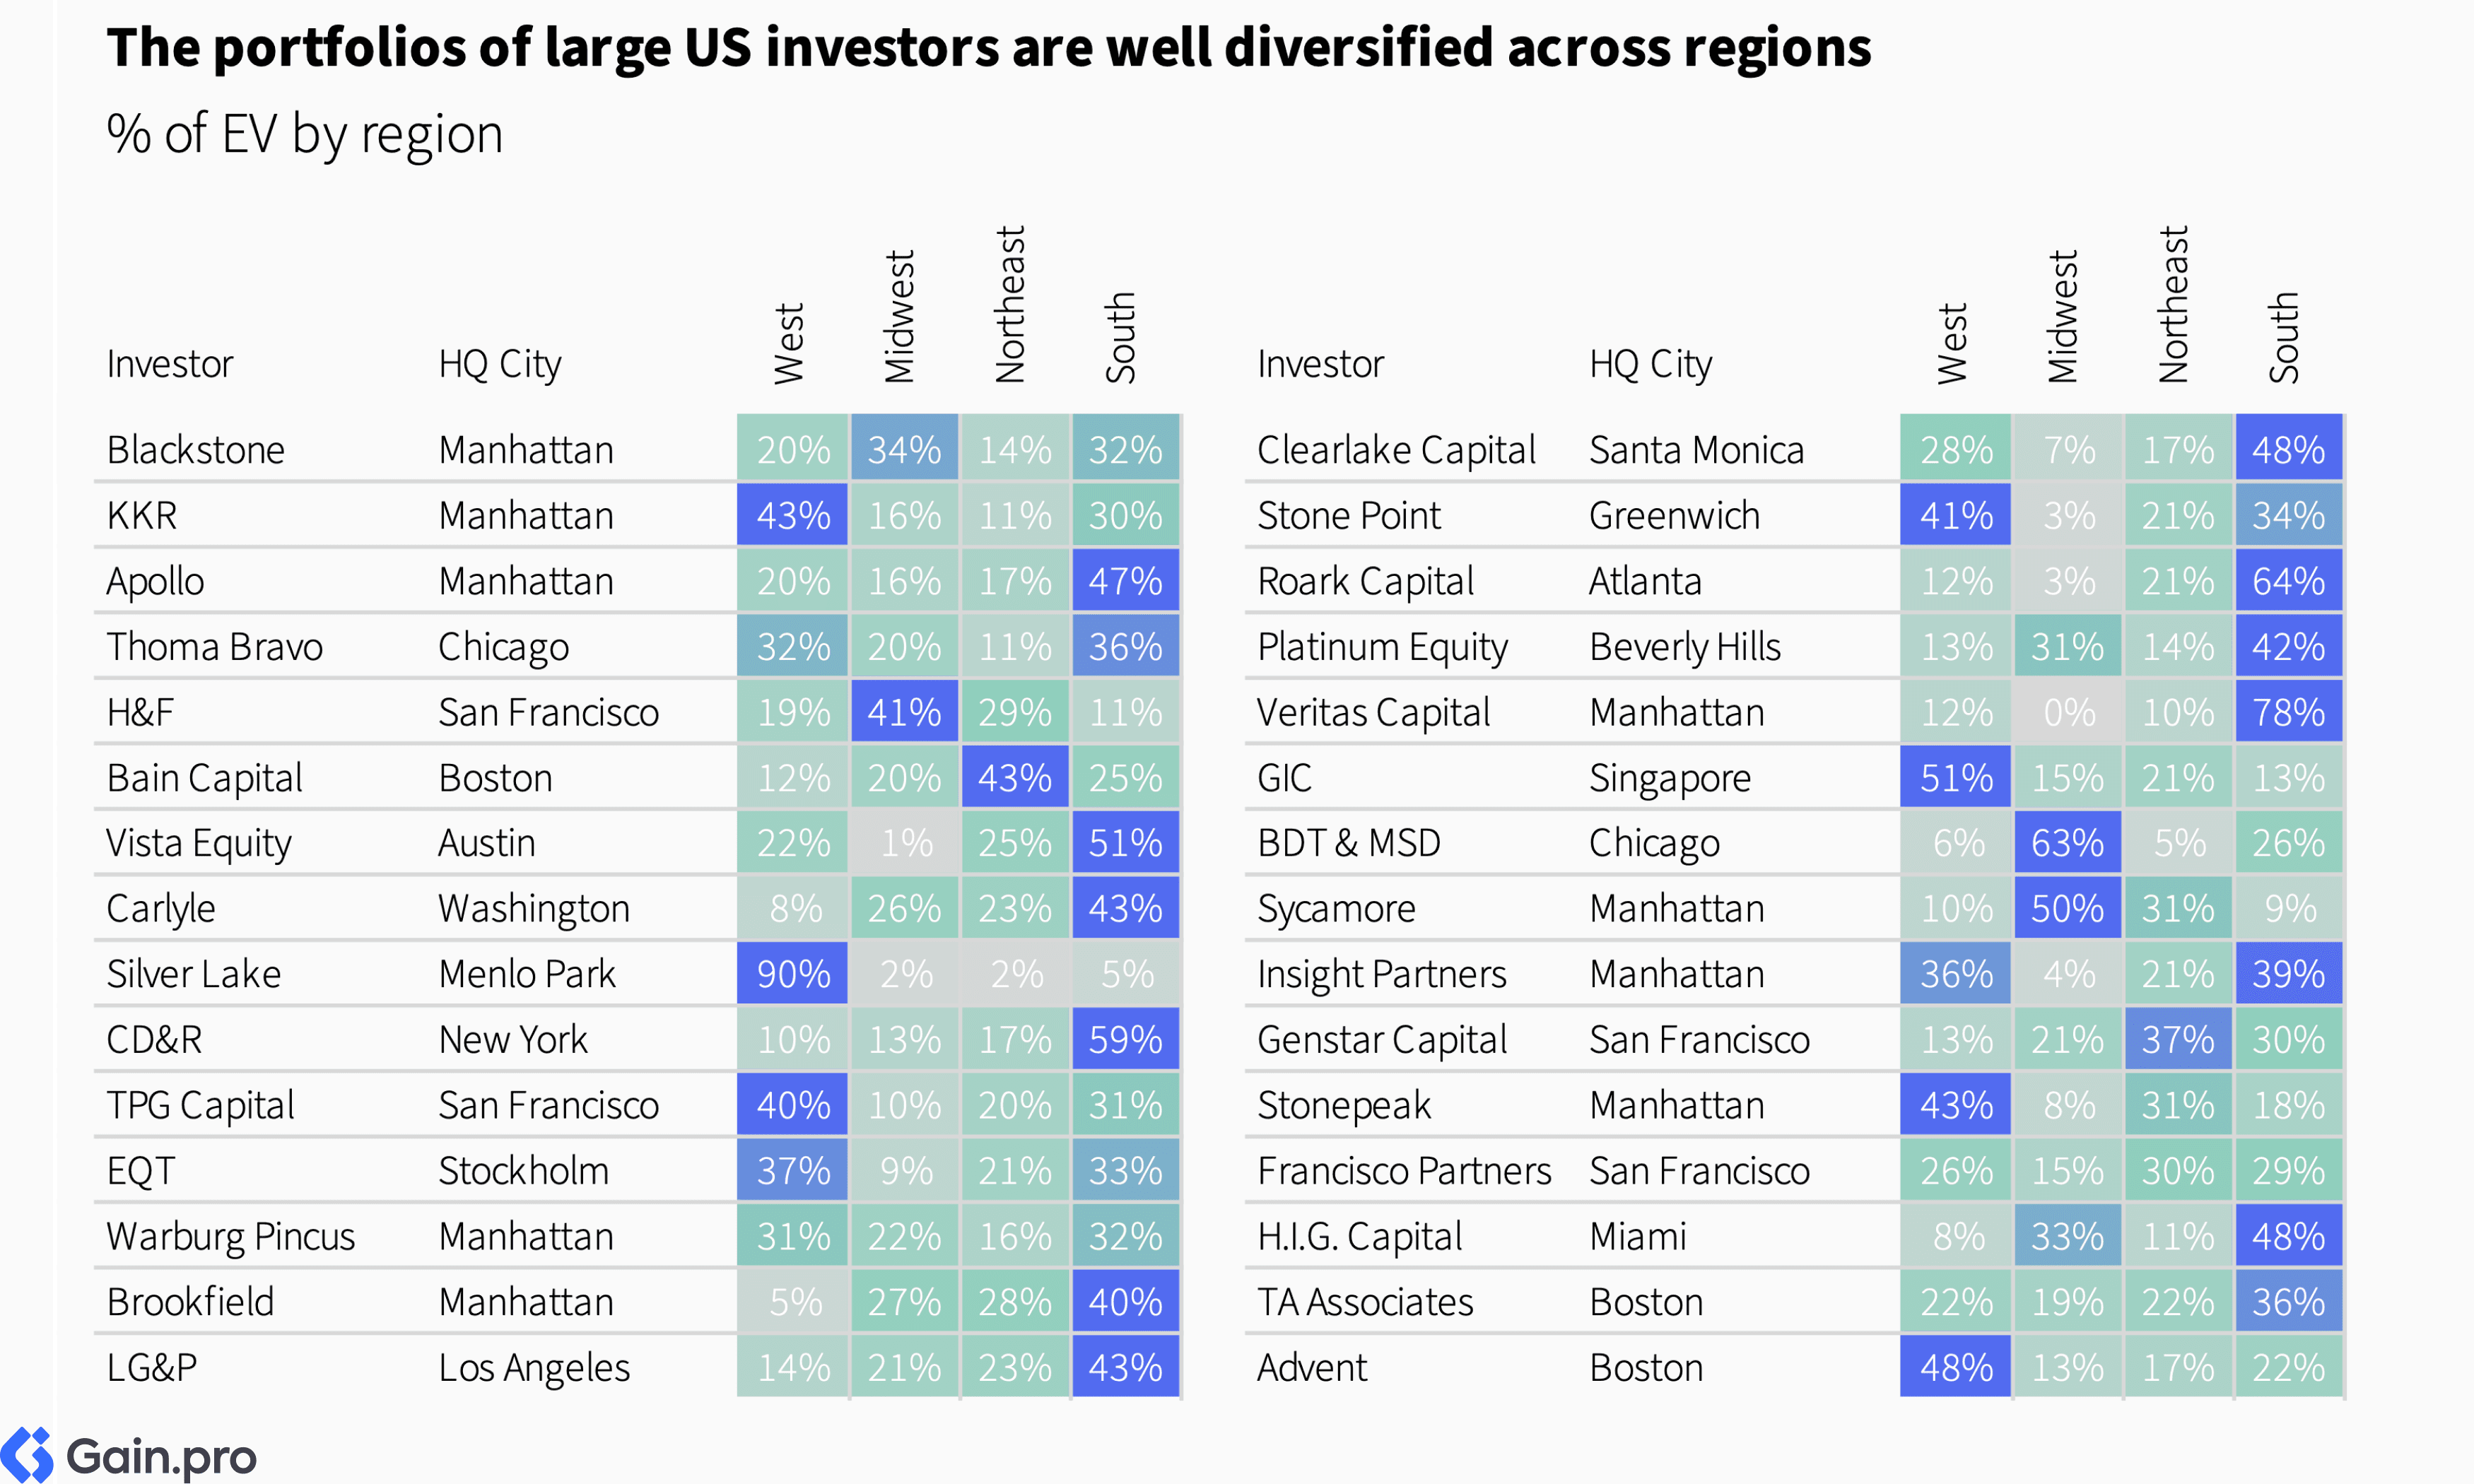
By Sector and Region
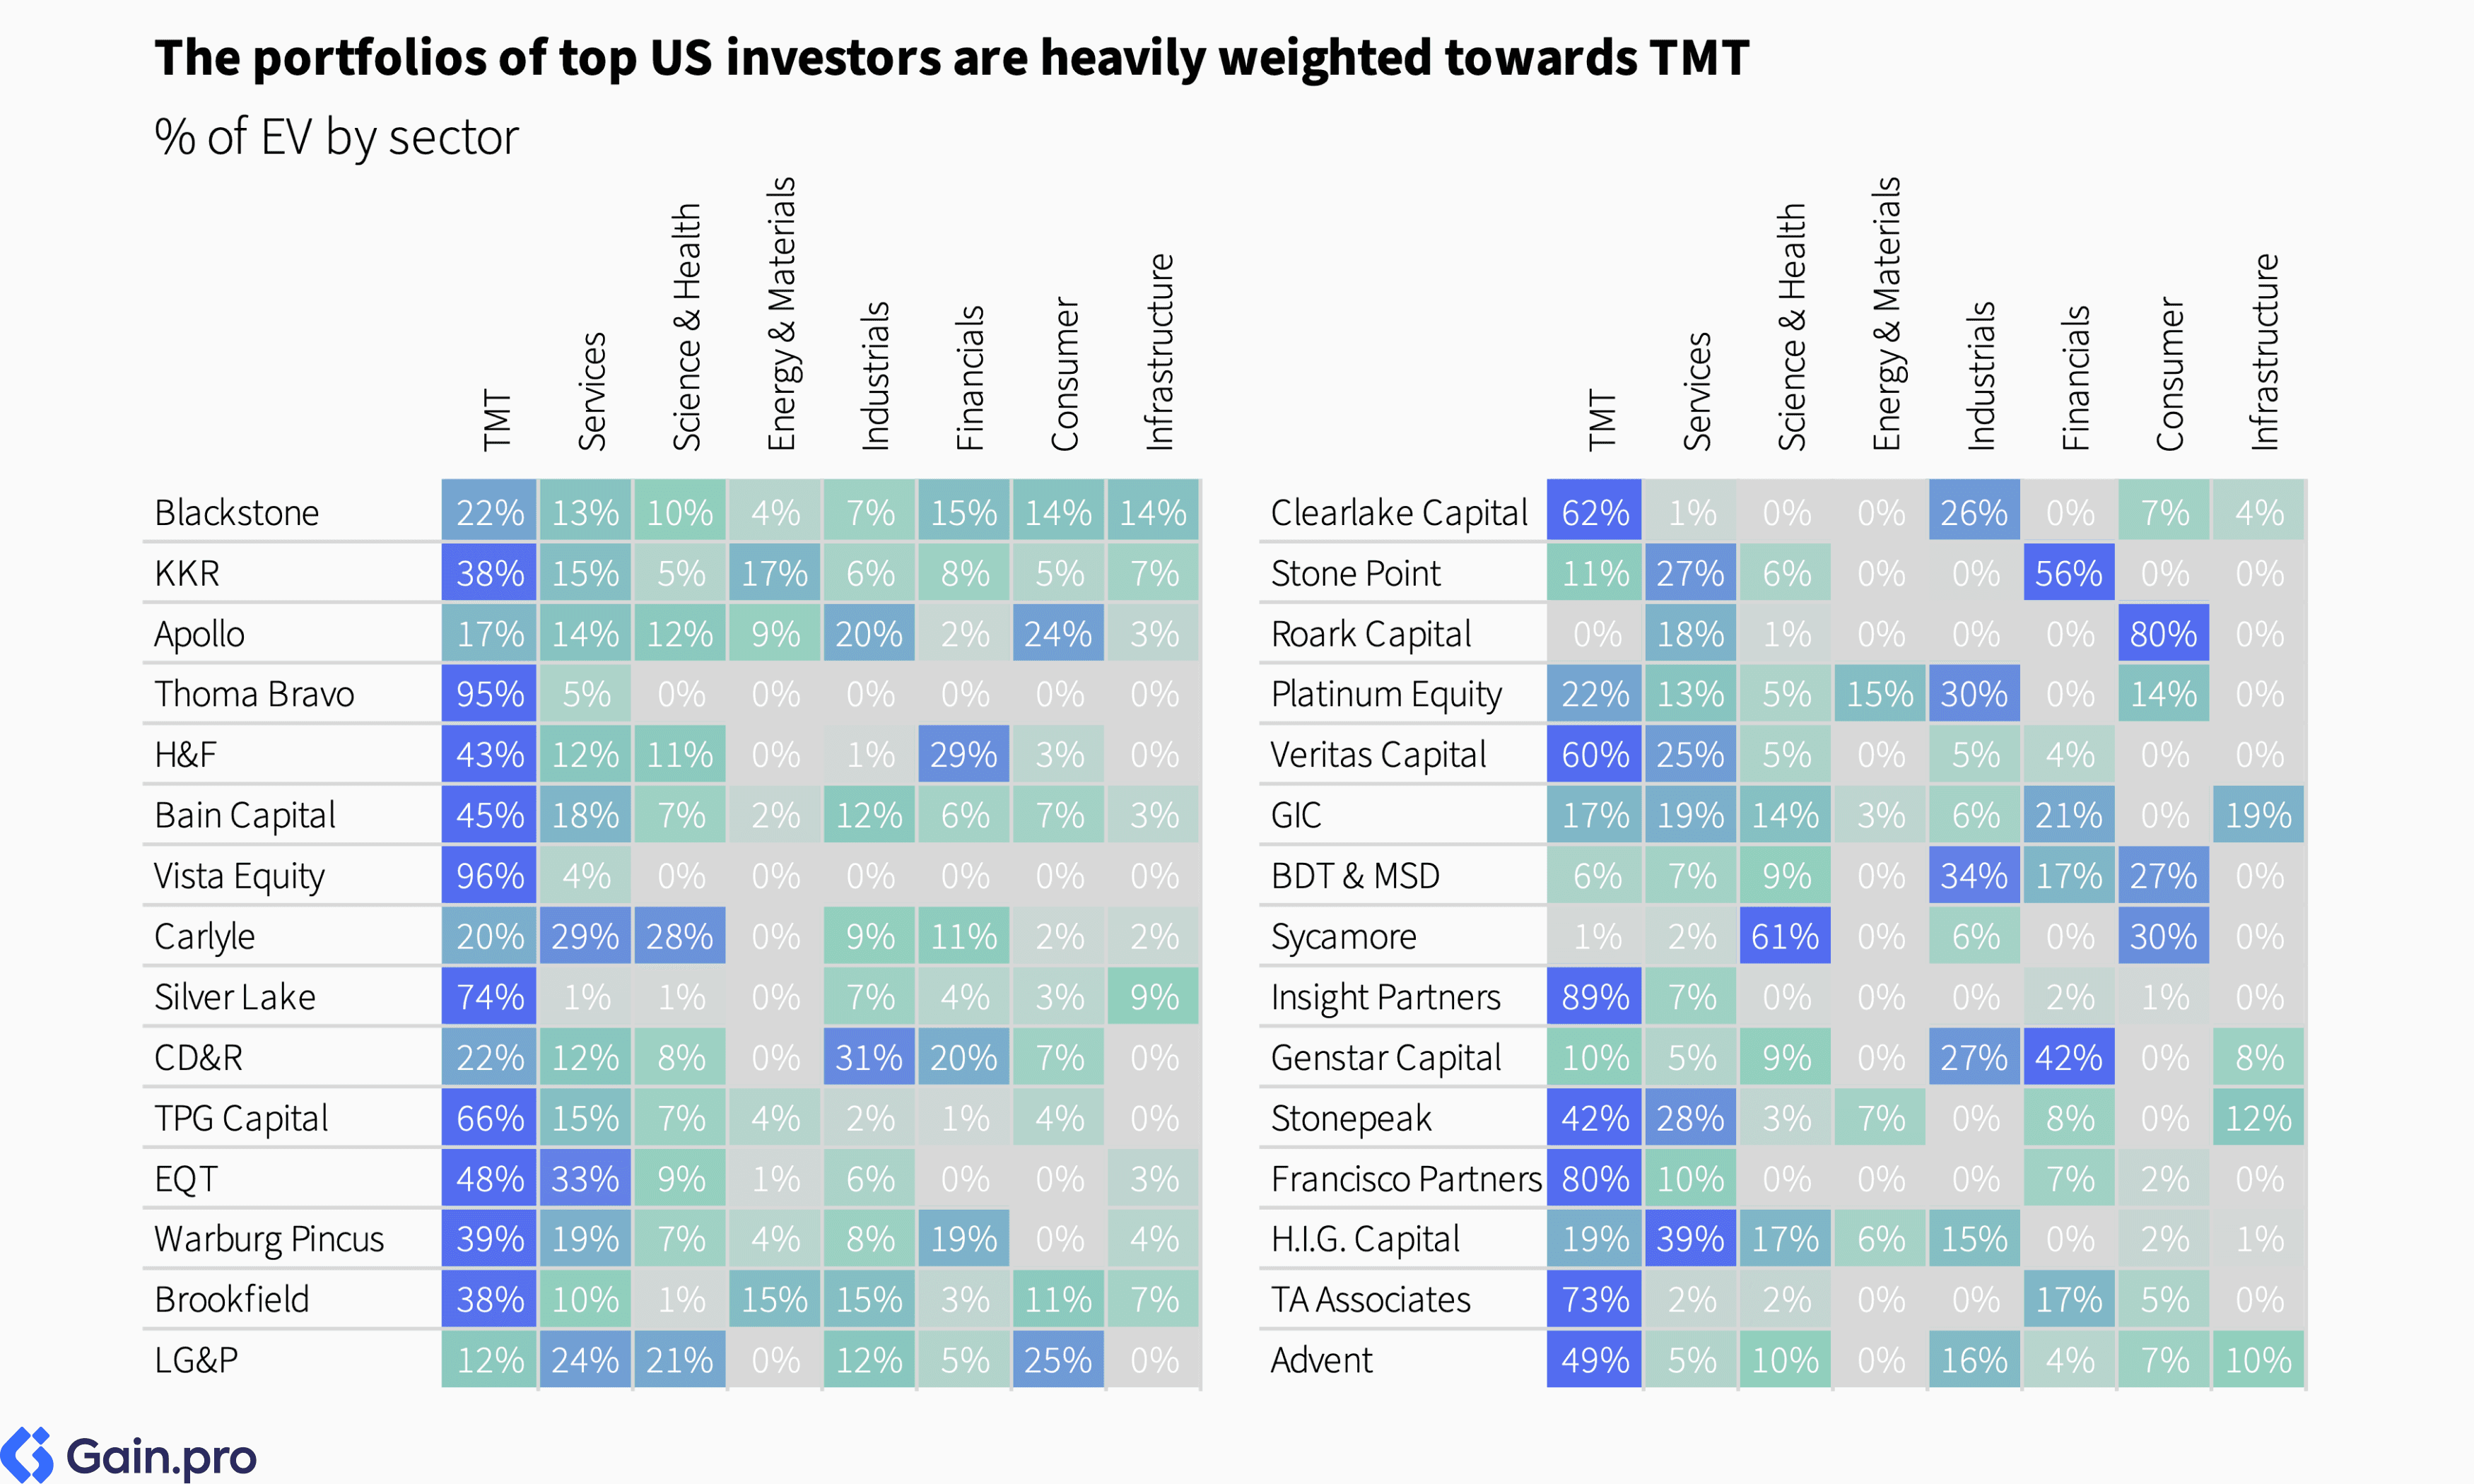
The portfolios of top US investors are heavily weighted towards TMT. Thoma Bravo, Vista Equity Partners, Silver Lake, TPG Capital, Clearlake Capital, Veritas Capital, Insight Partners, Francisco Partners, and TA Associates all have over 60% of their portfolio EV in TMT. A few other investors jump out with notable sector specialization in their portfolio, including Stone Point (56% in Financial Services), Genstar Capital (42% in Financial Services), Roark Capital (80% in Consumer), BDT & MSD Partners (34% in Industrials), Sycamore (61% in Science & Health), and H.I.G. Capital (39% in Services).
The portfolios of large US investors are generally well diversified across regions. However, some investors' portfolios do showcase regional focus. These include Silver Lake (with 90% of its EV in the West), Veritas Capital (78% in the South), CD&R (59% in the South), Roark Capital (64% in the South), and BDT & MSD Partners (63% in the Midwest).
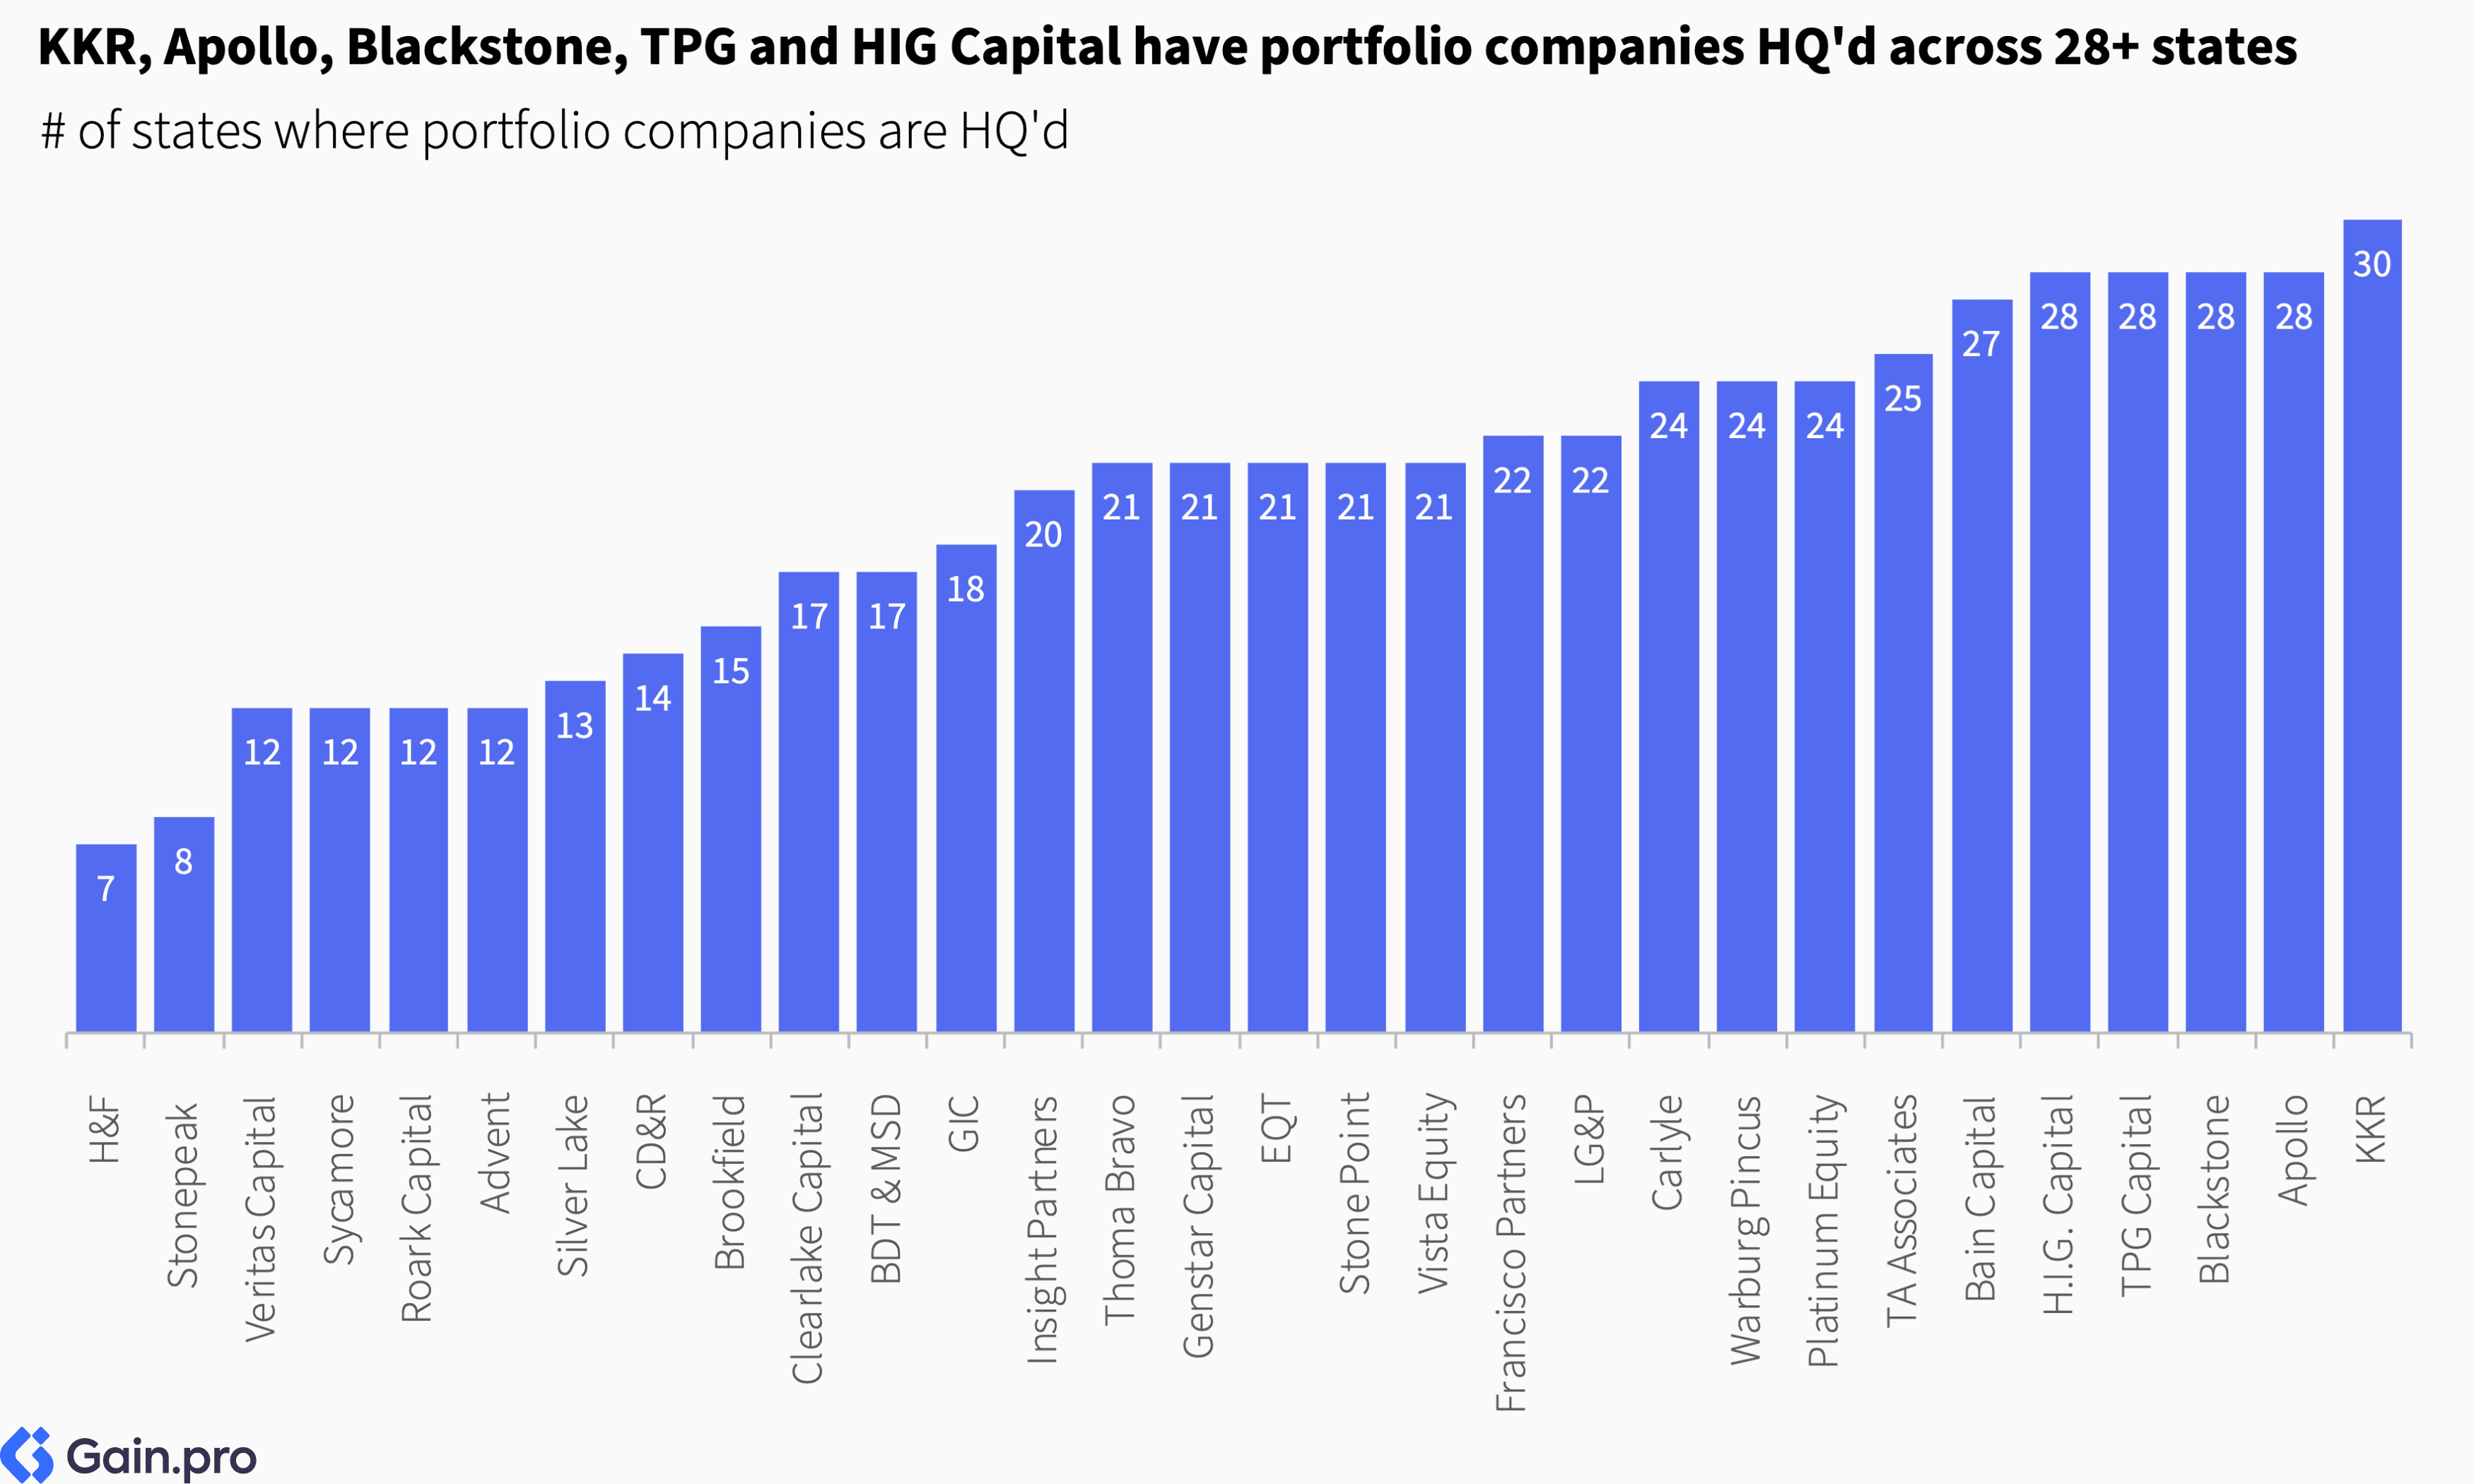
KKR, Apollo, Blackstone, TPG Capital, H.I.G. Capital, Bain Capital, and TA Associates invest coast to coast, each having portfolio company headquarters in over 25 states. In sharp contrast, Hellman & Friedman and Stonepeak have portfolio company headquarters concentrated in fewer than 10 states.
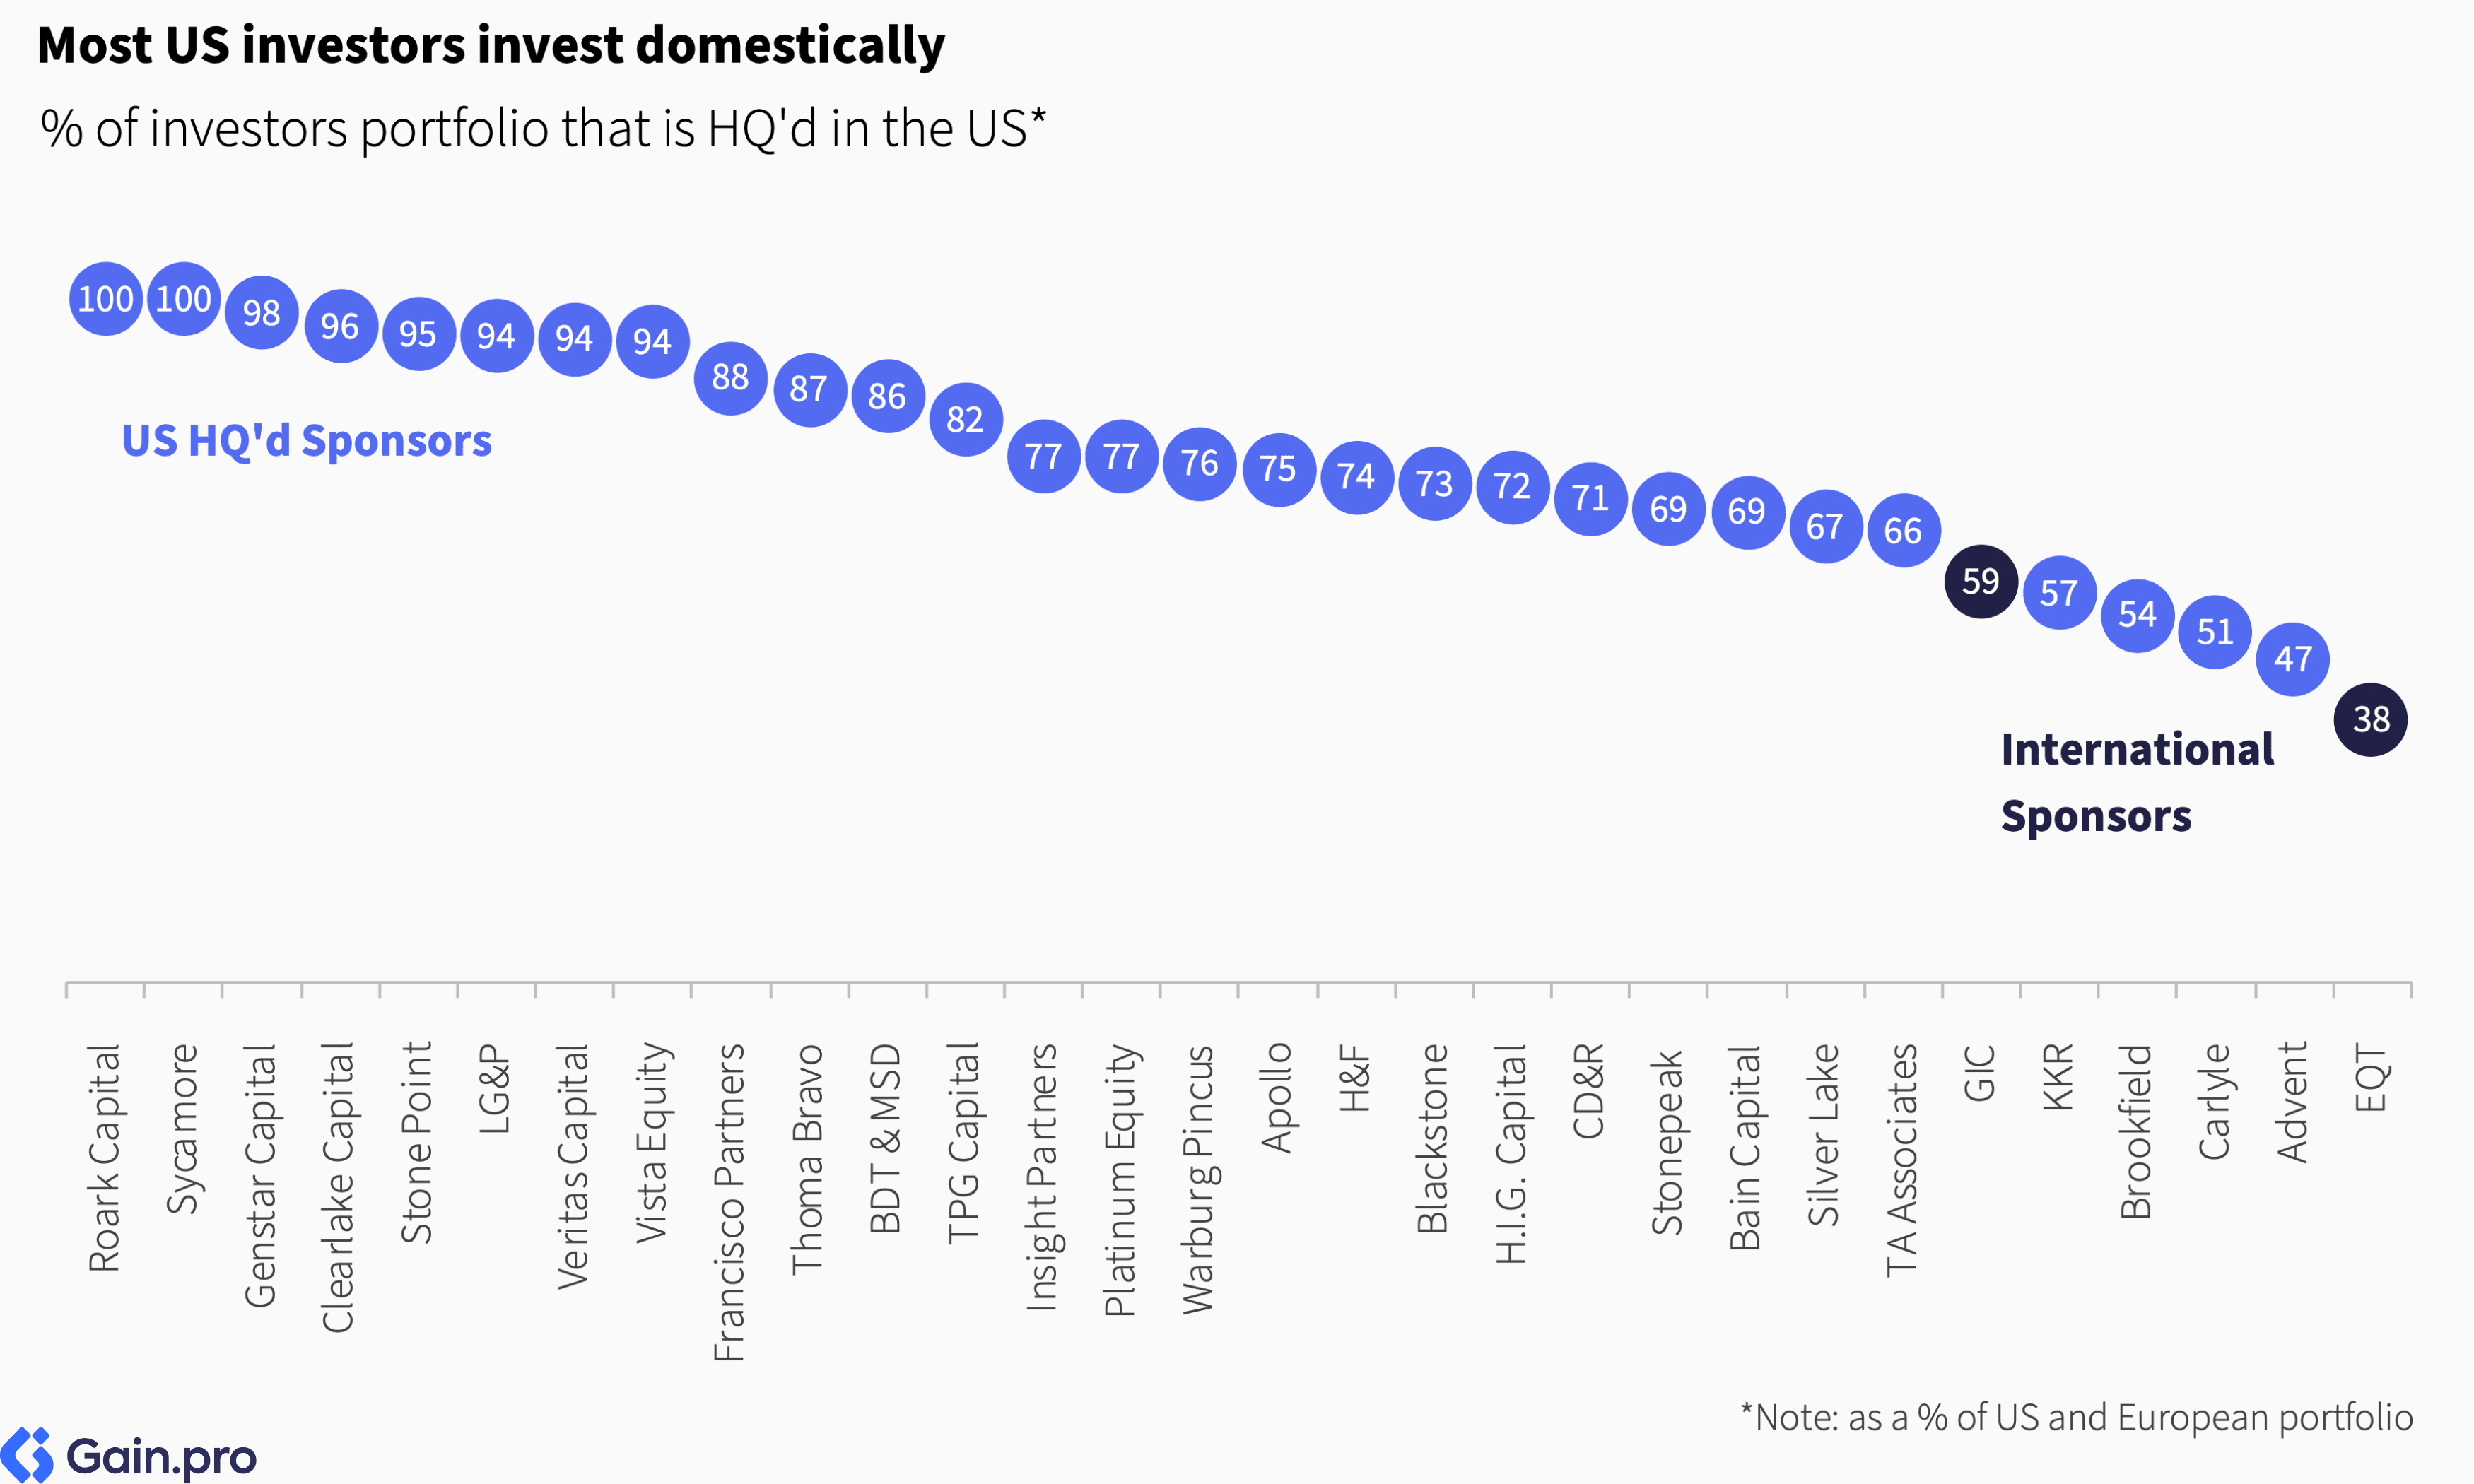
The majority of US PE investors concentrate on domestic markets. Only Advent, Carlyle, Brookfield, and KKR have more than 40% of their portfolios in Europe. Recently, however, US sponsors have been increasing their allocation to European markets.
Growth Rates and Employment
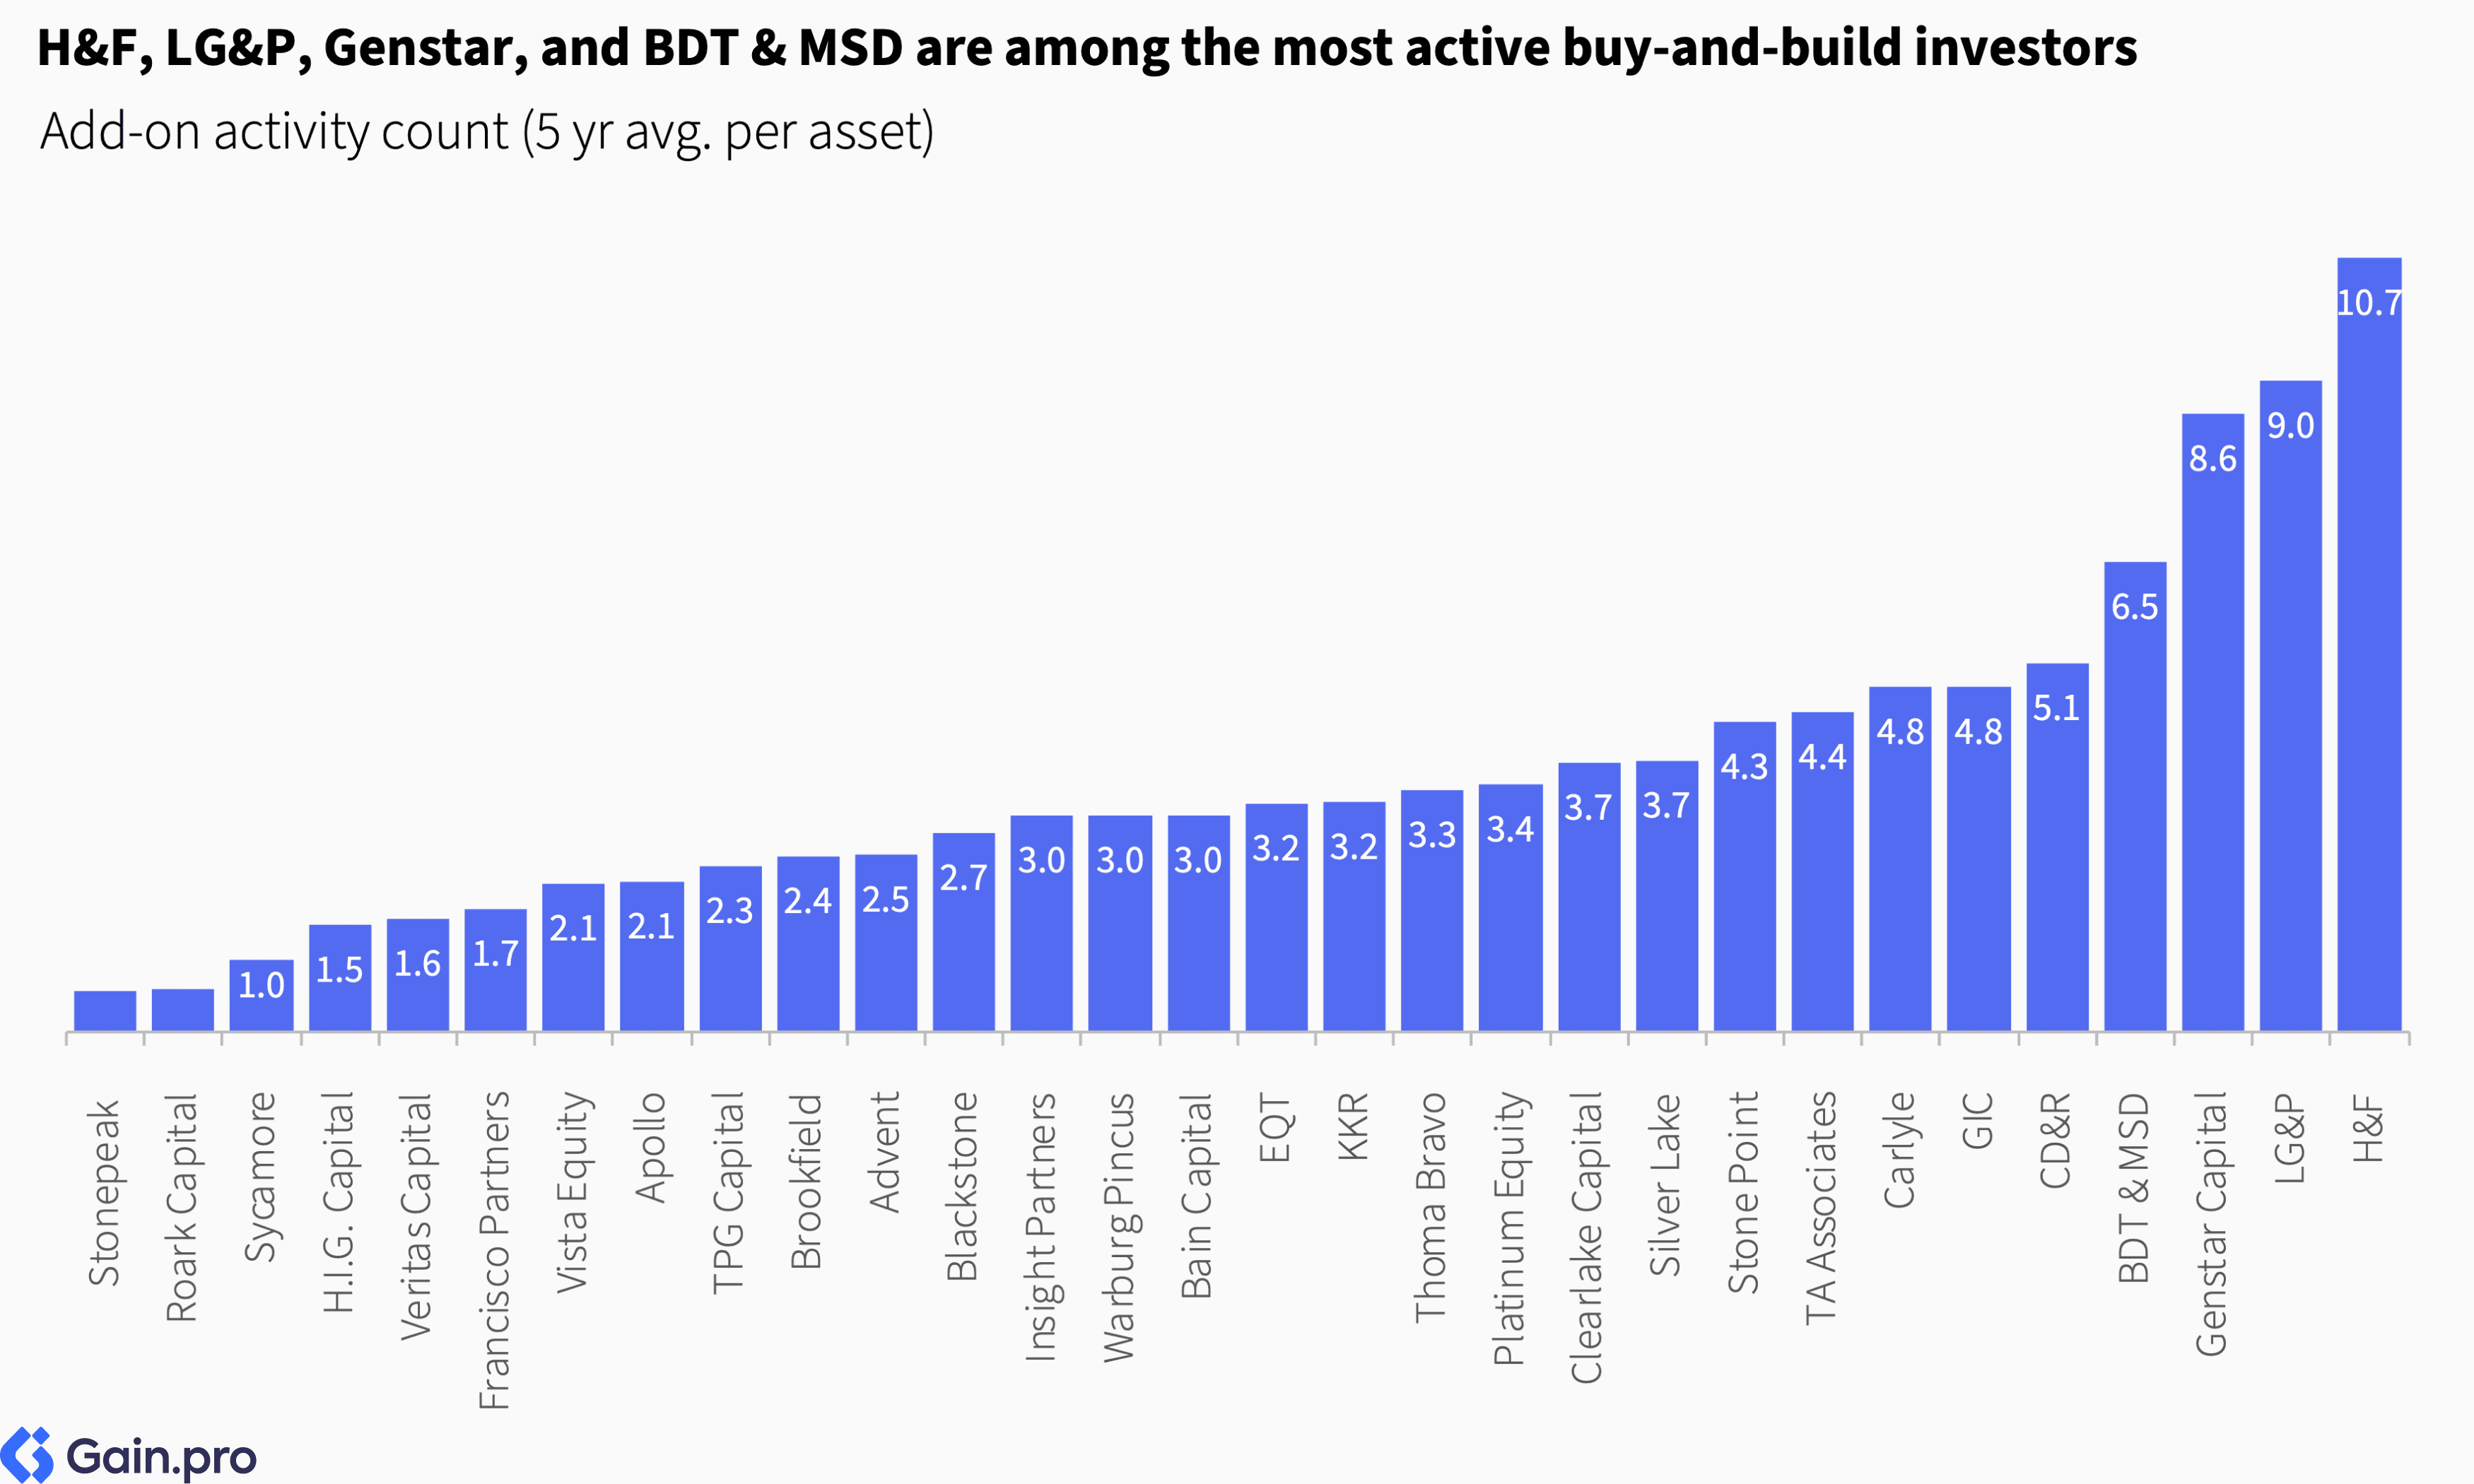
Hellman & Friedman (H&F), Leonard Green & Partners (LG&P), Genstar Capital, and BDT & MSD Partners are among the most active buy-and-build investors. Buy-and-build has now become the foremost value creation strategy across the board. For example, HUB International, one of the largest PE-backed holdings and backed by both H&F and LG&P, has executed 105 acquisitions in the past five years alone.
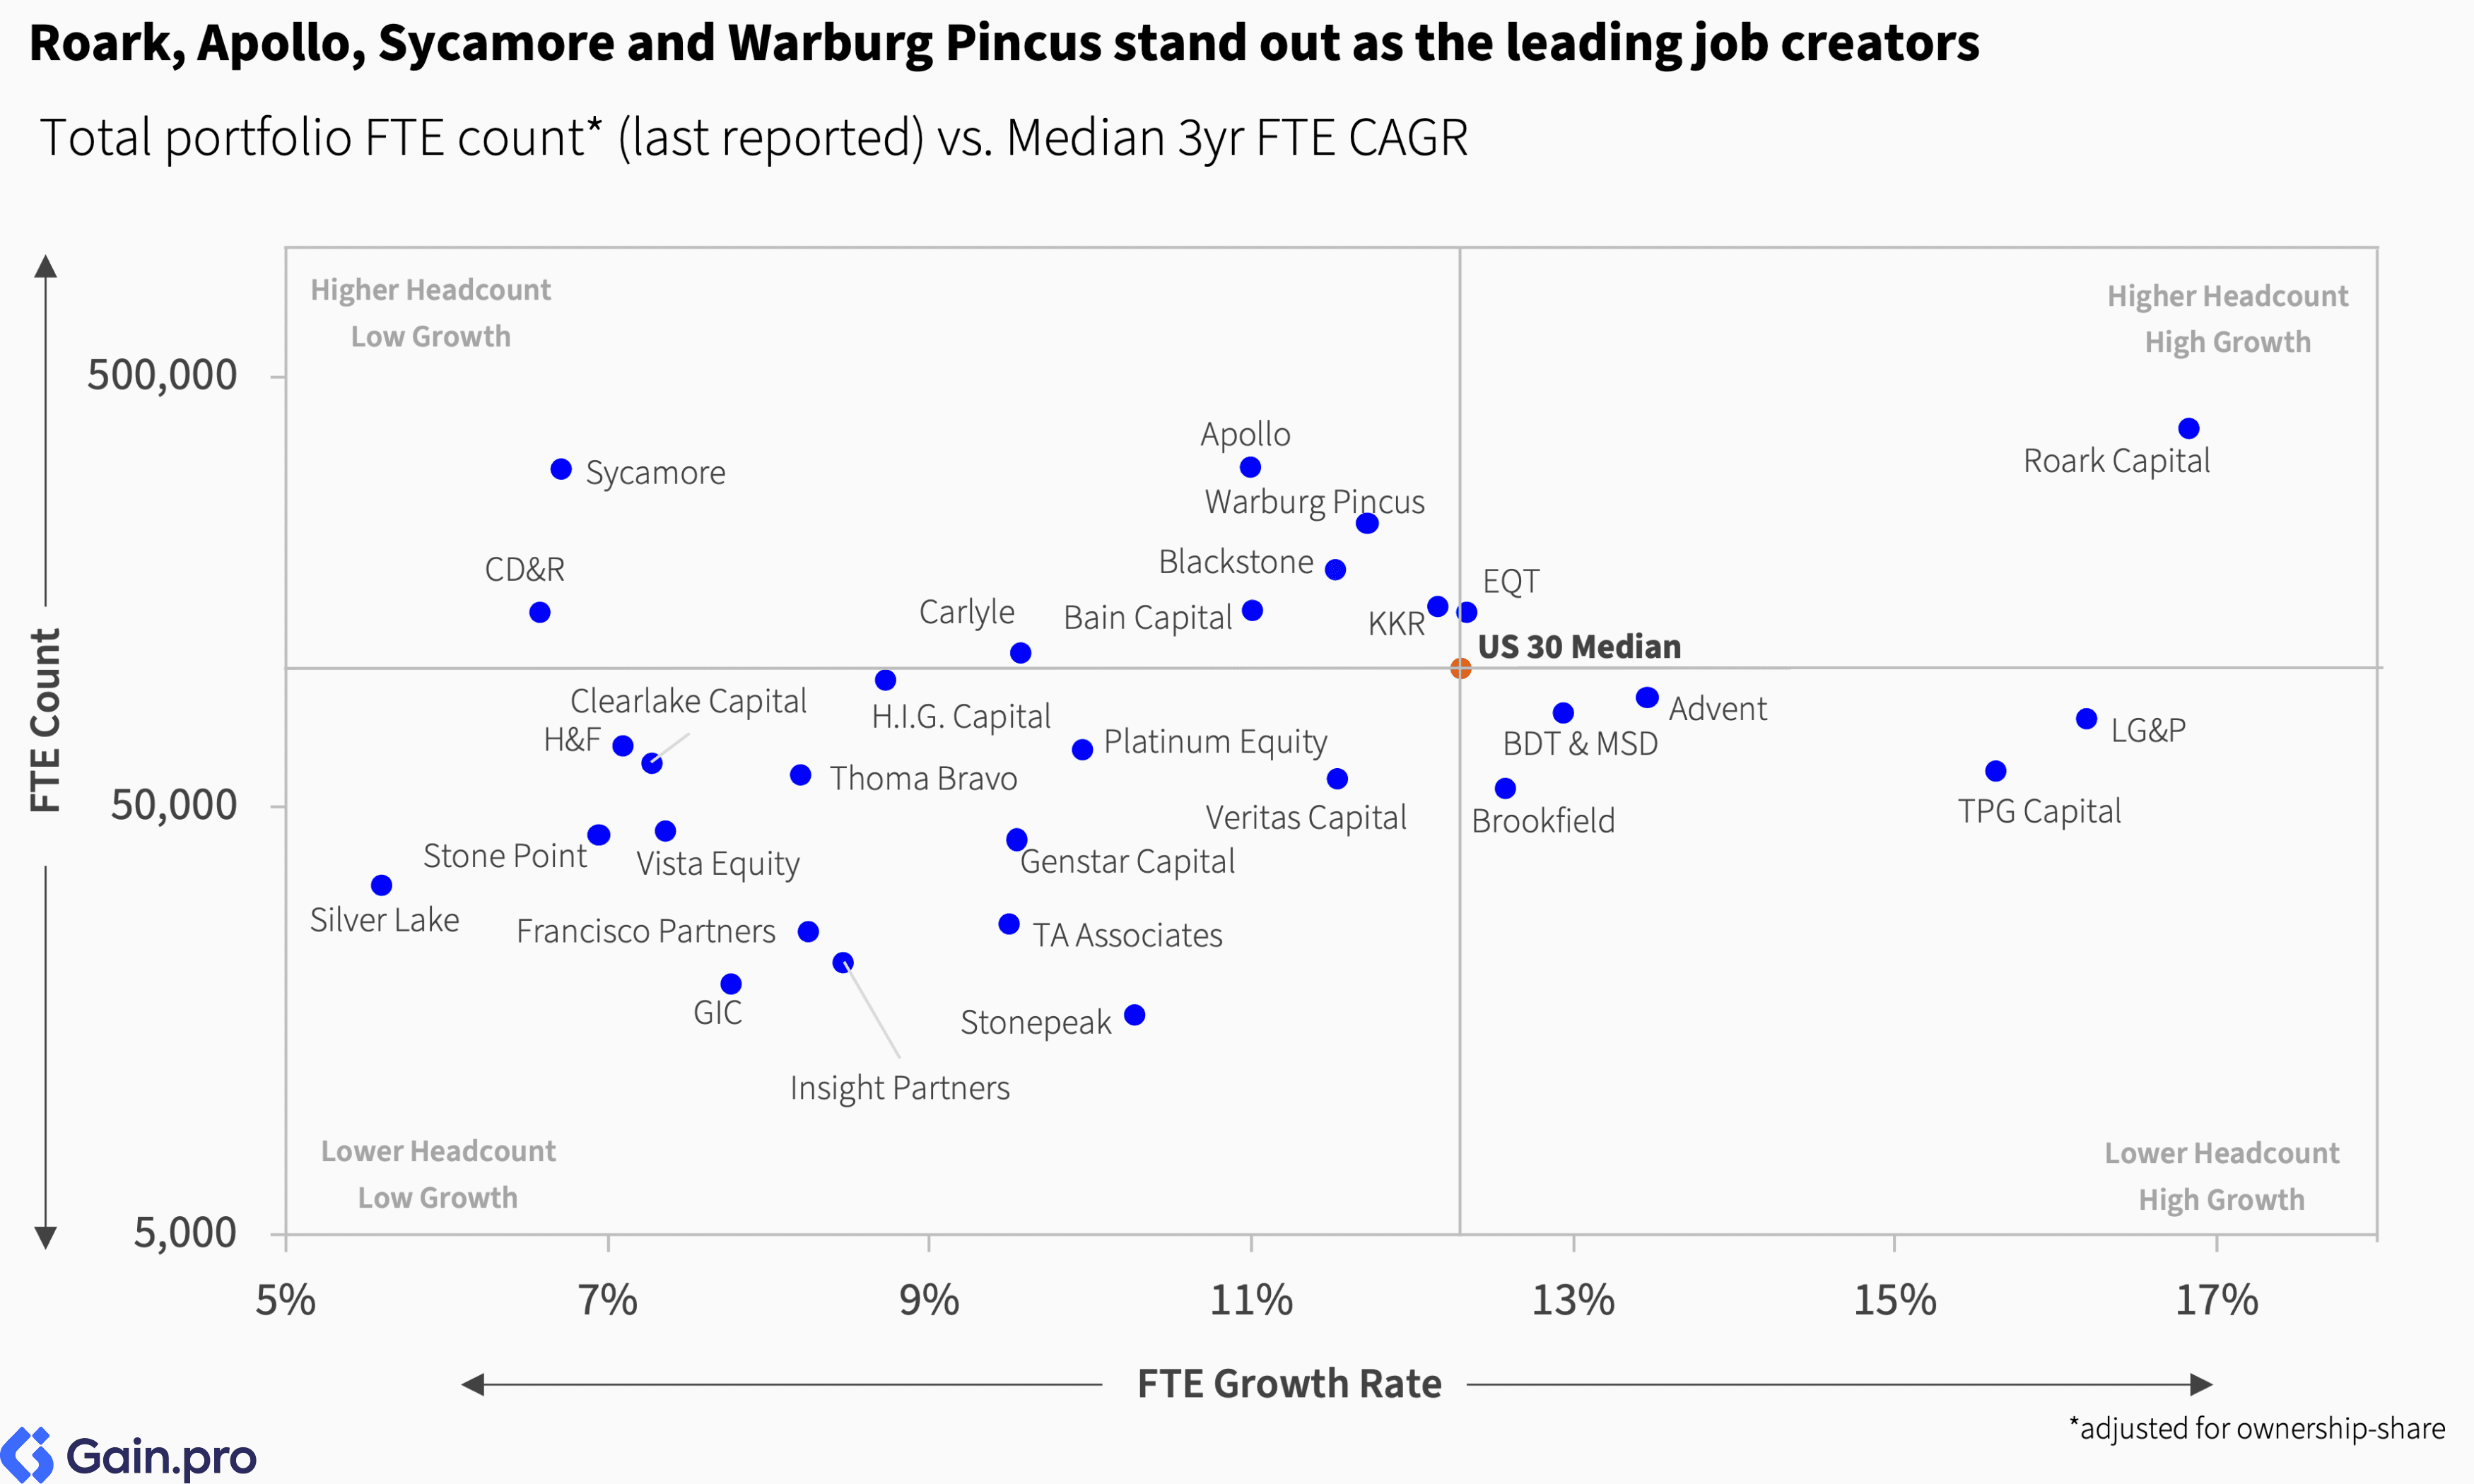
Roark Capital, Apollo, Sycamore, and Warburg Pincus stand out as leading job creators. Roark Capital owns a vast restaurant portfolio, including Subway, Arby's, Buffalo Wild Wings, Jimmy John's, Dunkin', and Baskin-Robbins. Apollo's portfolio includes major employers such as Tenneco and Lifepoint Health. Warburg Pincus, meanwhile, is a key investor in Allied Universal, the world's largest private security company, while Sycamore owns Walgreens. Overall, PE-backed businesses in the US employ over 11.2 million people, roughly 5.2% of the US working-age population.
Methodology
We take a novel approach to our ranking, which is based on total managed enterprise value (EV) in the US. At Gain.pro, we track over 16,800 investor portfolios in detail.
To estimate the managed enterprise value (EV), we estimate the EV for each asset in an investor’s portfolio. We begin with the last reported deal value, where publicly available. If it's not available, we estimate the EV by multiplying EBITDA by the predicted exit multiple. The total EV is then aggregated at the investor level.
We scale the last reported deal value by a growth multiplier to estimate its current holding value. We also adjust EV for the investor's estimated ownership share in an asset.
Where there aren't reported deal figures or financials, we estimate them using the asset's revenue, subsector margins, and revenue/FTE calculations.
To predict exit multiples, we consider an asset's sector, size, growth rate, margin profile, and cash generation.

Our ranking is limited to US-headquartered portfolio companies in which PE firms hold either majority (buyout) or minority stakes. We exclude venture capital (VC) investments and publicly listed stakes.
Additionally, we include only active investors in the ranking with i) 5 or more portfolio companies in the US; ii) 5 or more entries since 2019.
For the sector and regional rankings, we include investors with i) 3 or more portfolio companies in that sector/region; ii) 2 or more entries in that sector/region since 2019.
Unless otherwise stated, all metrics and calculations are based solely on an investor's US portfolio.