
The State of European Private Equity Report
H1 2026

Executive Summary
In this report, we go deep into the PE landscape in Europe. We share insights on entries, exits, multiples, add-ons, holding periods, growth rates, margins and much more. Here is a summary of our key findings:
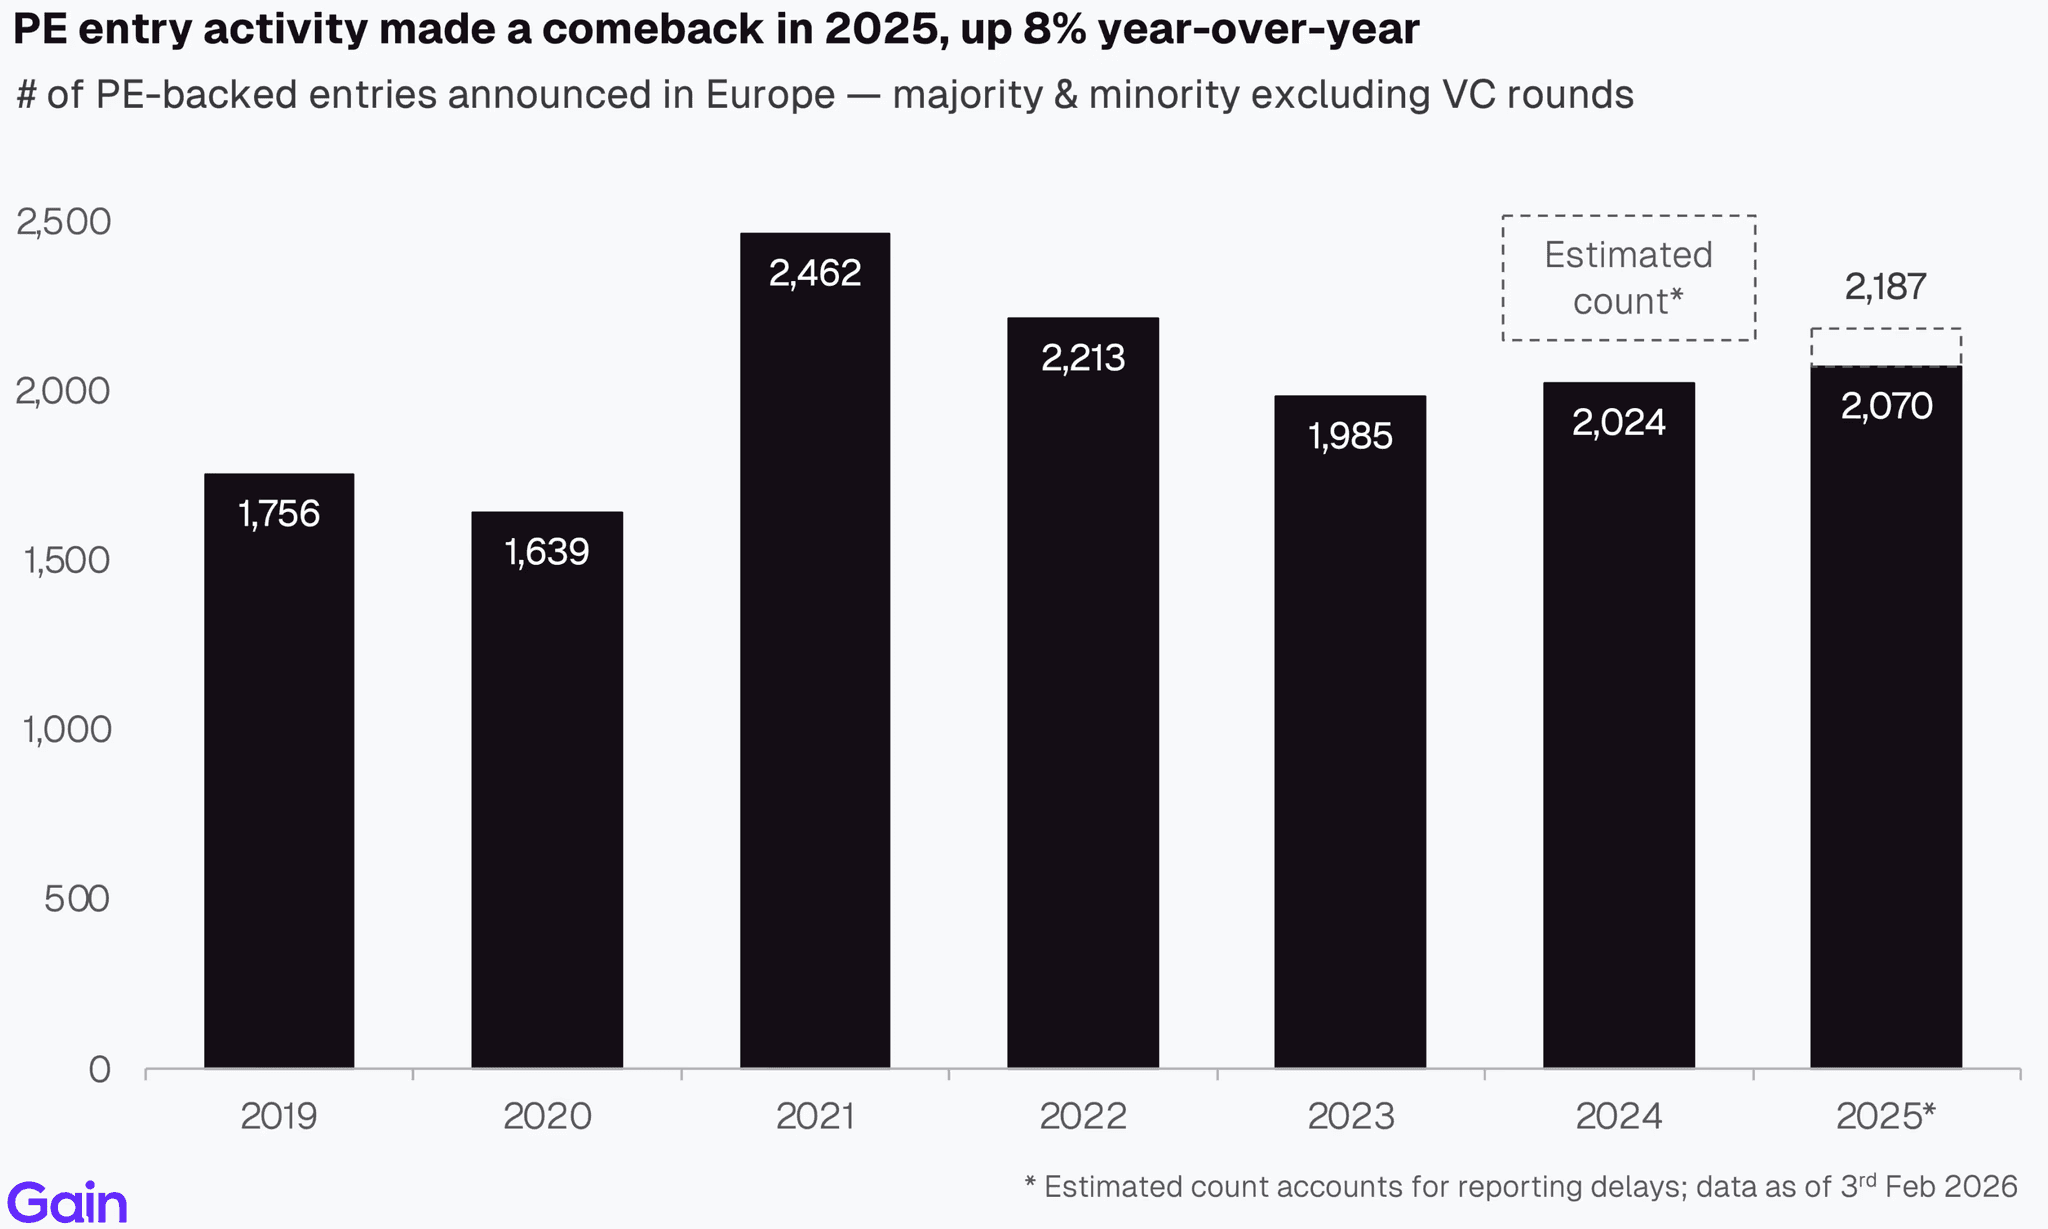
PE entry activity made a comeback in 2025, up 8% year-over-year. After two subdued years, entries are now back to 2022 levels. Italy and Iberia show robust activity, while Nordics, Benelux and DACH lagged, with entries still down >20% from their 2021 peak in those regions.
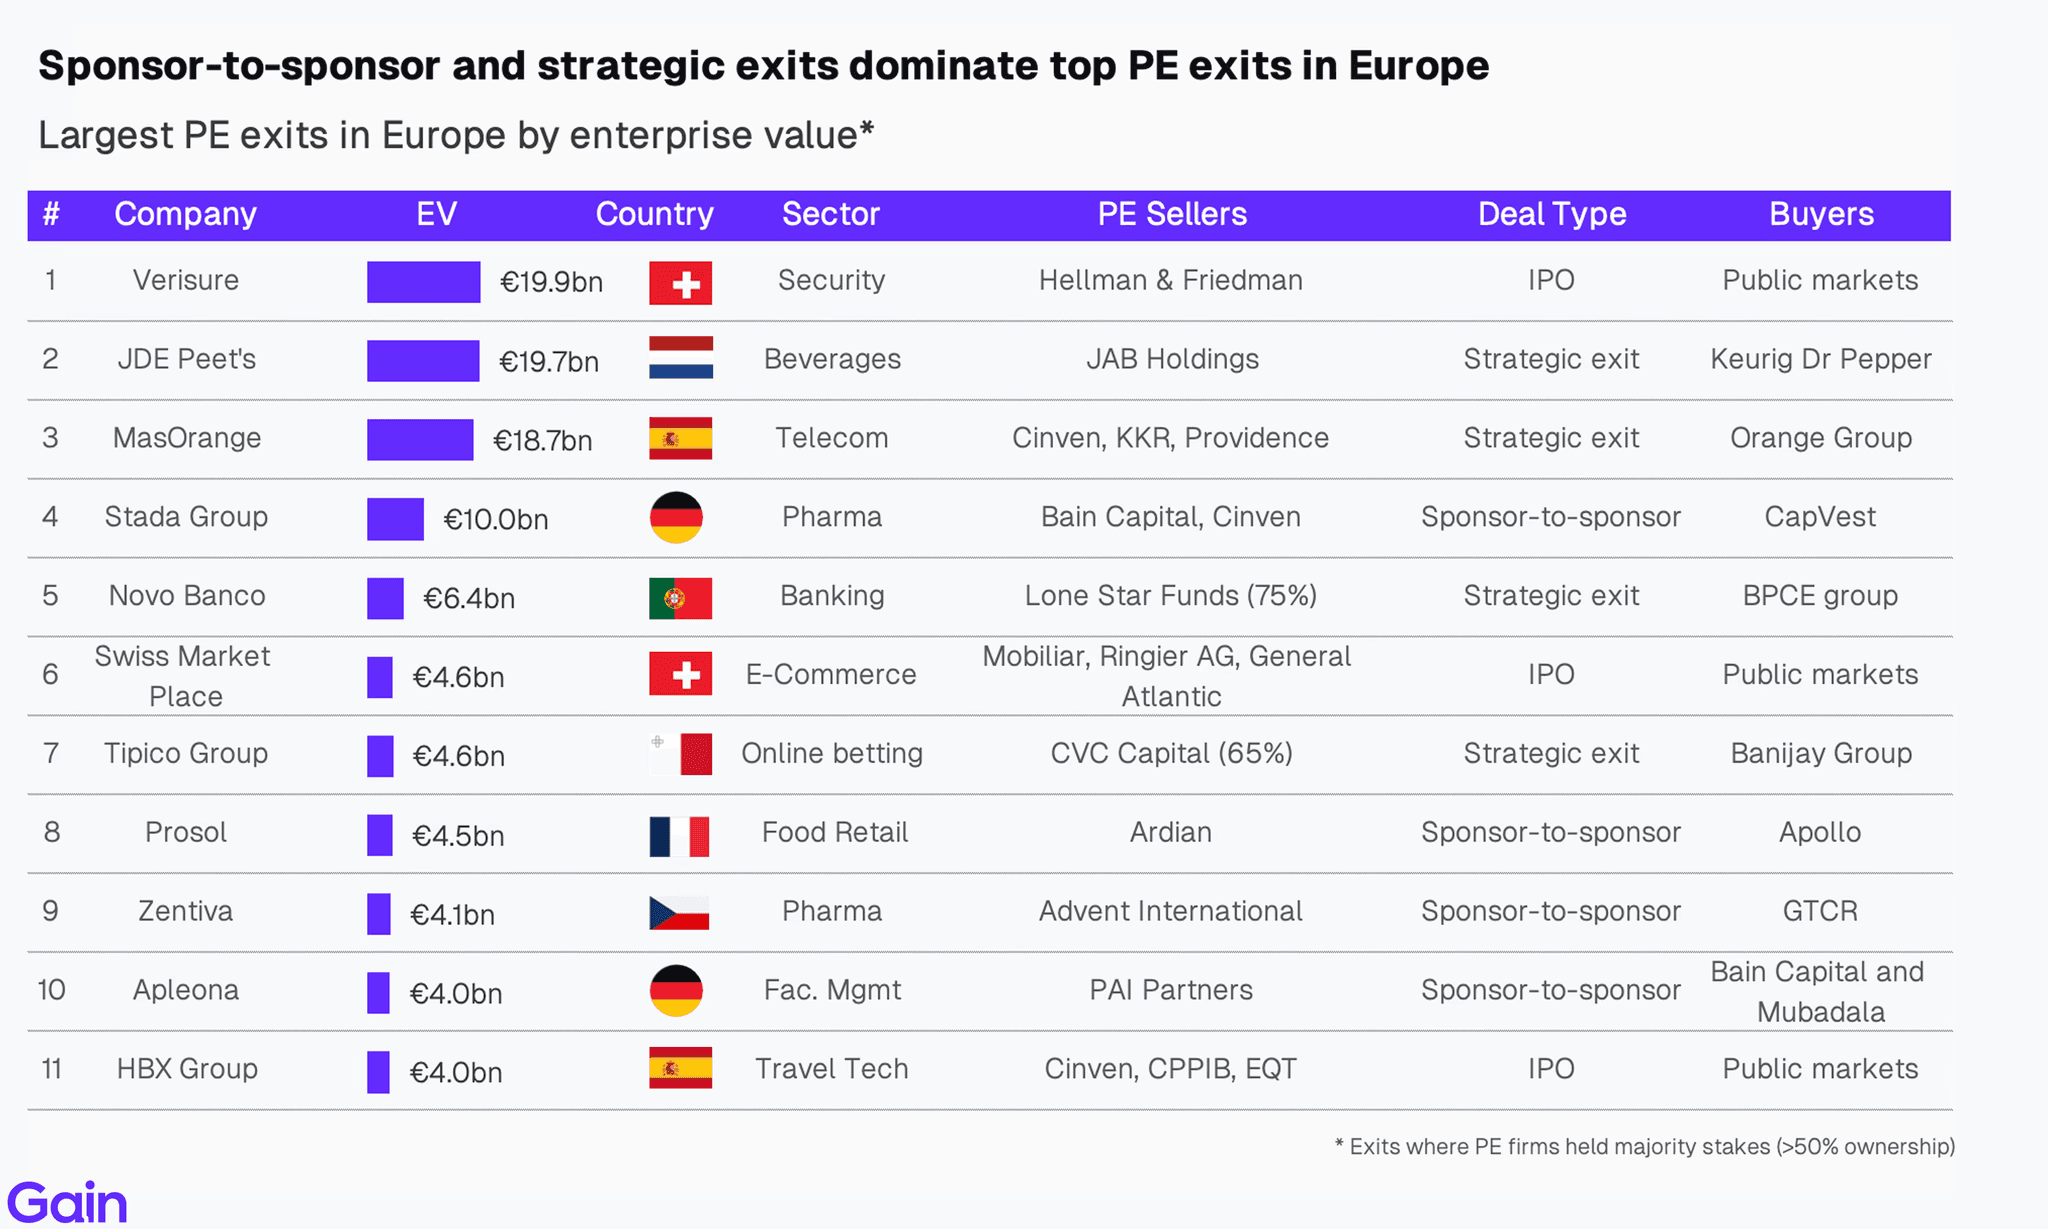
The number of large entries (>€1bn EV) surged 49% in 2025. So did the number of large exits. 2025 saw 96 €1bn+ PE exits (up from 75 in 2024). 3 of the top 10 exits were IPOs, including Verisure, the largest PE-backed IPO ever in Europe.
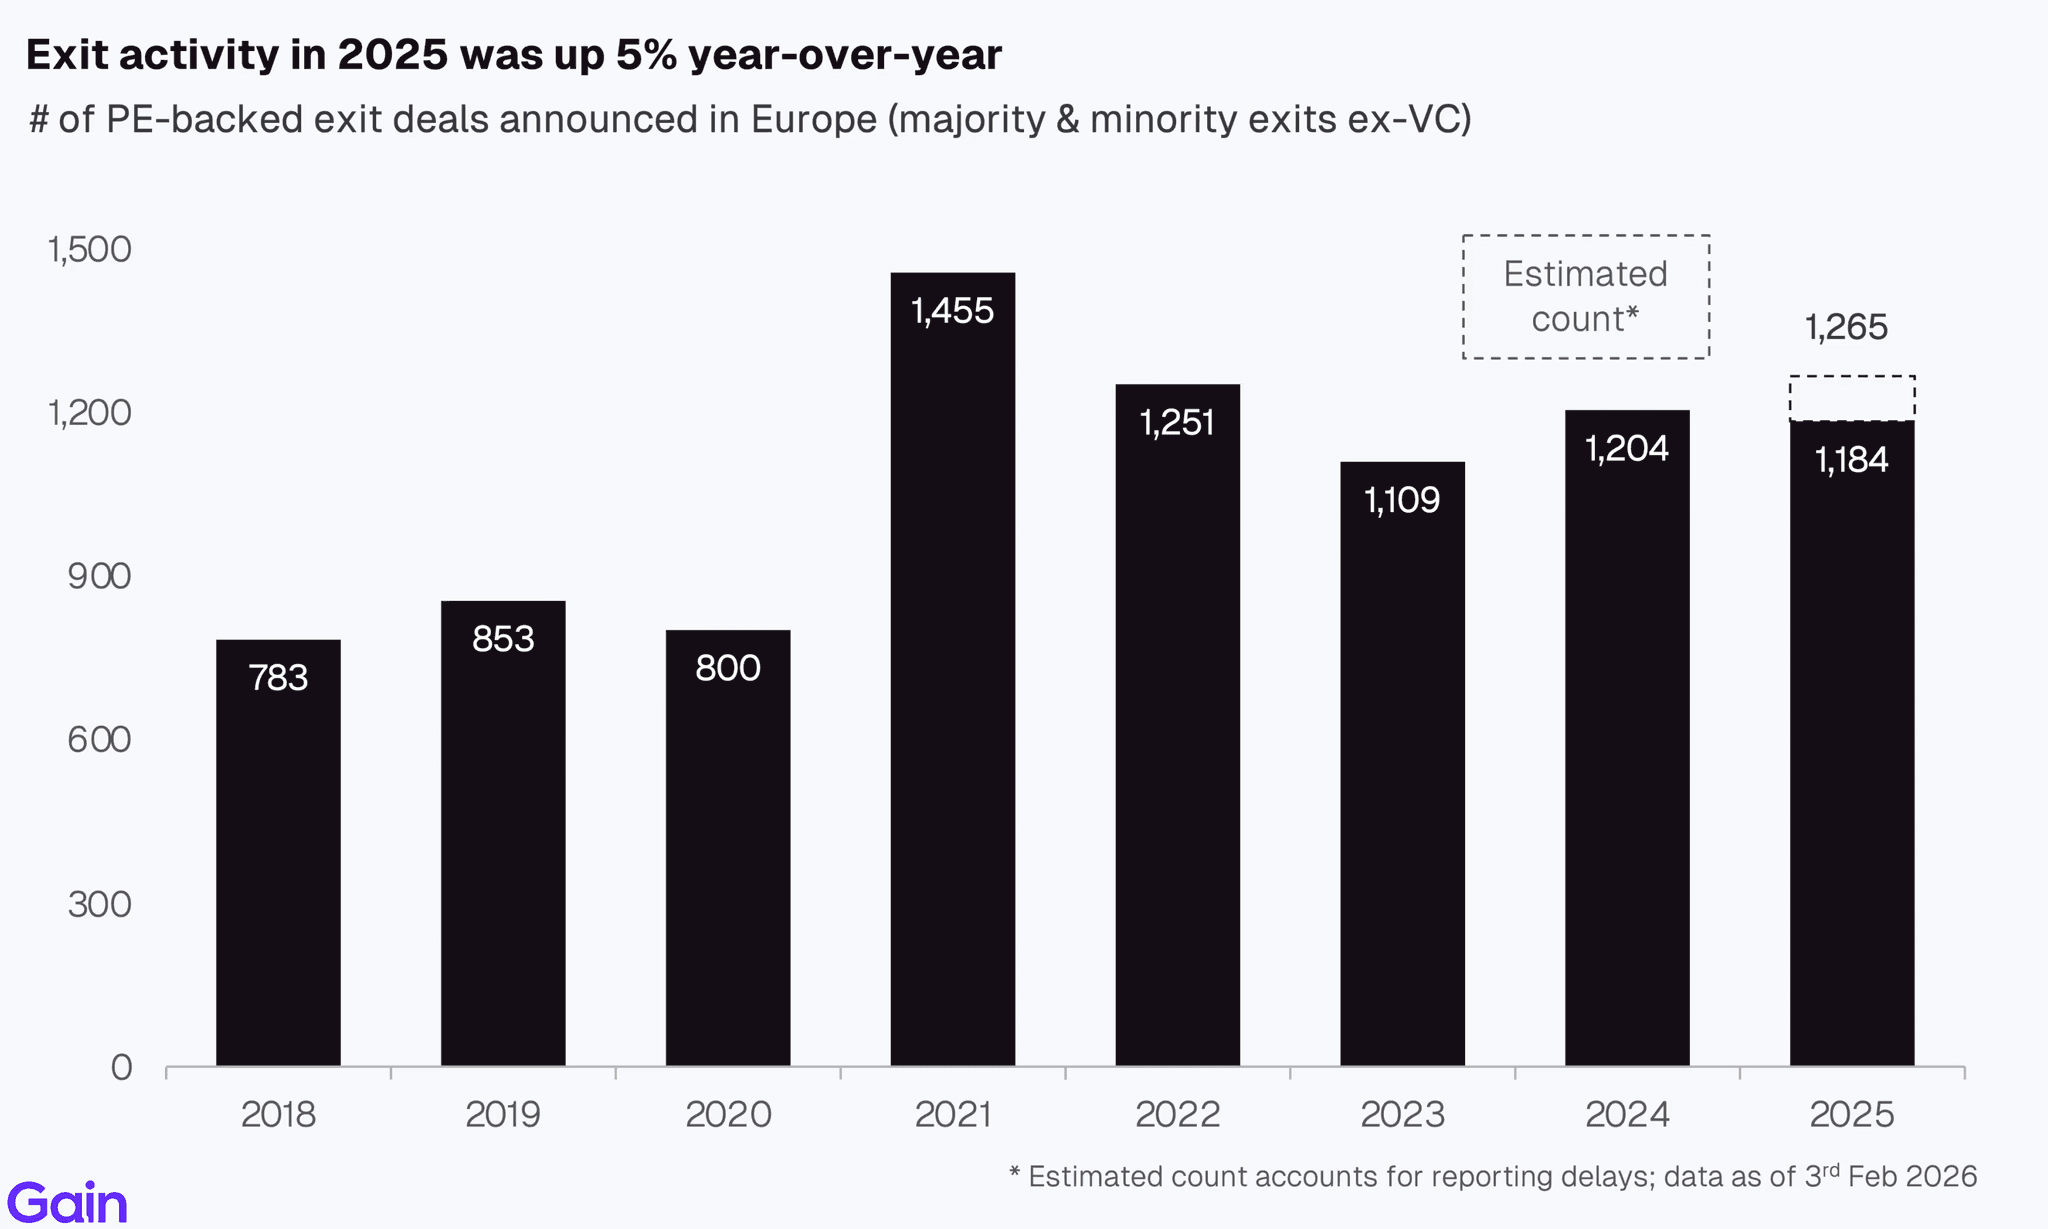
Overall exit activity jumped 5% year-over-year. This marked the 2nd consecutive year of improvement. IPO backed exits showed a yoy increase compared to last few years, though they remain below 2021 levels.
Holding periods in Europe are sitting near a decade-high and they remain higher than the US. The median company exiting in 2025 spent 5.7 years in the portfolio, up from 4.7 years in 2020. A third of PE assets stayed longer than 7 years in the portfolio, with the Consumer and Industrials sectors showing the longest holding periods.
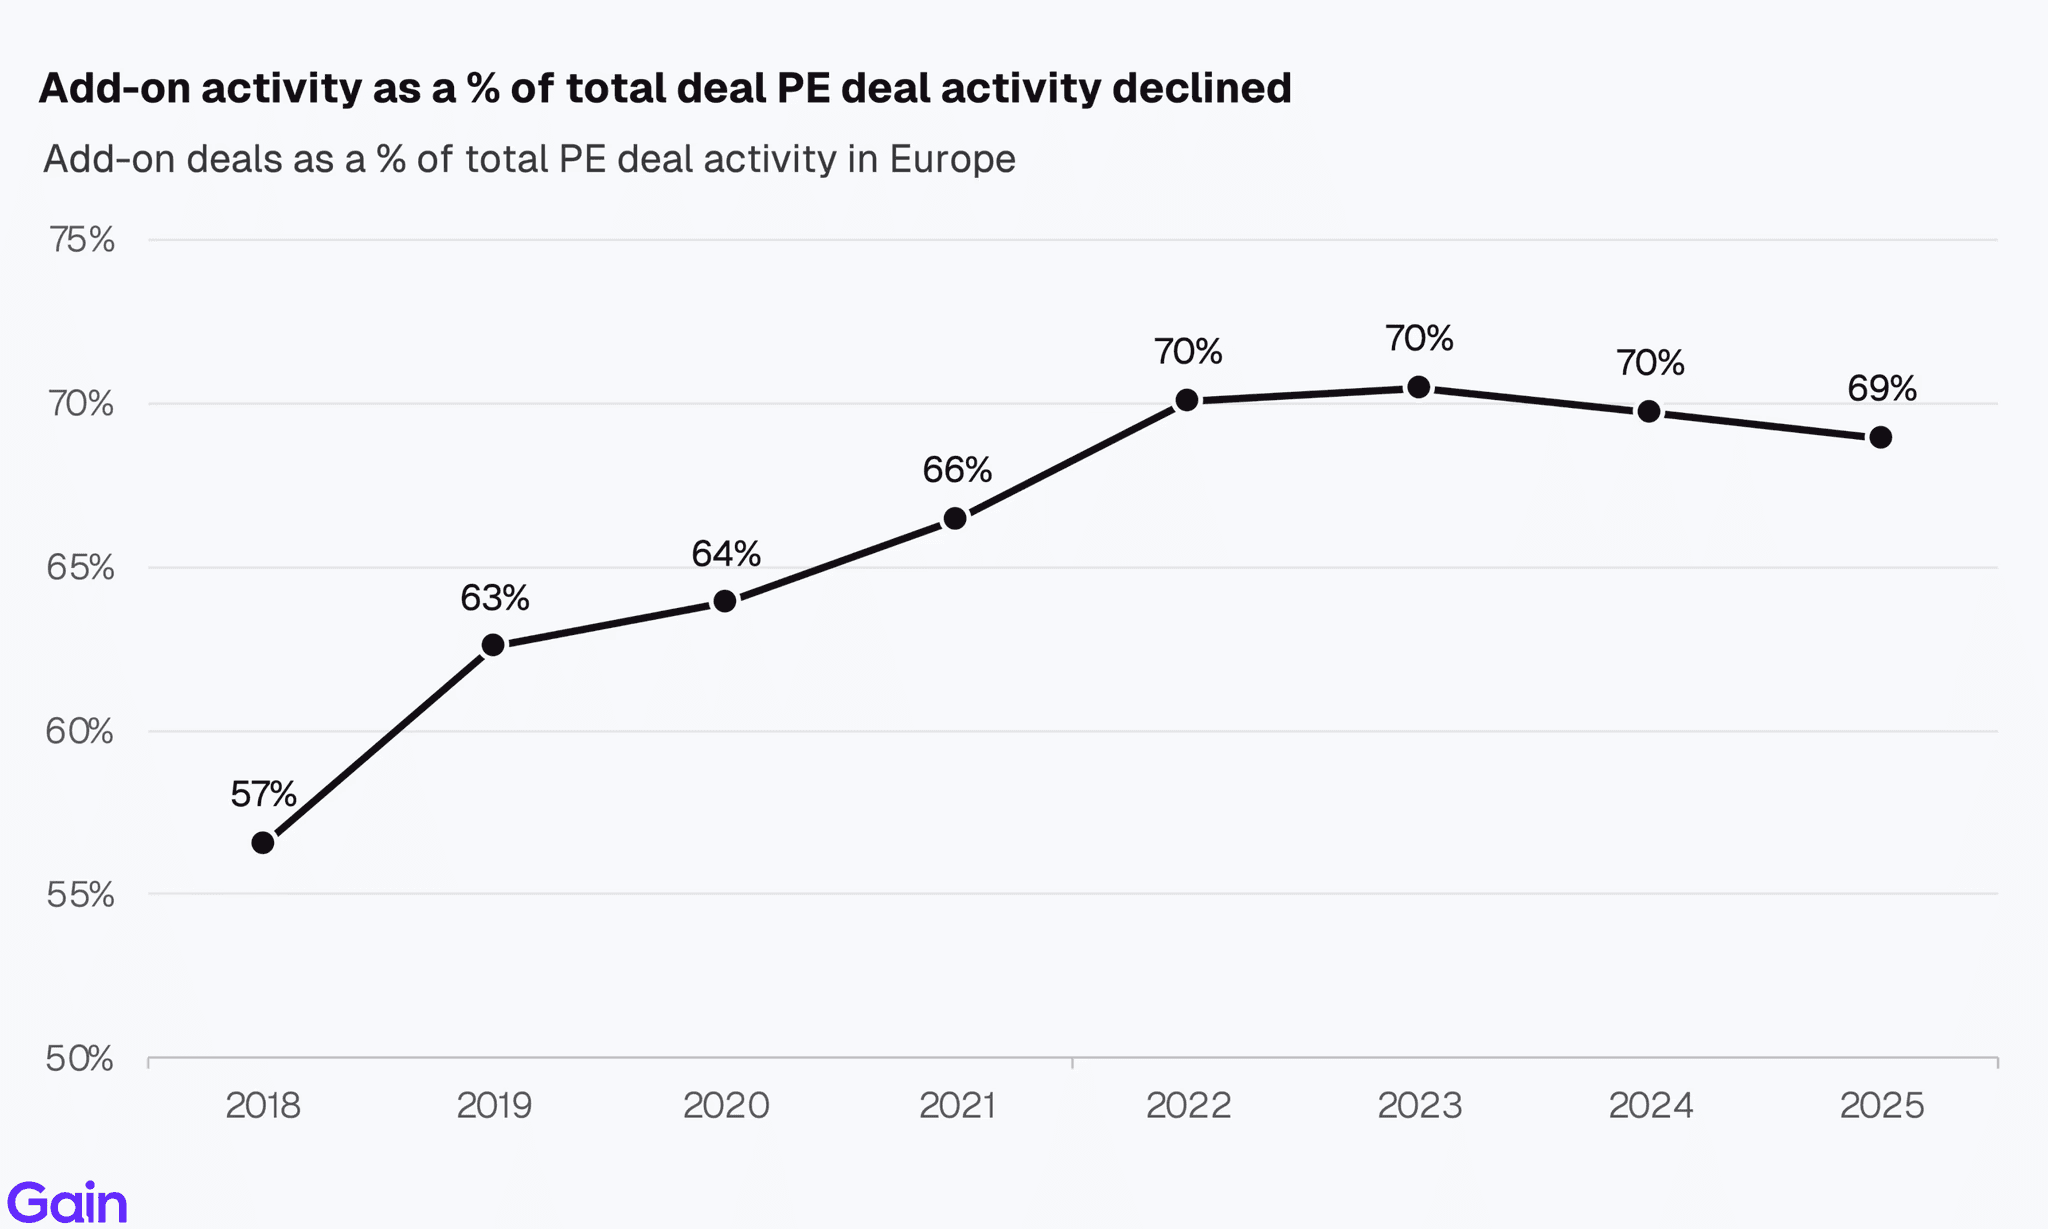
Add-on deals as a share of total deal activity declined marginally in 2025. Integration challenges, elevated financing costs, and the narrowing multiple arbitrage opportunities moderated the pace of consolidation.
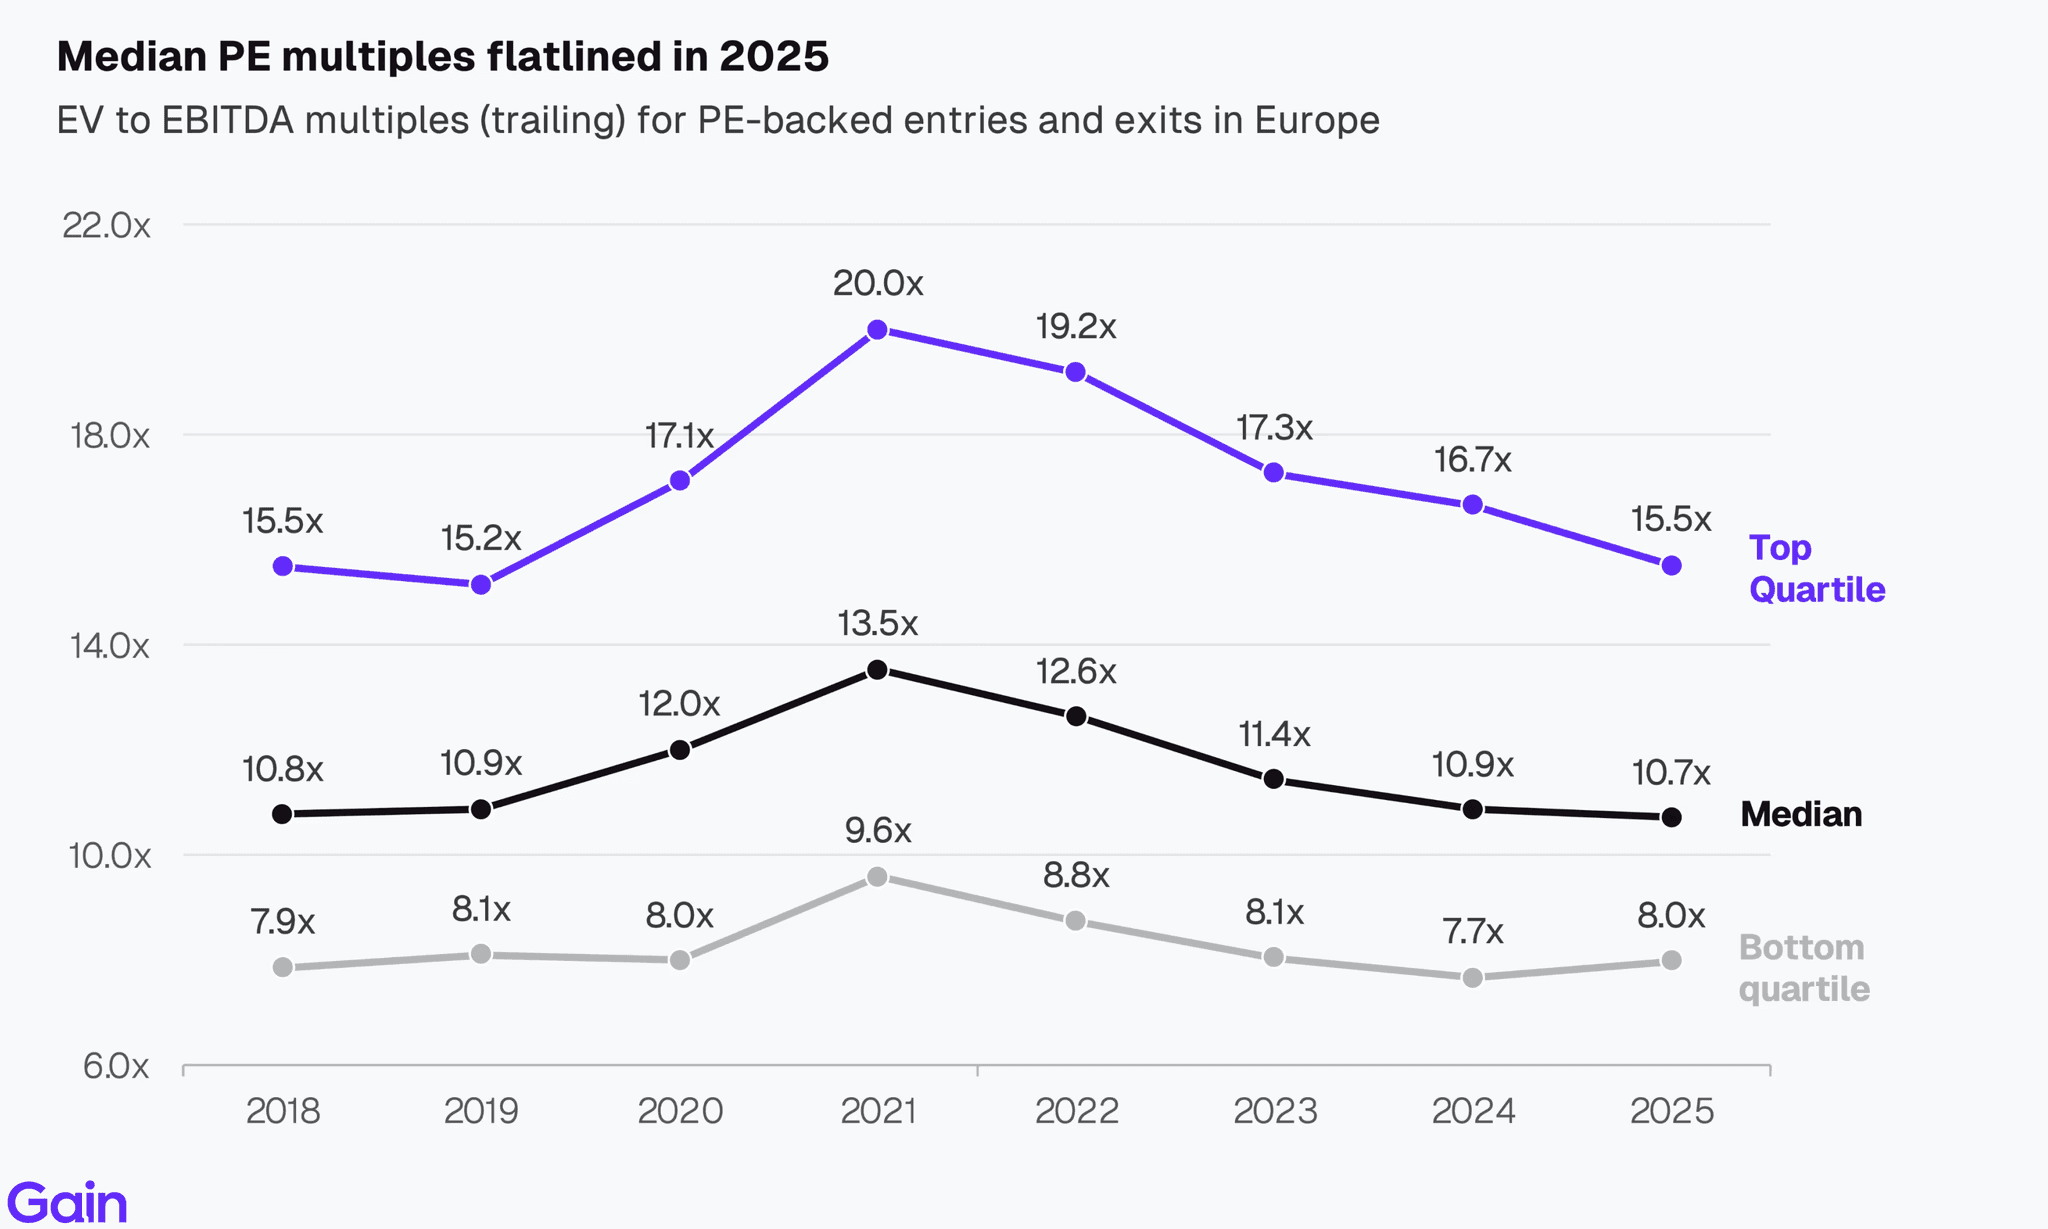
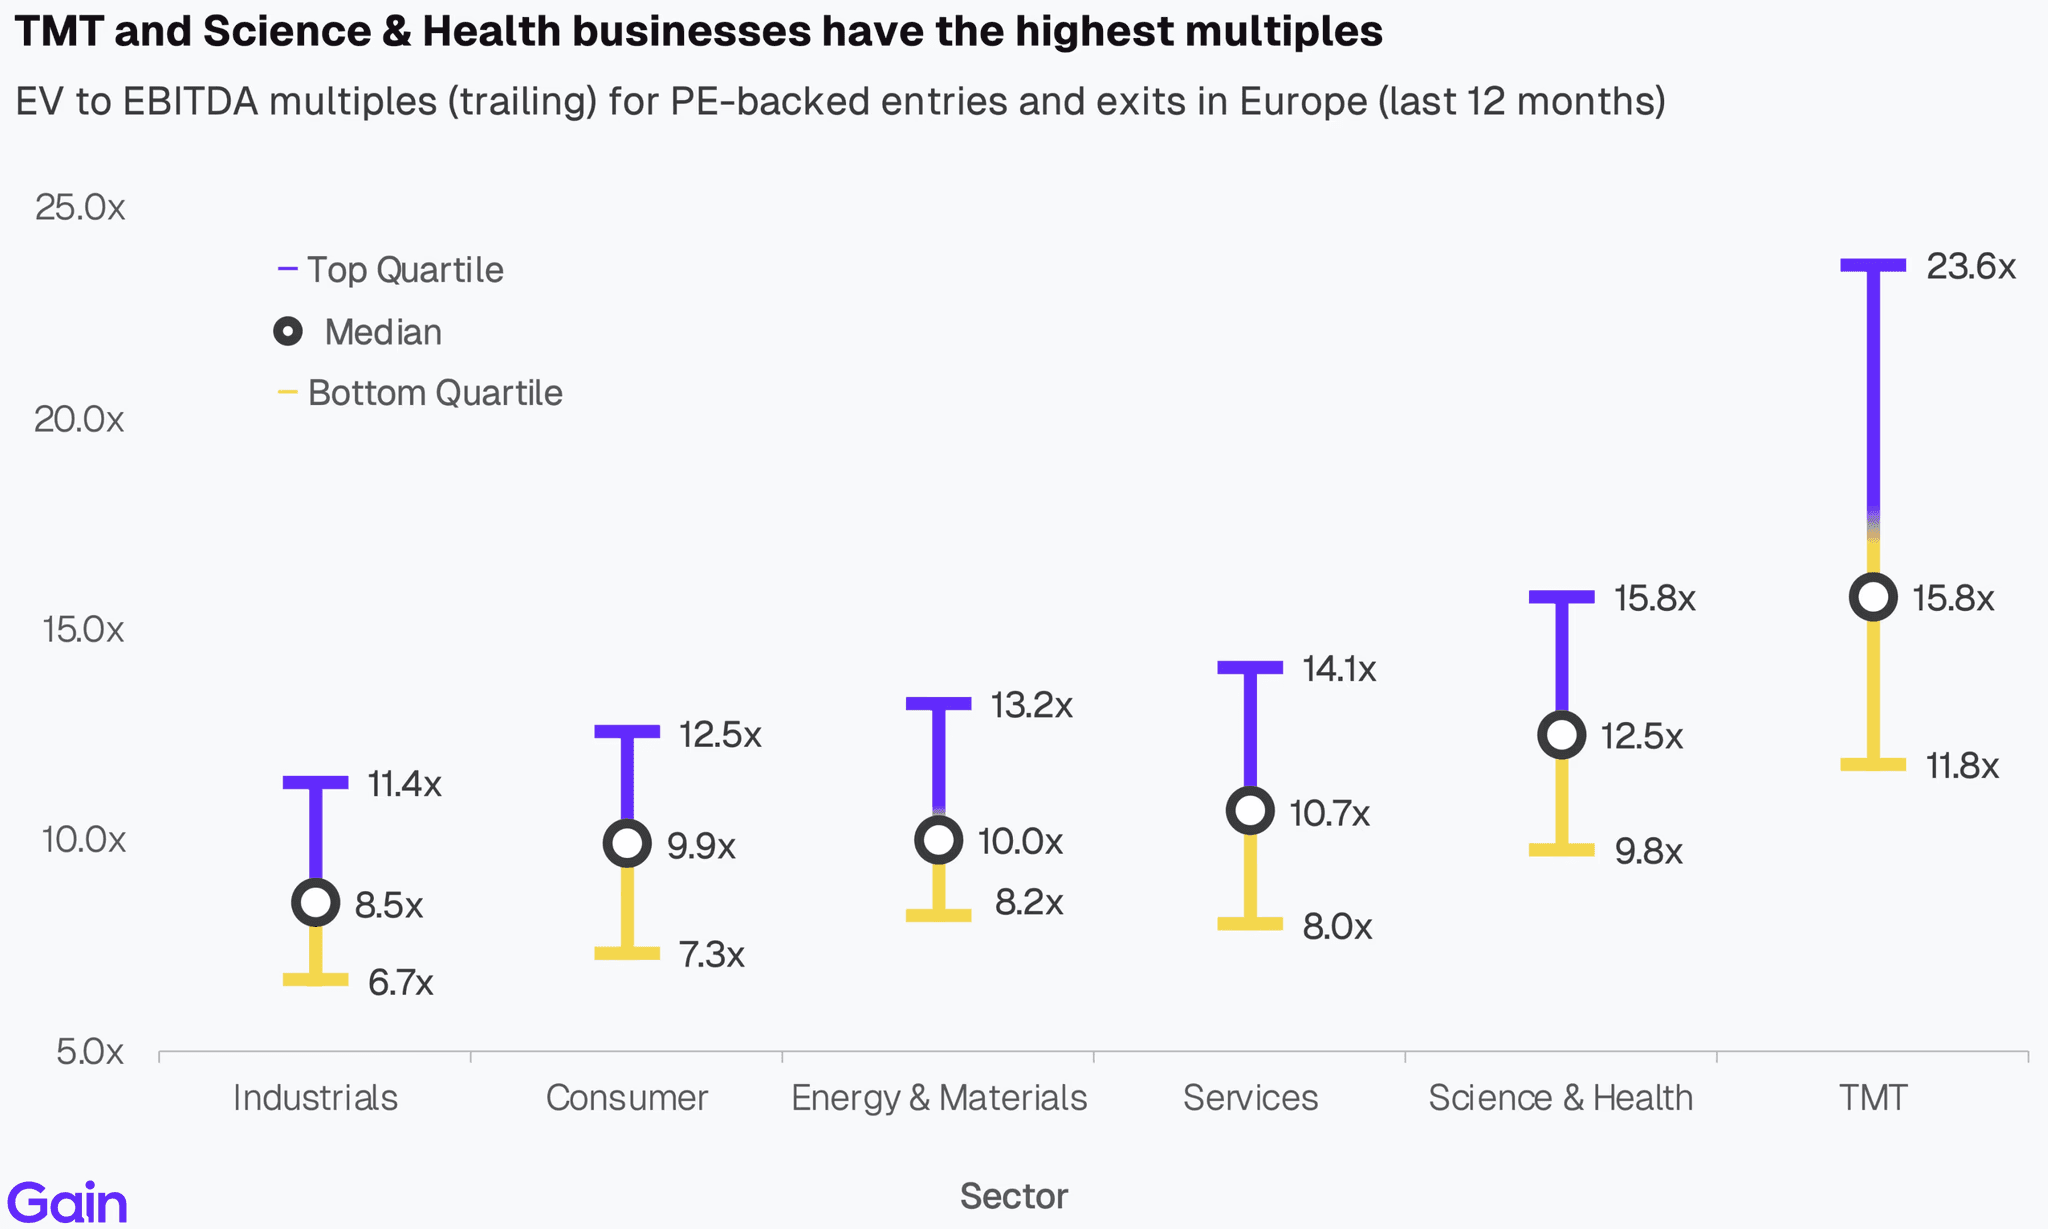
Multiples flatlined in 2025 (median of 10.7x). By sector, TMT and Science & Health commanded a healthy premium driven by higher growth rates.
If you have any questions about the data or the report, do not hesitate to reach out to insights@gain.ai.


Chapter 01: Entries
Overall Trend
PE entry activity made a comeback in 2025, up 8% year-over-year. After two subdued years, entries are now back to 2022 levels. Investors started to deploy more capital amid stabilizing financing conditions and mounting pressure to put dry powder to work given fund lifecycle dynamics.
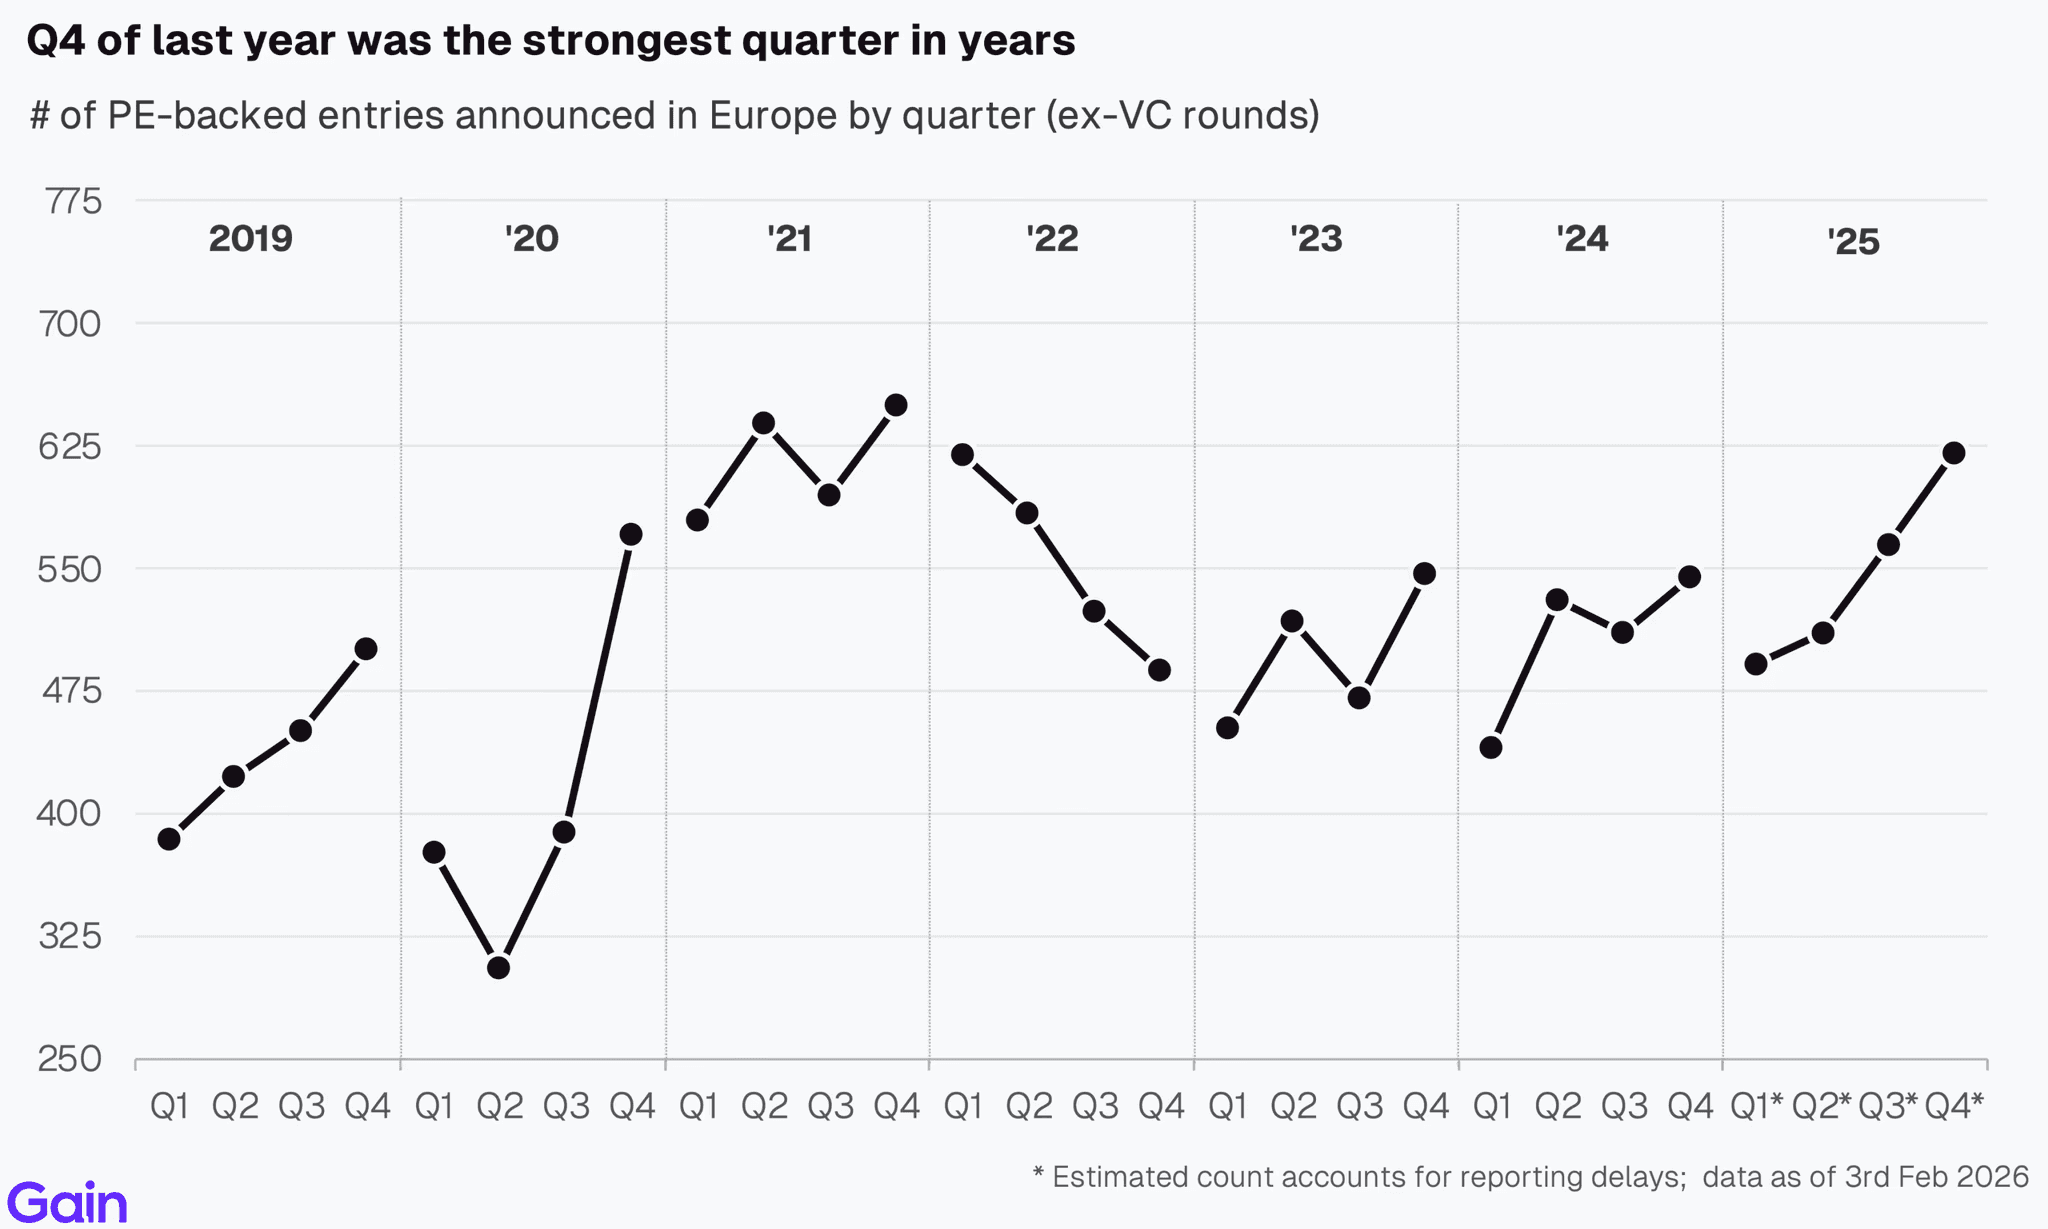
After a cautious Q1 held back by tariff and macro uncertainties, entries gained momentum in Q2-Q4. Q4 of last year was the strongest quarter on record in the last 3.5 years.
Entries by Deal Type
By deal type, sponsor-to-sponsor deals gained share. They accounted for 62% of PE entries over €10m in EBITDA, up from 57% in 2022. Broadly, family-to-sponsor deals remain more common in lower EBITDA ranges, while sponsor-to-sponsor deals, carve-outs and take-privates become more popular as target size increases.

Chapter 02: Exits
Overall Trend
Exit activity in 2025 was up 5% year-over-year. This marked the second consecutive year of improvement. IPO markets reopened, delivering a yoy increase in PE-backed public listings.
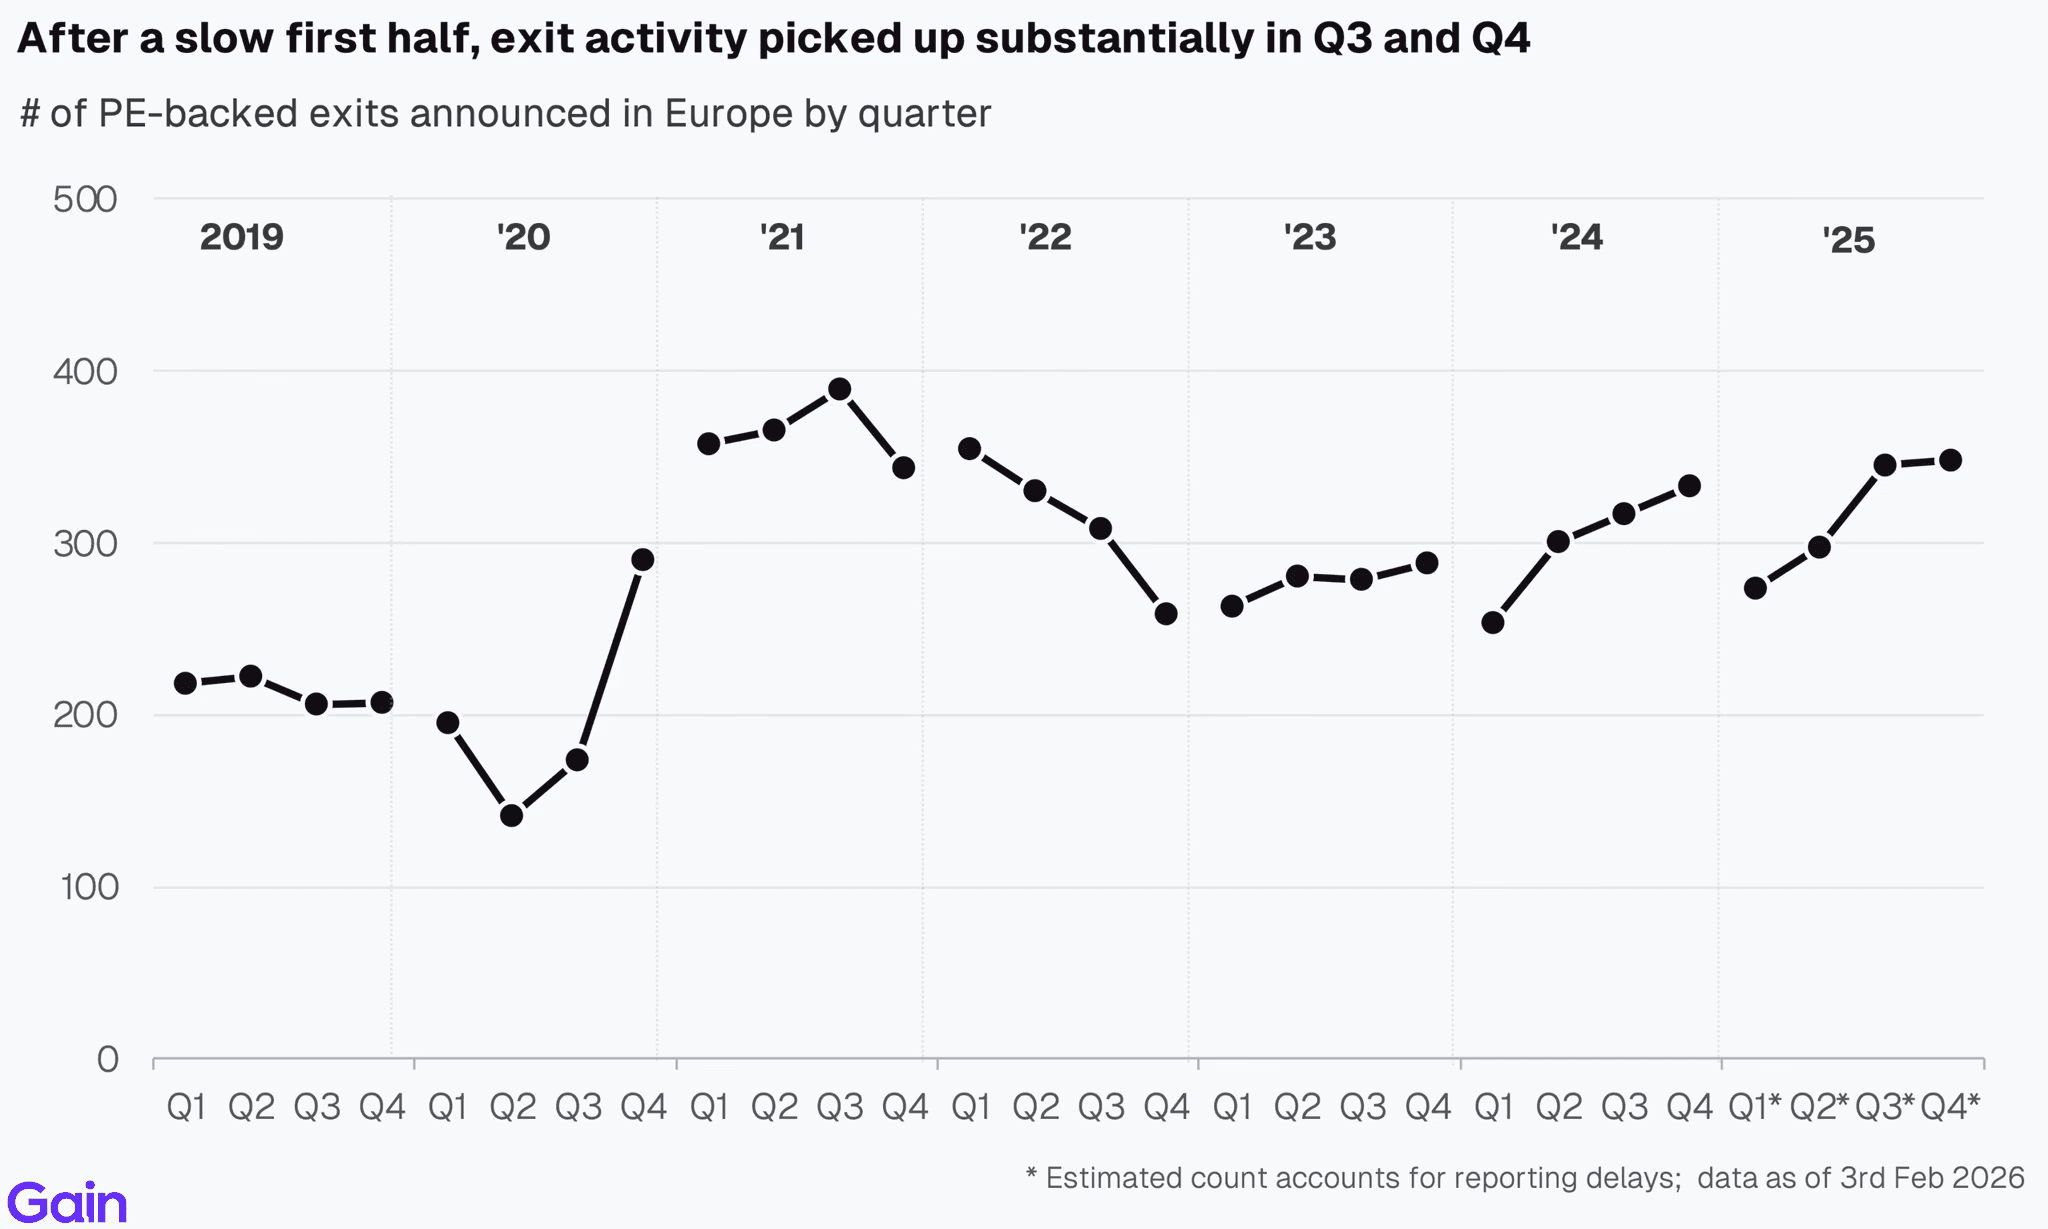
After a slow first half, exit activity picked up substantially in Q3 and Q4. The reopening of debt markets (across private credit and the broadly syndicated loan market), a modest valuation recovery and growing LP liquidity pressure prompted sponsors to prioritize exits.
Verisure's IPO was the largest PE-backed public offering in Europe ever. Other notable large exits included JDE Peets, MasOrange, Stada Group, Novo Banco and Swiss Market Place. By exit type, sponsor-to-sponsor transactions and strategic sales each accounted for 4 of the top 11 largest exits, while IPOs represented 3 deals.
Chapter 03: Buy-and-Build
Overall Trend
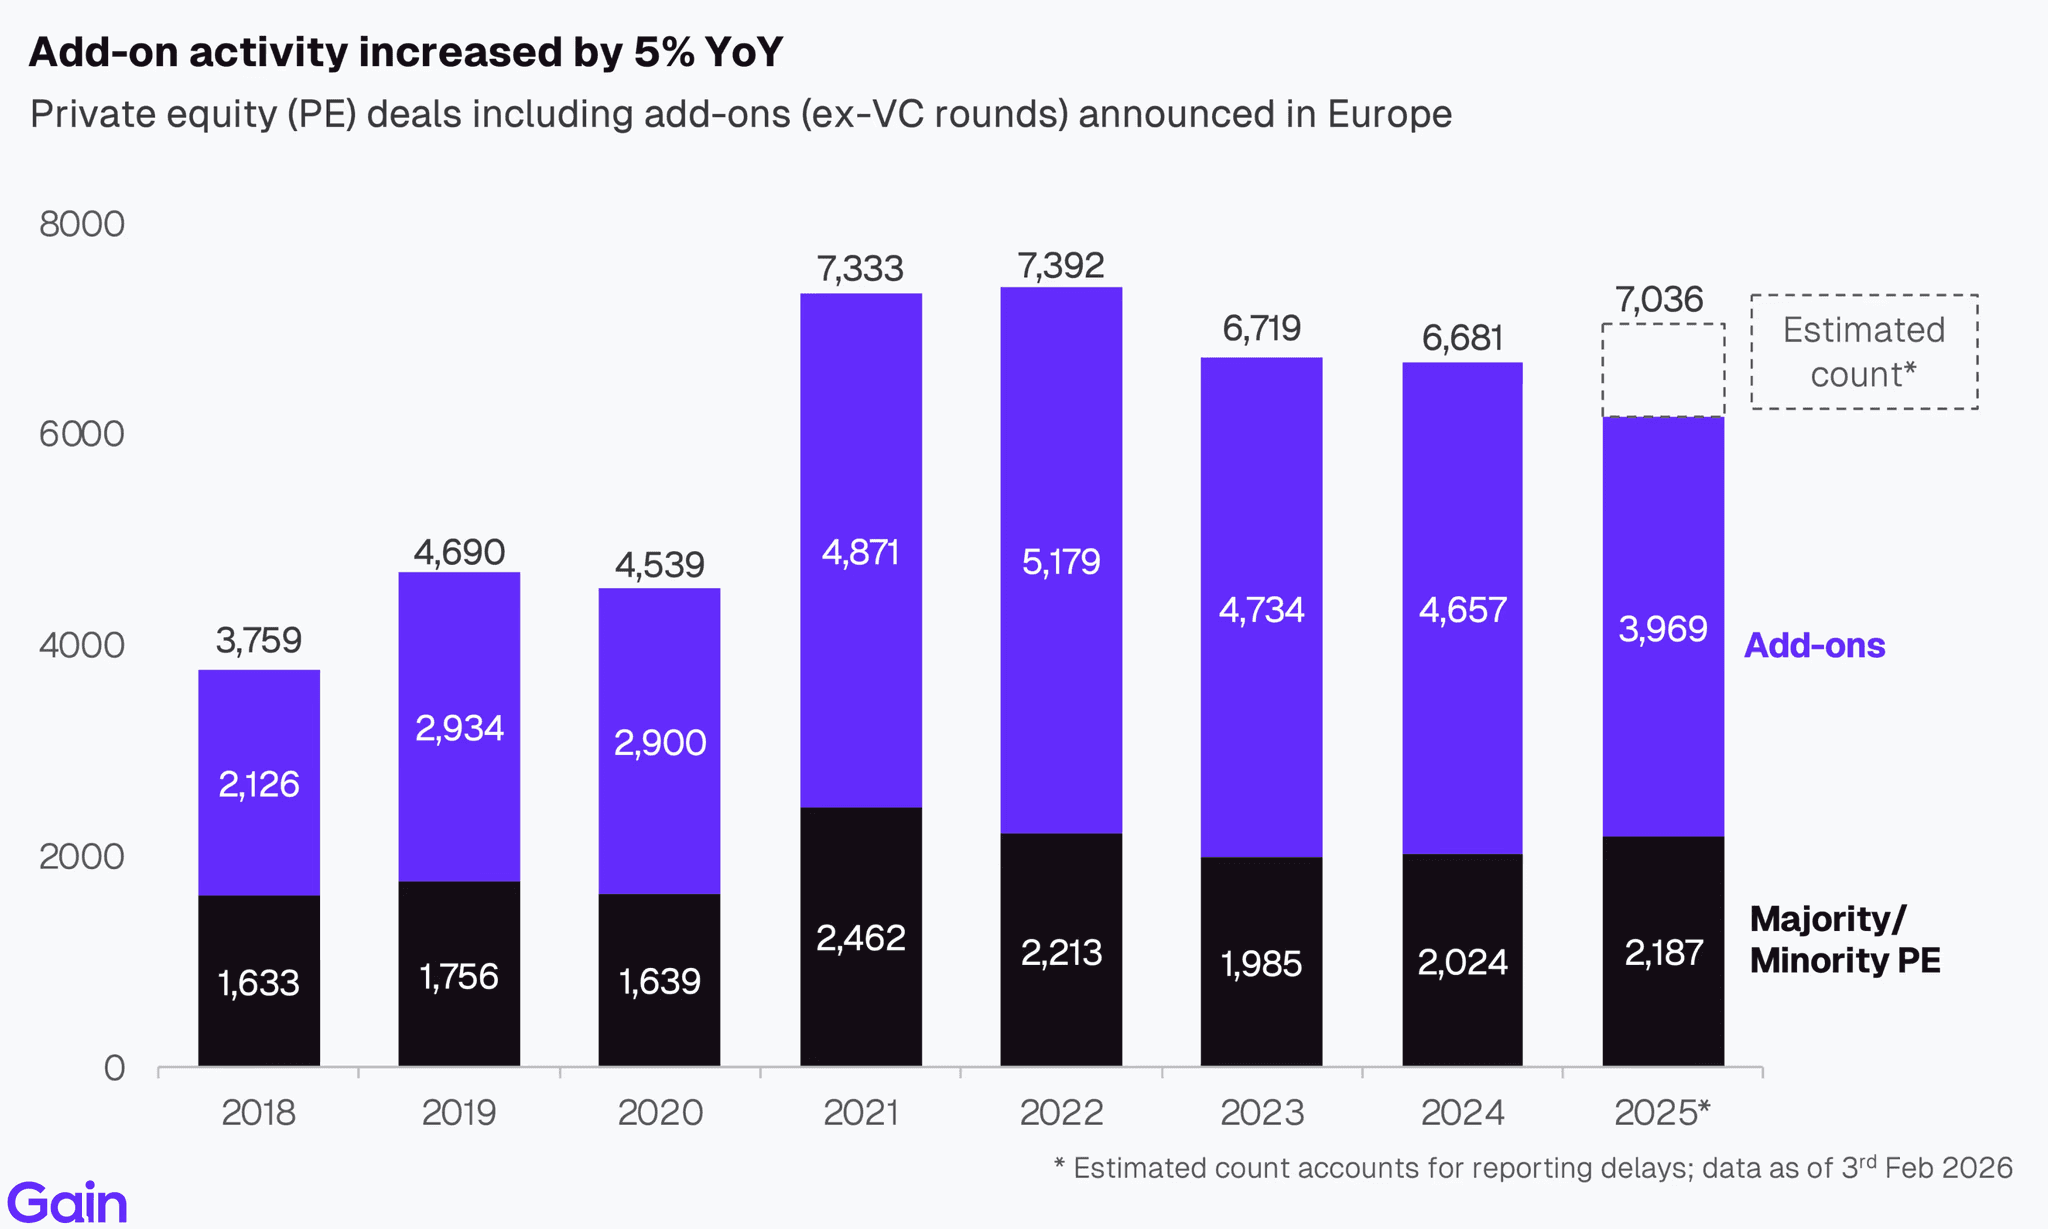
Add-on deal activity increased by 5% YoY. Amid a lacklustre exit environment, sponsors remained focused on portfolio value creation, with buy-and-build being the key strategy.
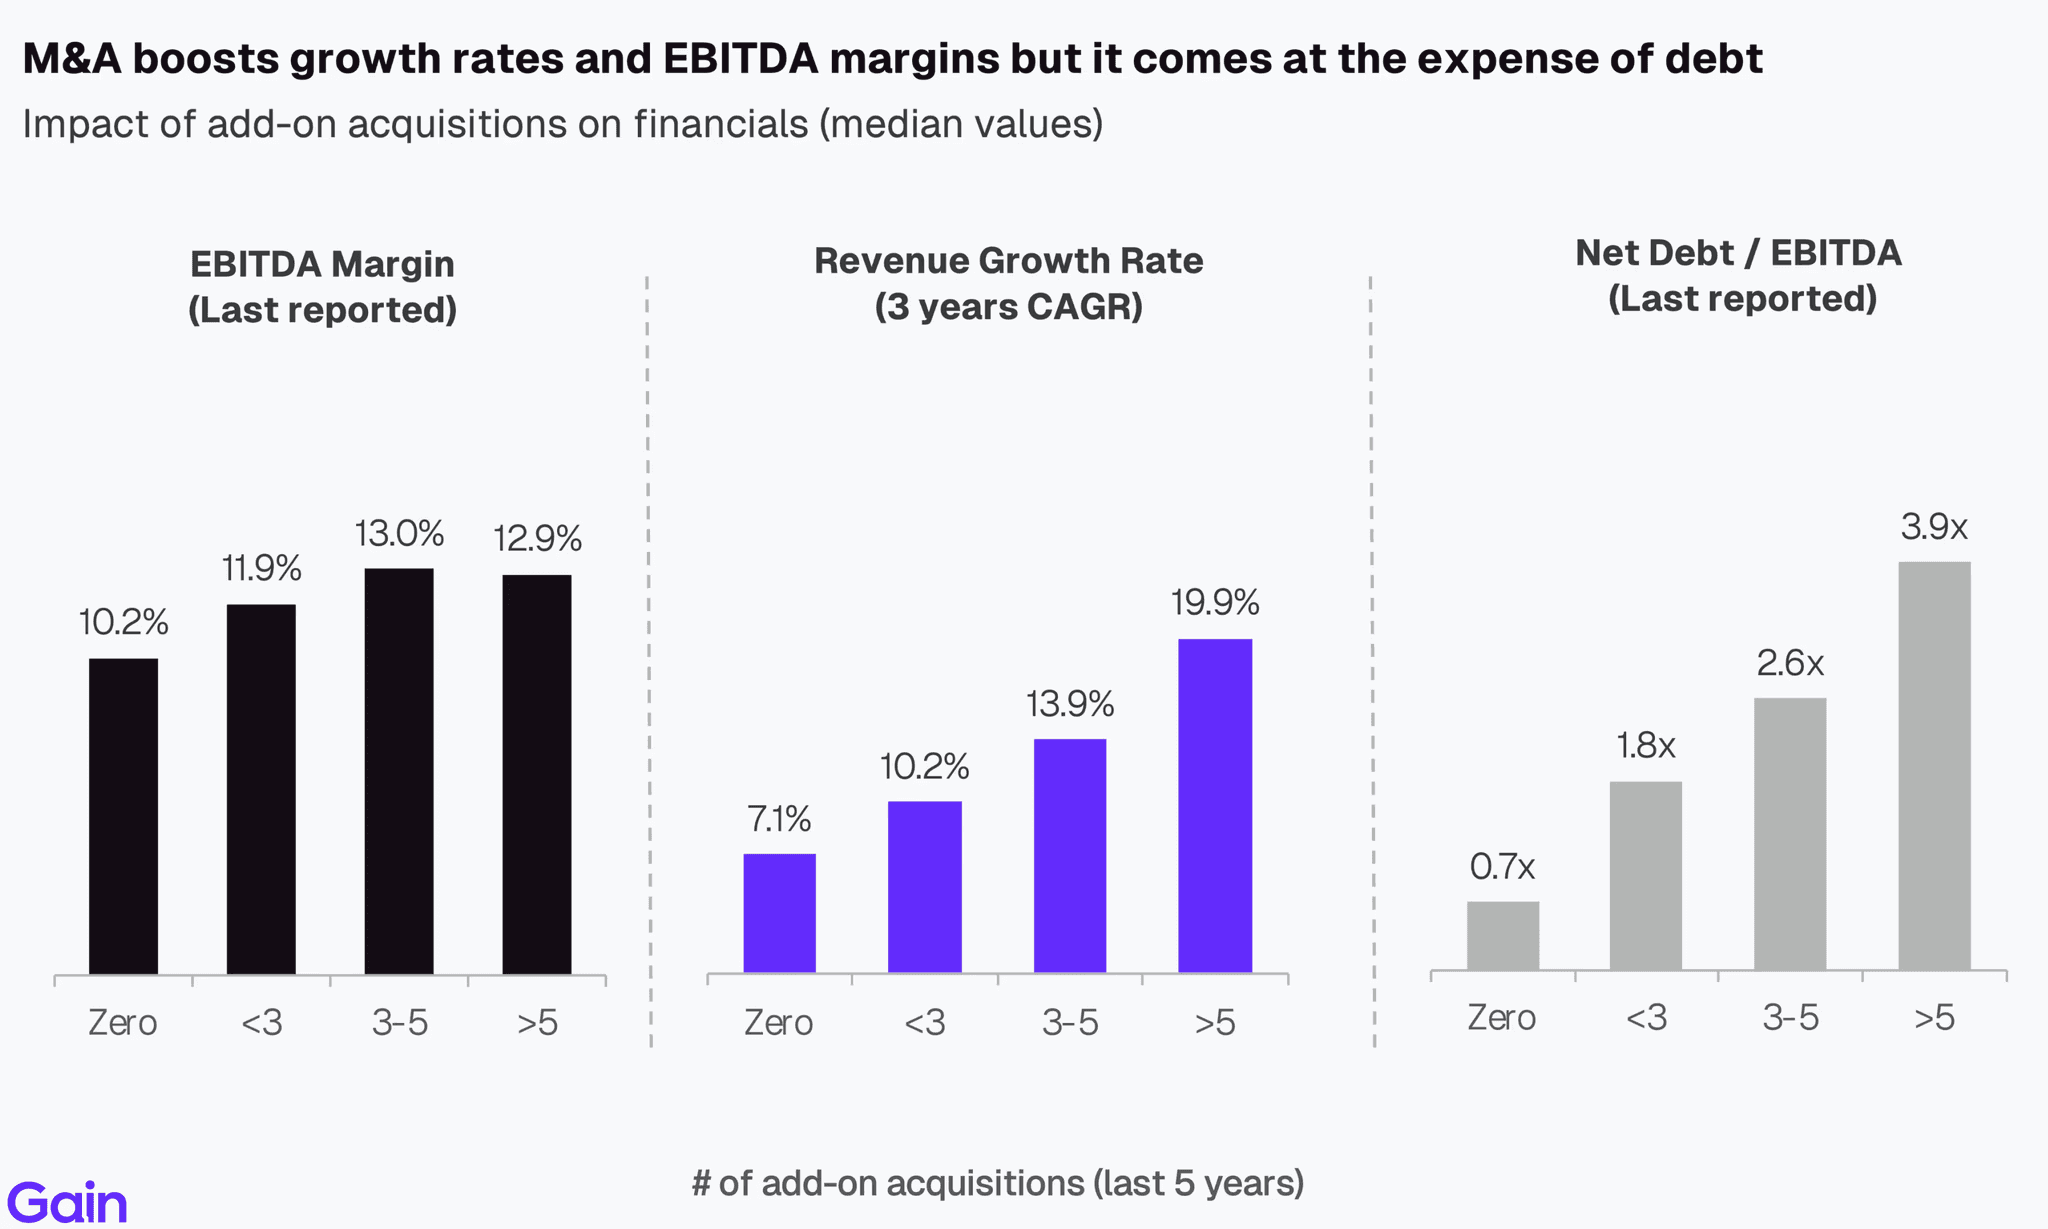
Add-ons can drive a lot of value by accelerating revenue growth and cost synergies. PE-backed businesses with over 5 acquisitions grew at a 5-year CAGR of 20% compared to 7% for businesses with no acquisitions. These businesses also benefit from improved margins. However, we do see an increase in debt to finance those acquisitions, which increases the overall risk profile of the investment.
Despite the merits, add-on activity as a % of total PE deal activity has declined marginally in the last few years. The recent narrowing gap between add-ons and platform multiples, integration challenges and higher financing costs have tempered further growth.
Chapter 04: Multiples
Overall Trend
Median PE multiples flatlined in 2025 (10.7x). We don’t expect a multiple recovery in 2026 as interest rates remain elevated and buyer competition remains limited.
By sector, TMT (15.8x) and Science & Health (12.5x) continue to command a healthy valuation premium over other sectors. This is supported by strong growth, attractive margins and greater resilience. In contrast, sectors such as Industrials and Consumer trade at significantly lower multiples, reflecting slower growth profiles and the more cyclical nature of earnings.
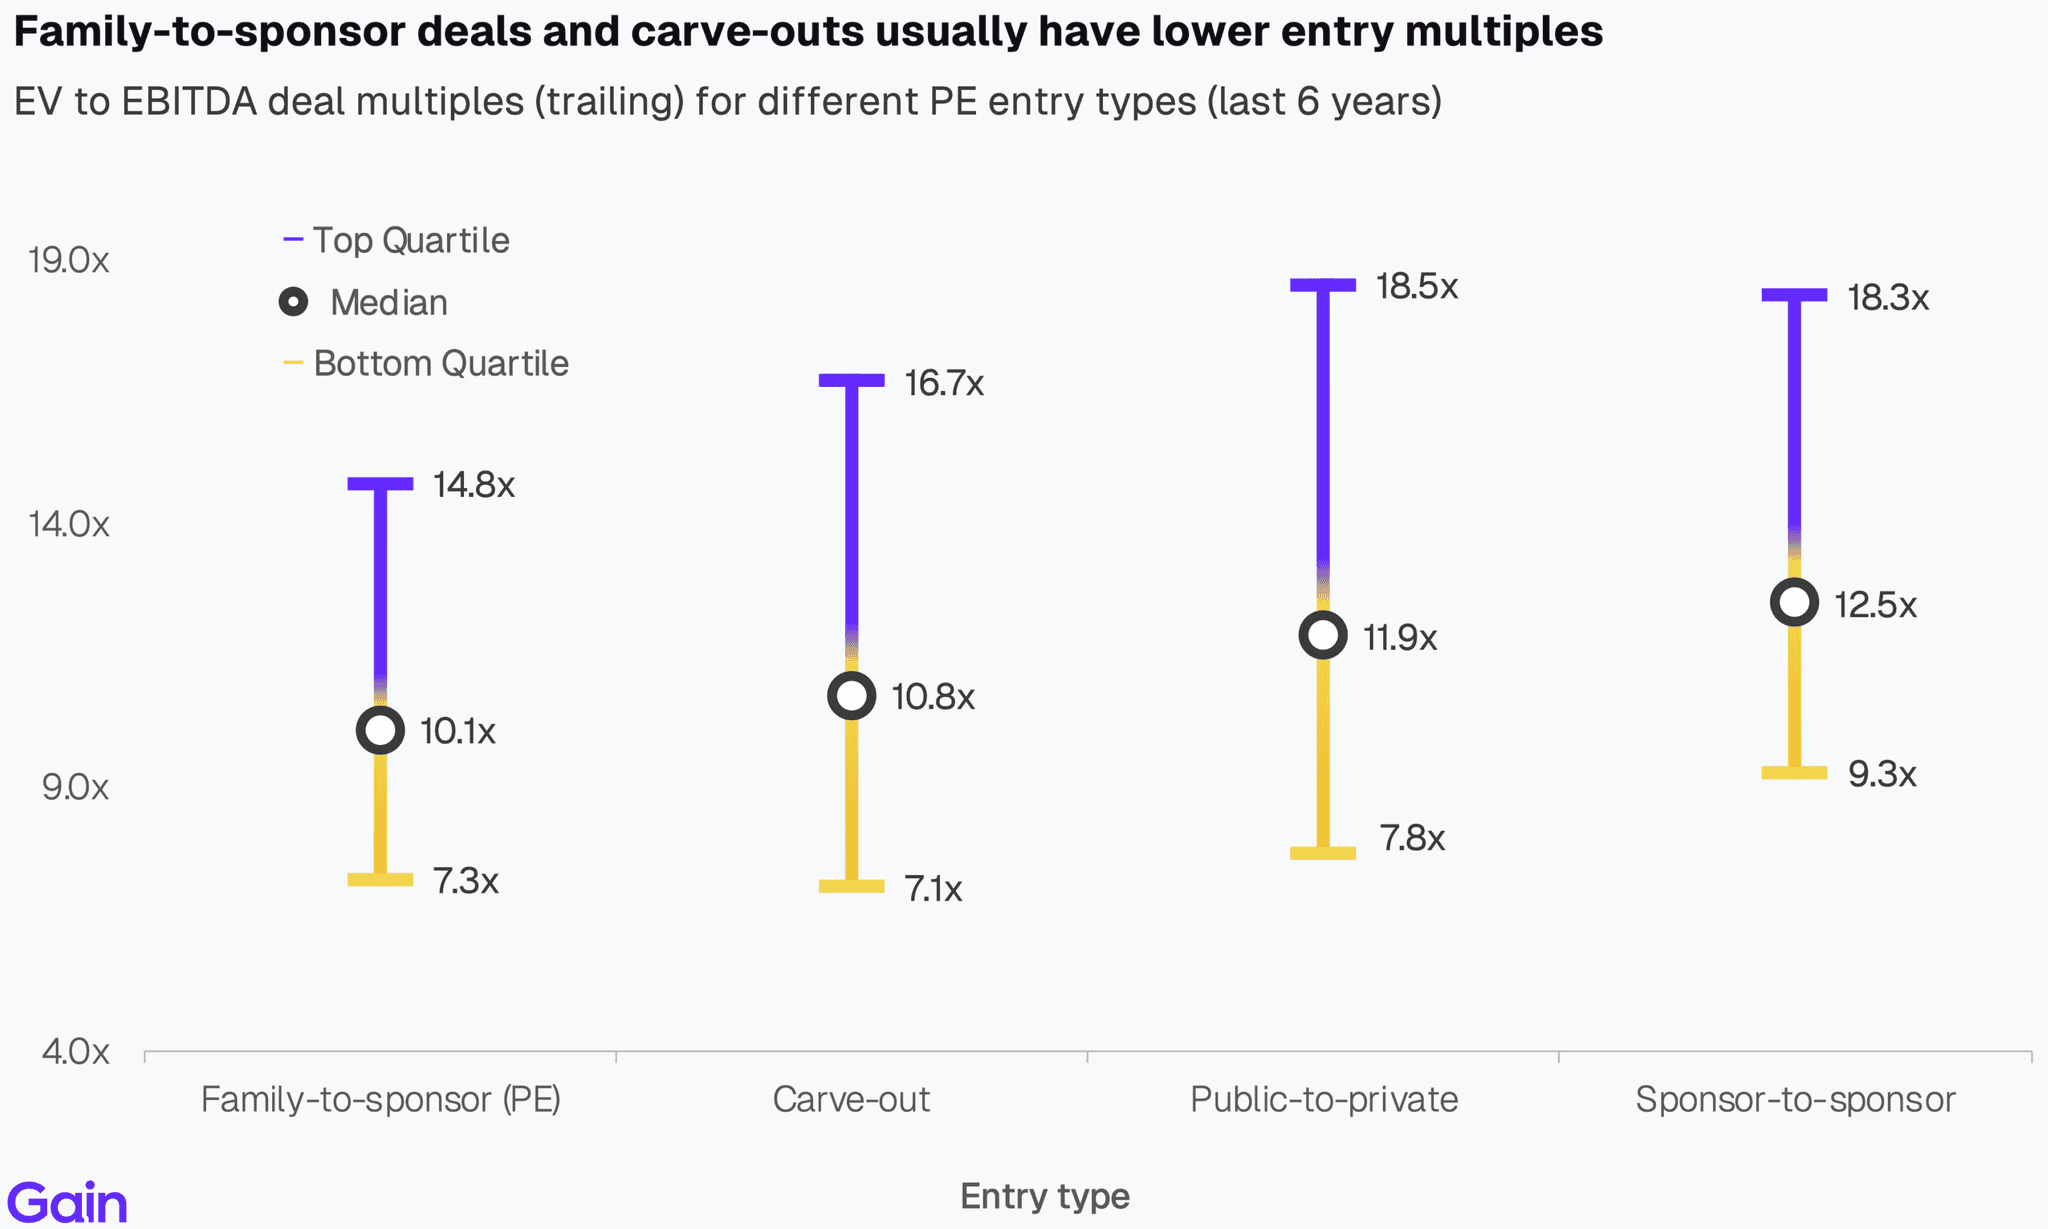
By entry type, family-to-sponsor deals have the lowest entry multiples. These businesses are often younger and aren’t yet operating at scale. Carve-outs also tend to have lower multiples, as they tend to be underperforming and need investment to build up all support functions post-acquisition. In contrast, multiples are highest in the sponsor-to-sponsor market, often driven by competitive dynamics and streamlined processes.
Chapter 05: Growth & Margin
Revenue Growth
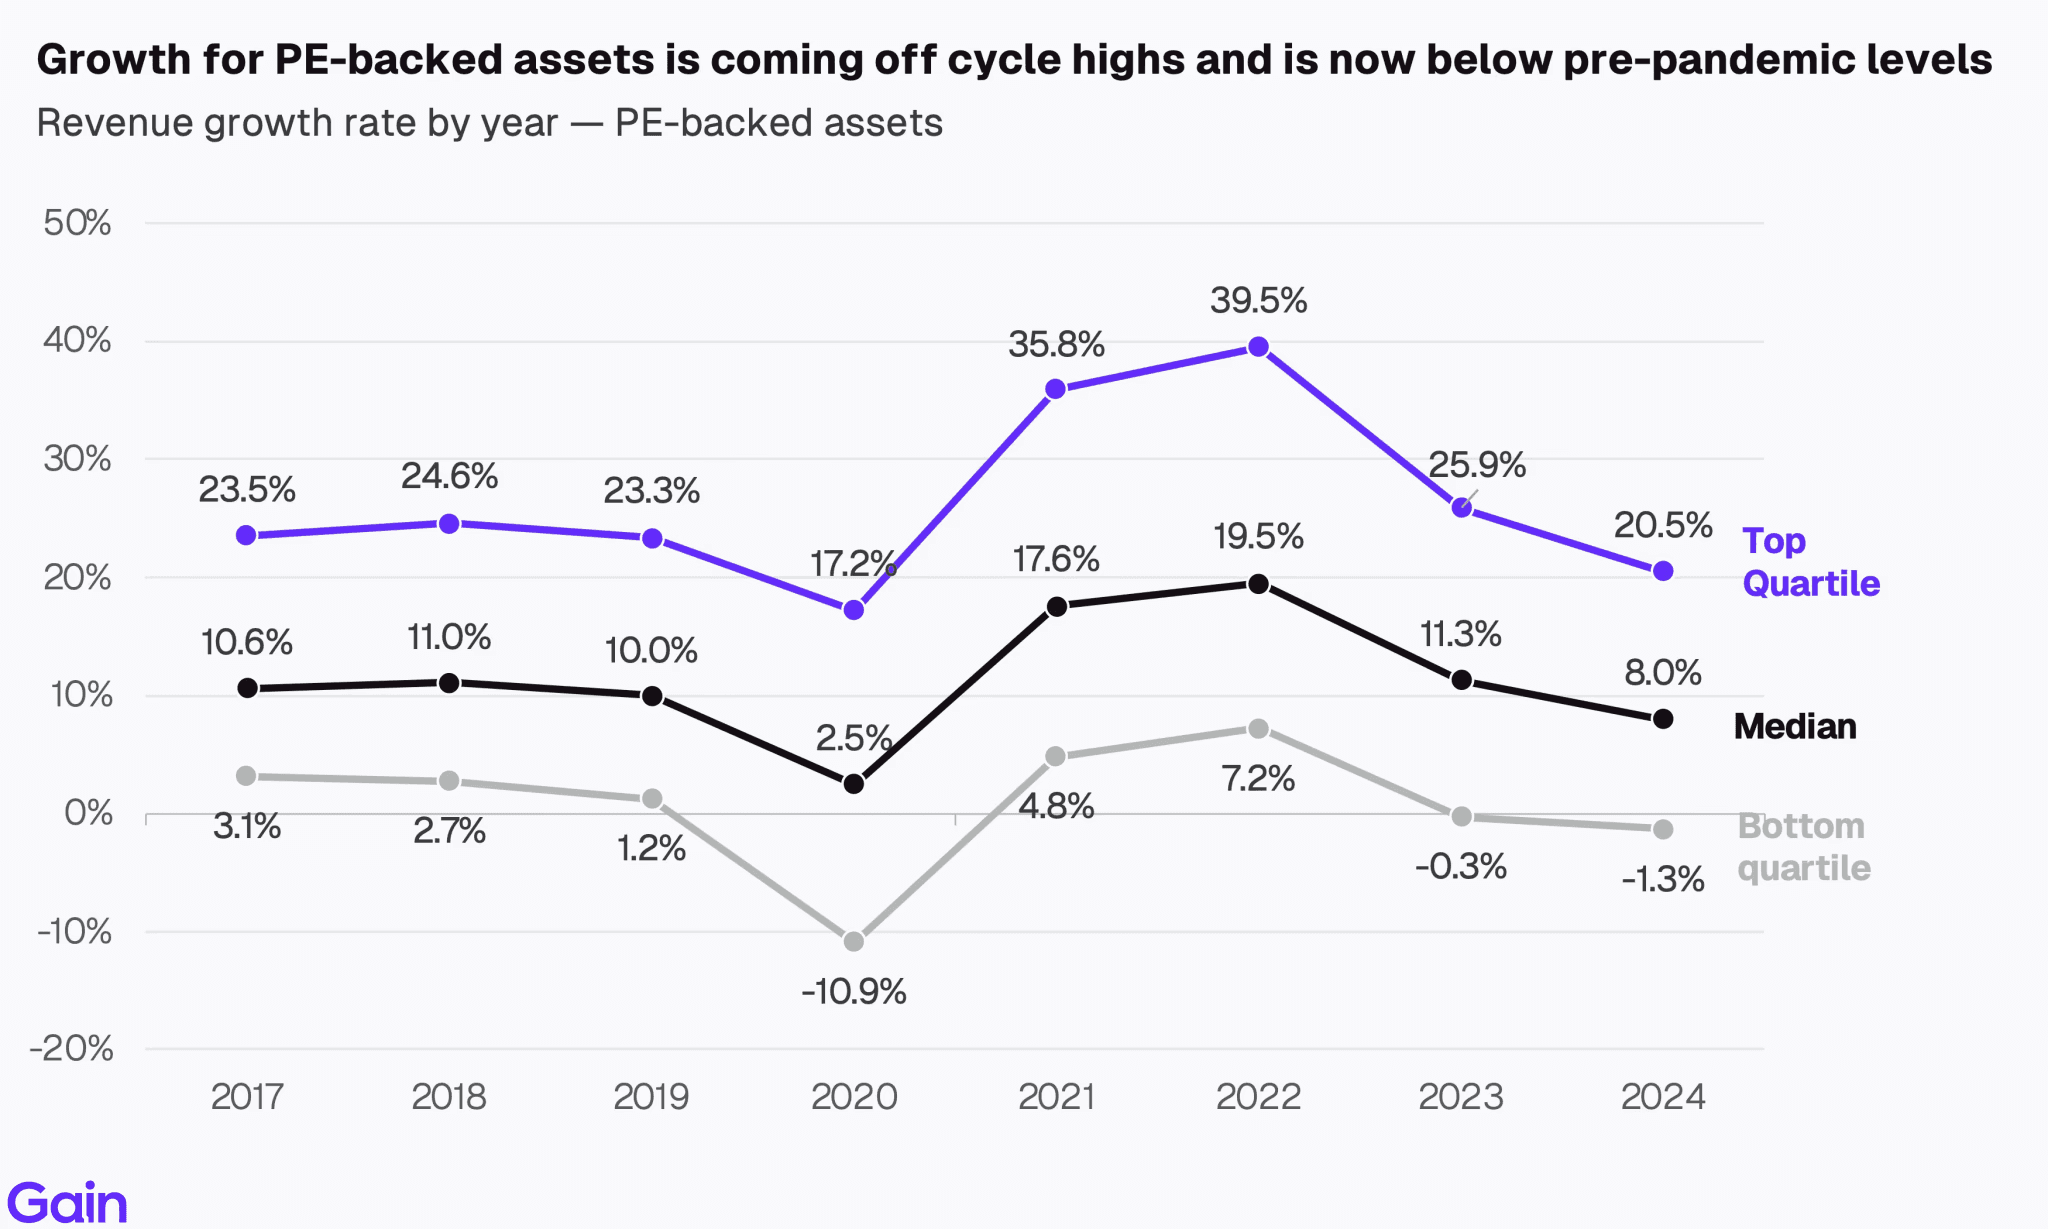
Growth for PE-backed assets is coming off cycle highs and is now below pre-pandemic levels. The median PE-backed business grew 8.0% in 2024, down from 11.3% in 2023 and 19.5% in 2022, and below the 10.0% level seen in 2019. Higher input and energy costs, trade tariffs, and muted domestic demand put downward pressure on growth. Year-over-year comparisons were also challenging, on the back of three years of strong growth. Given how crucial growth is to PE value creation, any further weakening could dampen PE returns and limit exit oppurtunities.
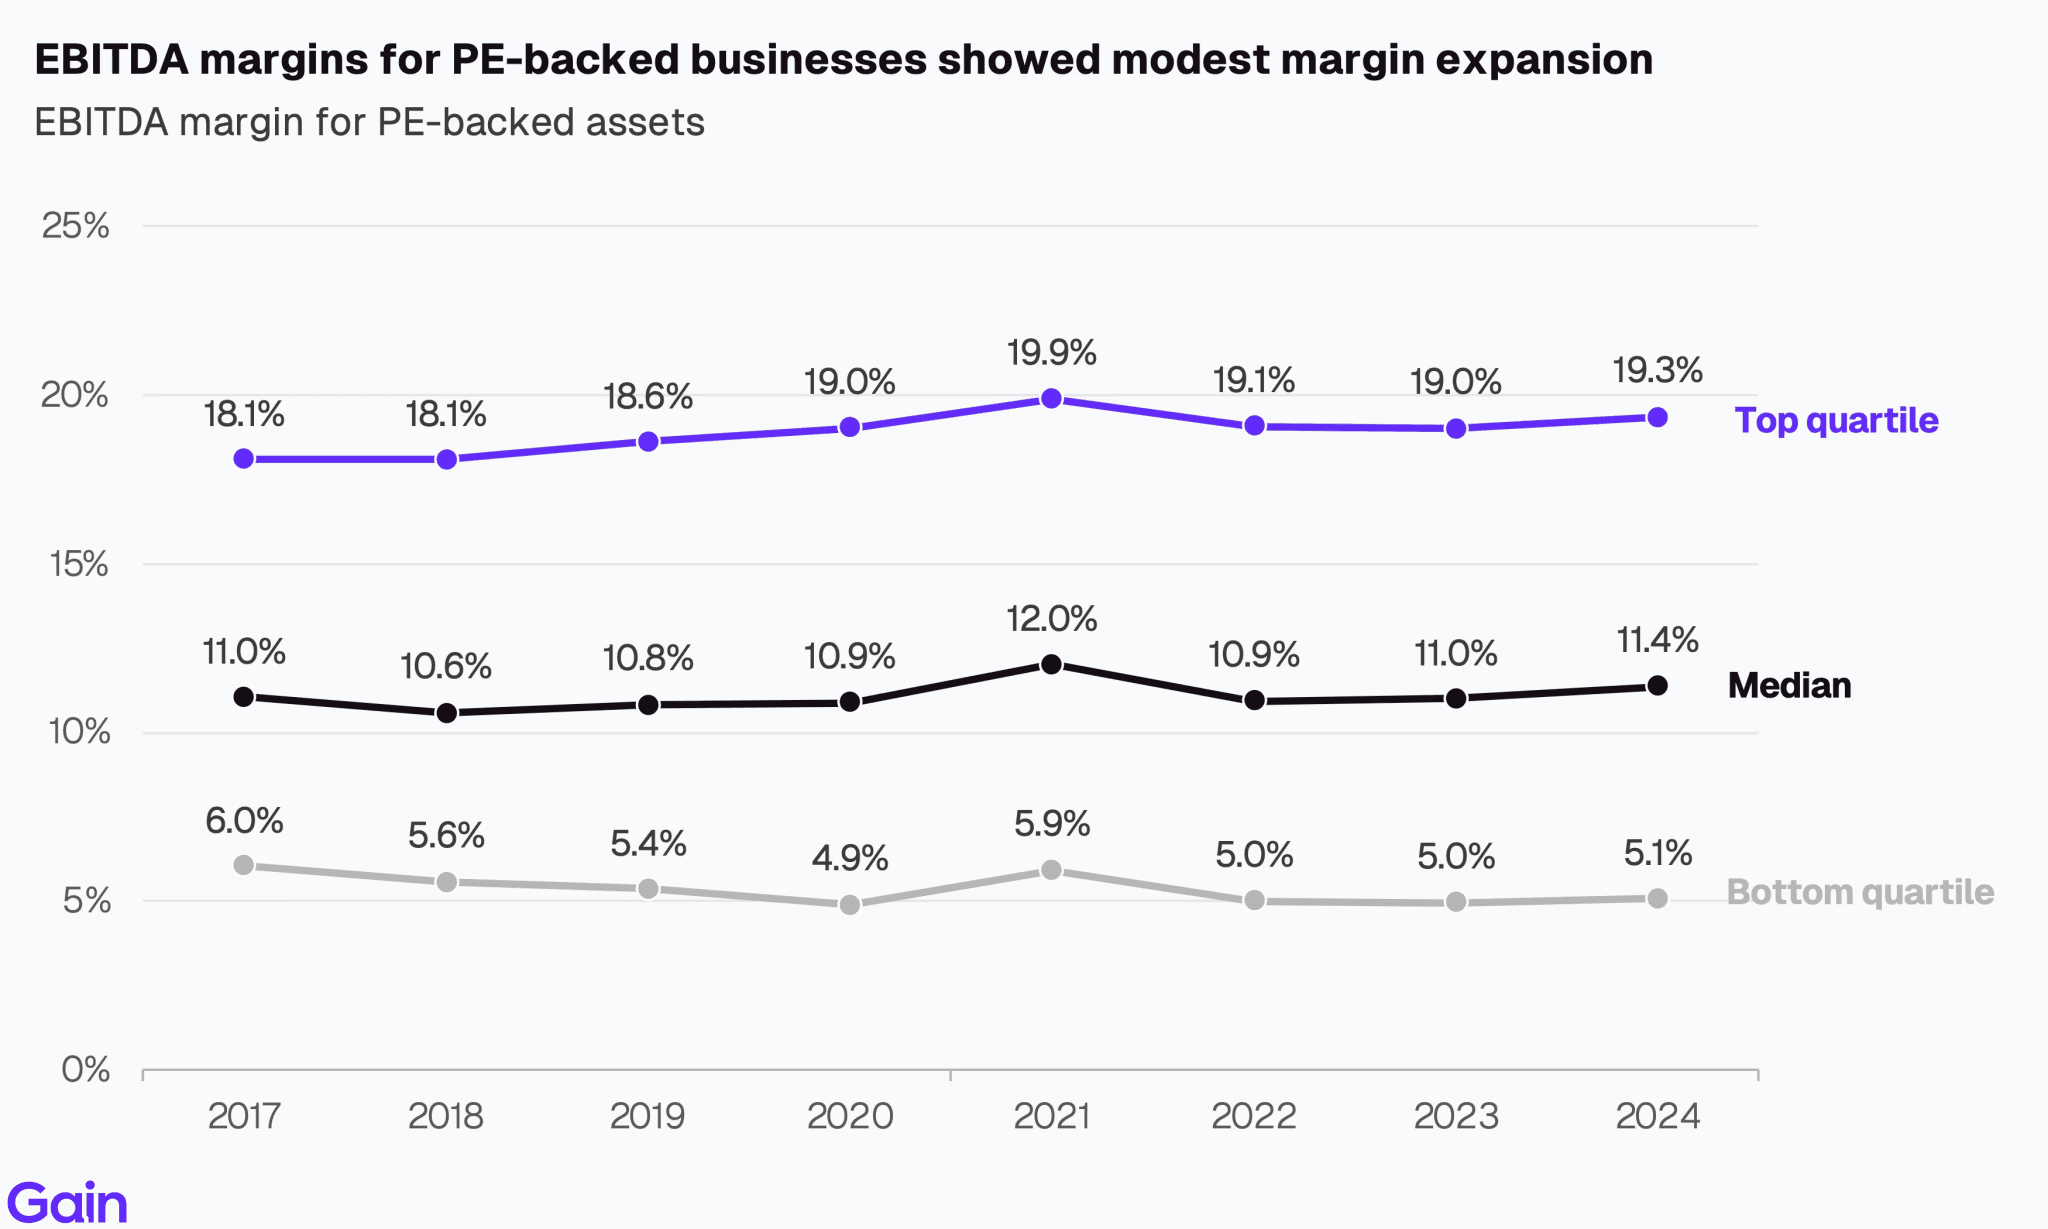
EBITDA Margins
EBITDA margins for PE-backed businesses have remained stable over the years. This is consistent with our analysis, which shows expansion contributes only little (14%) to PE value creation.
Related Research
Discover our proprietary reports on investors, assets and PE deals.