The Global 400
Ranking the largest private equity investors in the world
2026 Edition

Executive Summary
In this report, we rank and analyze the largest and most active private equity (PE) investors across the world.
We take a novel bottom-up approach to our ranking, which is based on total managed enterprise value (EV) rather than funds raised. This methodology allows us to go deeper into trends by region and sector.
Further, this approach helps us capture large and active investors who do not follow traditional fundraising cycles/structures and are often overlooked.
Key takeaways from our analysis:
Blackstone has emerged as #1 PE investor globally, managing a total estimated EV of $366bn, followed by KKR (managing an EV of $343bn) and EQT ($195bn). Other investors in the top 10 include Apollo ($178bn), Bain Capital ($152bn), Brookfield AM ($150bn), Thoma Bravo ($140bn), CVC ($135bn), GIC ($135bn), and Carlyle ($125bn).
Collectively, the largest 400 investors in the world manage an estimated EV of $8.1 trillion across 13,070 assets. Despite its significant size, the aggregated Global 400 EV is just 5% of the ~$149 trillion global public equity market.
The Global 400 landscape is heavily concentrated at the upper end, with the top 25 investors managing 44% of the Global 400 EV. TMT is the largest PE sector in the world (24% of Global 400 EV), followed closely by Services (19%) and then Consumer (11%).
Leading the sector rankings are Thoma Bravo (TMT), Blackstone (Services & Infrastructure), EQT (Science & Health), KKR (Energy & Materials), Apollo (Industrials), Stone Point Capital (Financial Services), and Roark Capital (Consumer). TMT (42%) and Consumer (25%) stand out as the sectors with the most number of sector specialists.
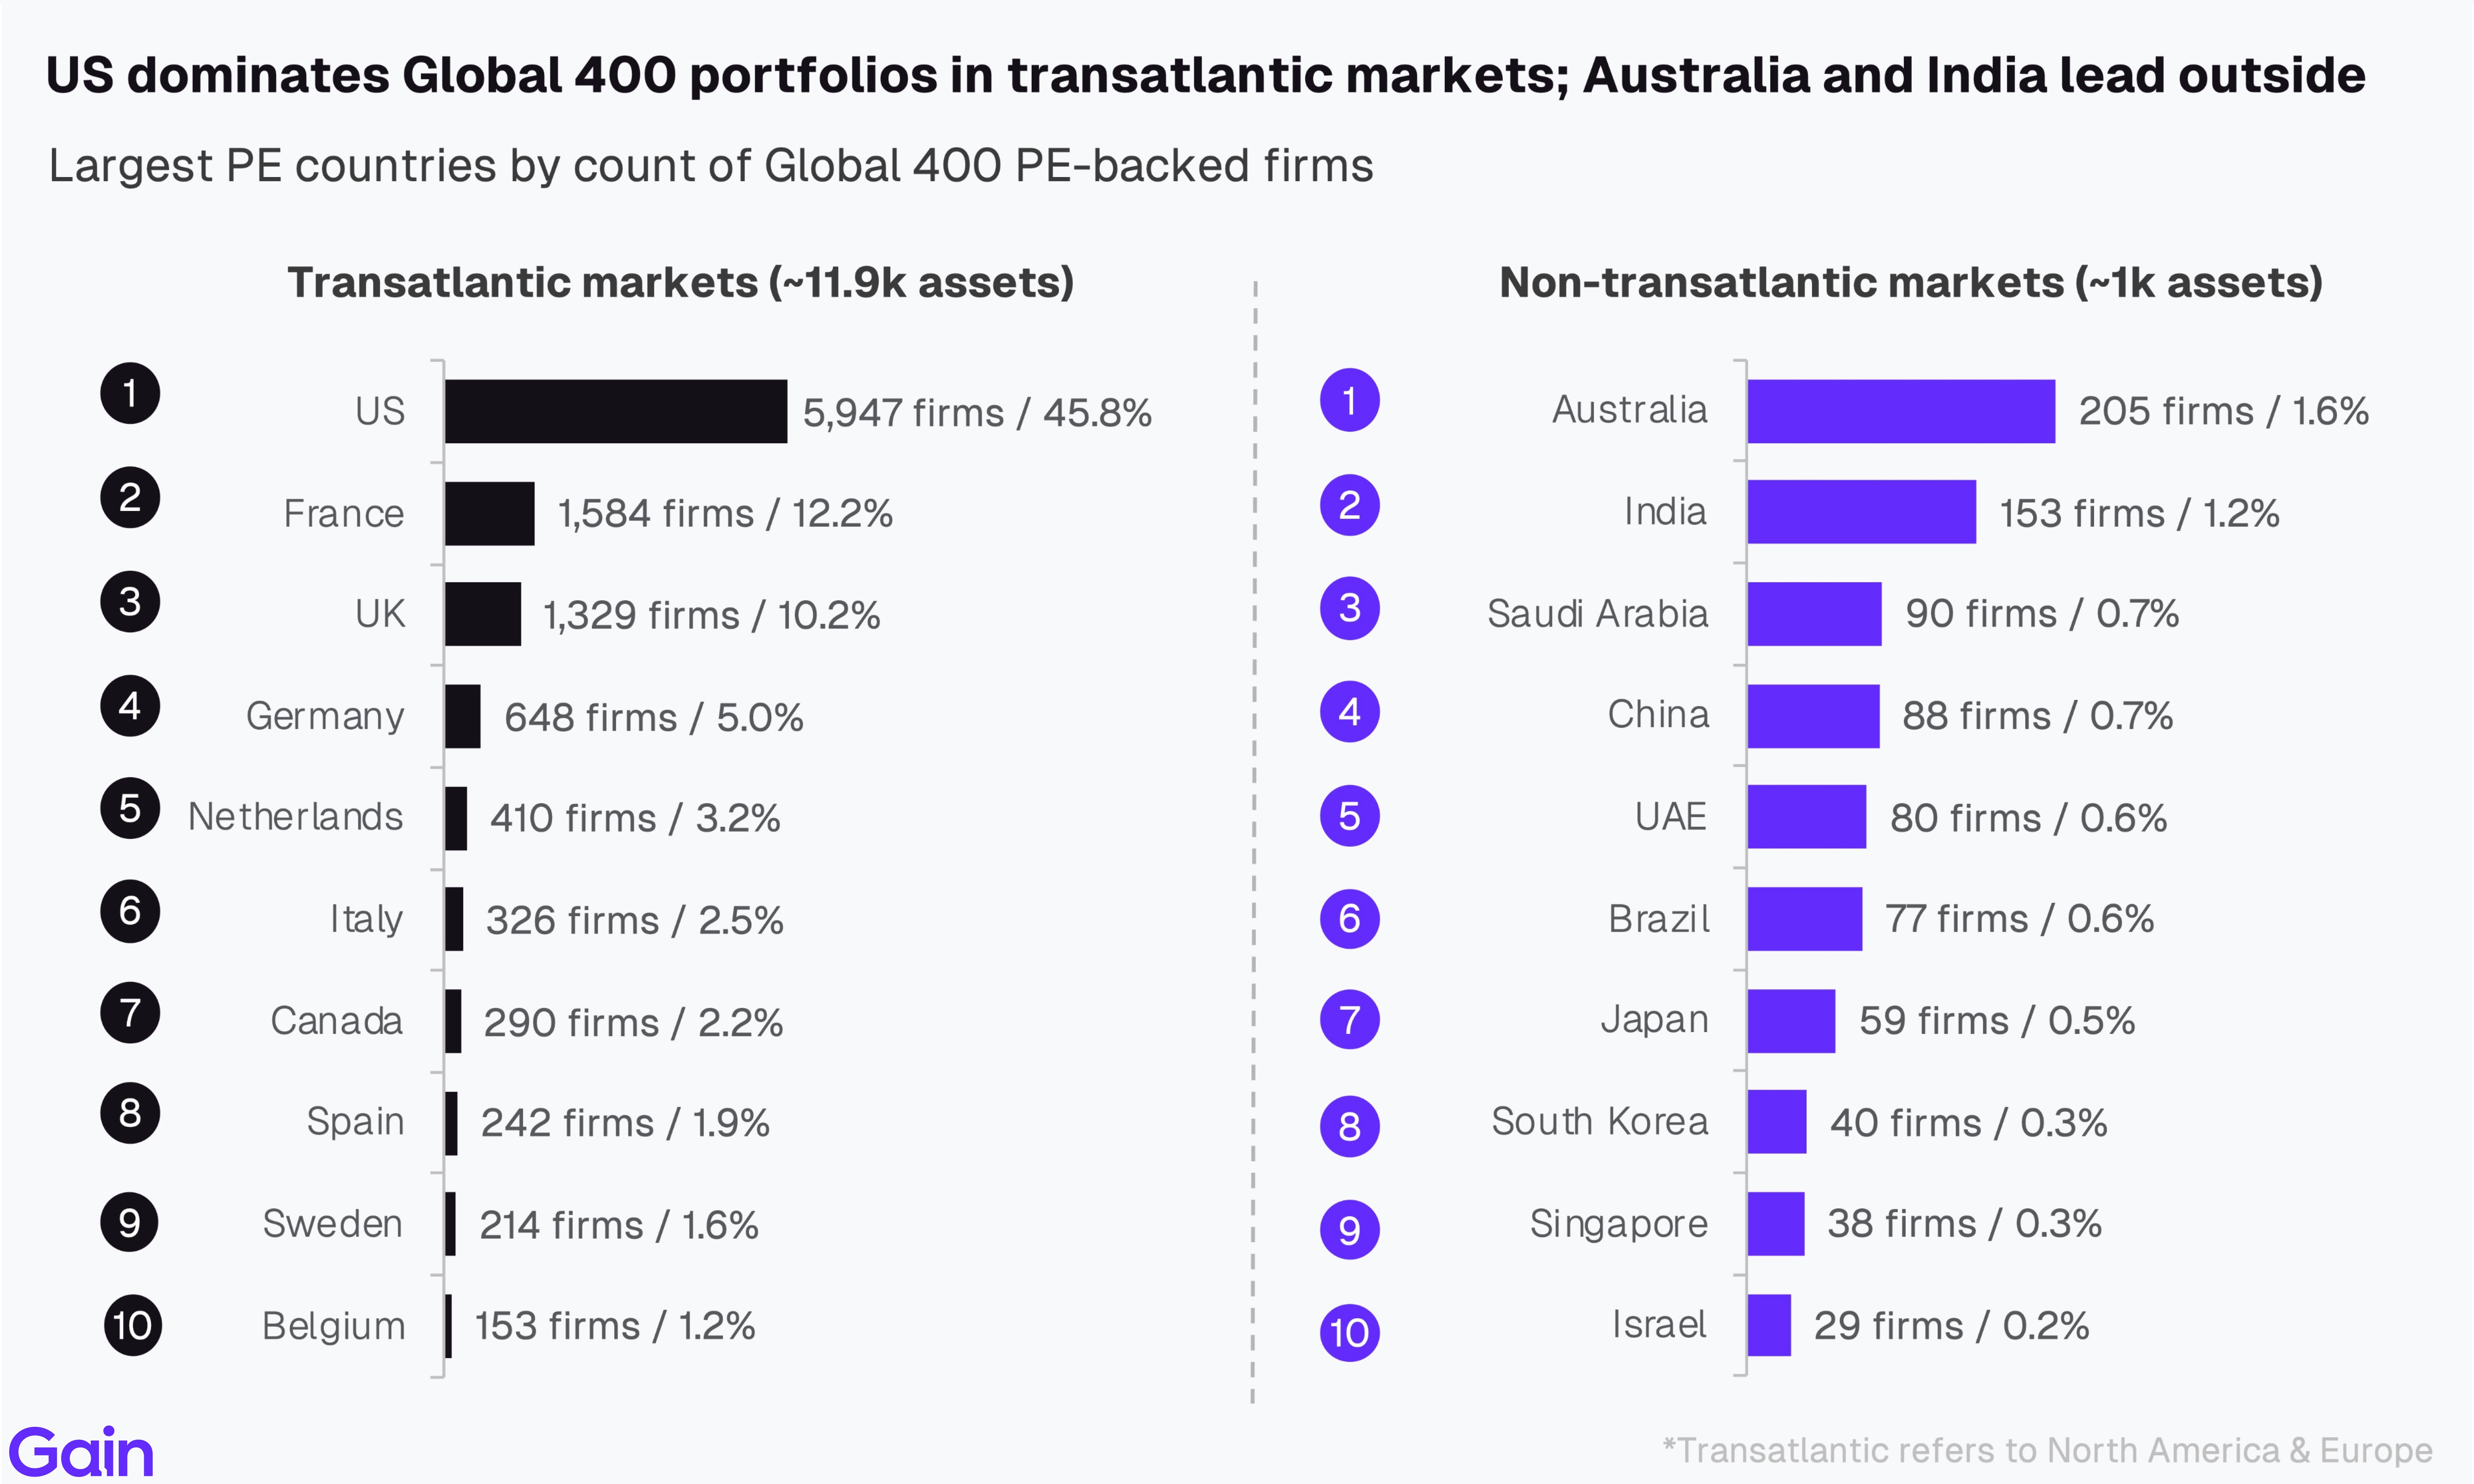
The US overwhelmingly dominates transatlantic PE markets, accounting for 50% of Global 400 PE-backed companies, well ahead of France (13%) and the UK (11%). Outside transatlantic markets, Australia and India host the largest share of Global 400 portfolio companies, followed by Saudi Arabia and China. By city, London, Paris, and New York are the largest hubs.
If you have any questions about the data or the report, reach out to insights@gain.ai.
Authors


Chapter 01: Global 400 Ranking
Blackstone has emerged as the largest private equity investor globally, managing a total estimated EV of $366bn, followed by KKR (managing an EV of $343bn) and EQT ($195bn).
Other investors in the top 10 include Apollo ($178bn), Bain Capital ($152bn), Brookfield Asset Management ($150bn), Thoma Bravo ($140bn), CVC ($135bn), GIC ($135bn), and Carlyle ($125bn).
Collectively, the largest 400 investors manage an estimated EV of $8.1 trillion globally across 13,070 assets. On average, their portfolio companies generate $89m in EBITDA, while they manage 41 companies each.
Over the last 6 years, Global 400 investors have invested in over twice as many new portfolio companies as they have exited. Specifically, there have been 12,293 new investments and 5,839 exits among these sponsors.
The table below lists all the top 400 investors in the world. Use the search bar or the arrows at the top to navigate through the ranking.
North American HQ'd investors account for 32 of the top 50 spots in the Global 400 ranking, led by Blackstone (#1, $366bn) and KKR (#2, $343bn). Europe has 11 investors in the top 50, with EQT (#3, $195bn) and CVC (#8, $135bn) being the highest ranked. The Middle East has 4 investors, all sovereign wealth funds, led by PIF (#14, $95bn). Australia/NZ and Asia contribute two and one investors respectively, with GIC (#9, $135bn) being the sole Asian representative in the top 50.

Investor Concentration
The Global 400 landscape is heavily concentrated at the upper end. The top 25 investors manage 44% of total EV ($3,309bn), with concentration rising to 74% ($5,602bn) for the top 75. Private equity firms, like other large asset managers, benefit from inherent scale advantages, and recent fundraising trends have also favored larger investors. While concentration is increasing in PE, the market still remains less concentrated compared to public asset management or the advisory landscape.

Despite its significant size, the global private equity market remains small compared to the global public equities market. Global 400 investors manage $8.1tn in EV — yet this represents just 5.5% of the ~$149 trillion global public equity market. The top 10 listed companies alone have a combined EV of $29.3tn, nearly 4x the entire Global 400 EV.

Dominant Investor HQs
By country, US and UK HQ'd investors dominate the Global 400 ranking. US-headquartered investors manage $4,950bn in EV (61%) versus $881bn (11%) for UK peers. French and Canadian investors come next at $410bn and $380bn, respectively, representing roughly 5% of total EV each. Outside of the leading Western countries, the UAE ($228bn), Singapore ($187bn), and Australia ($162bn) stand out as the largest investor hubs.
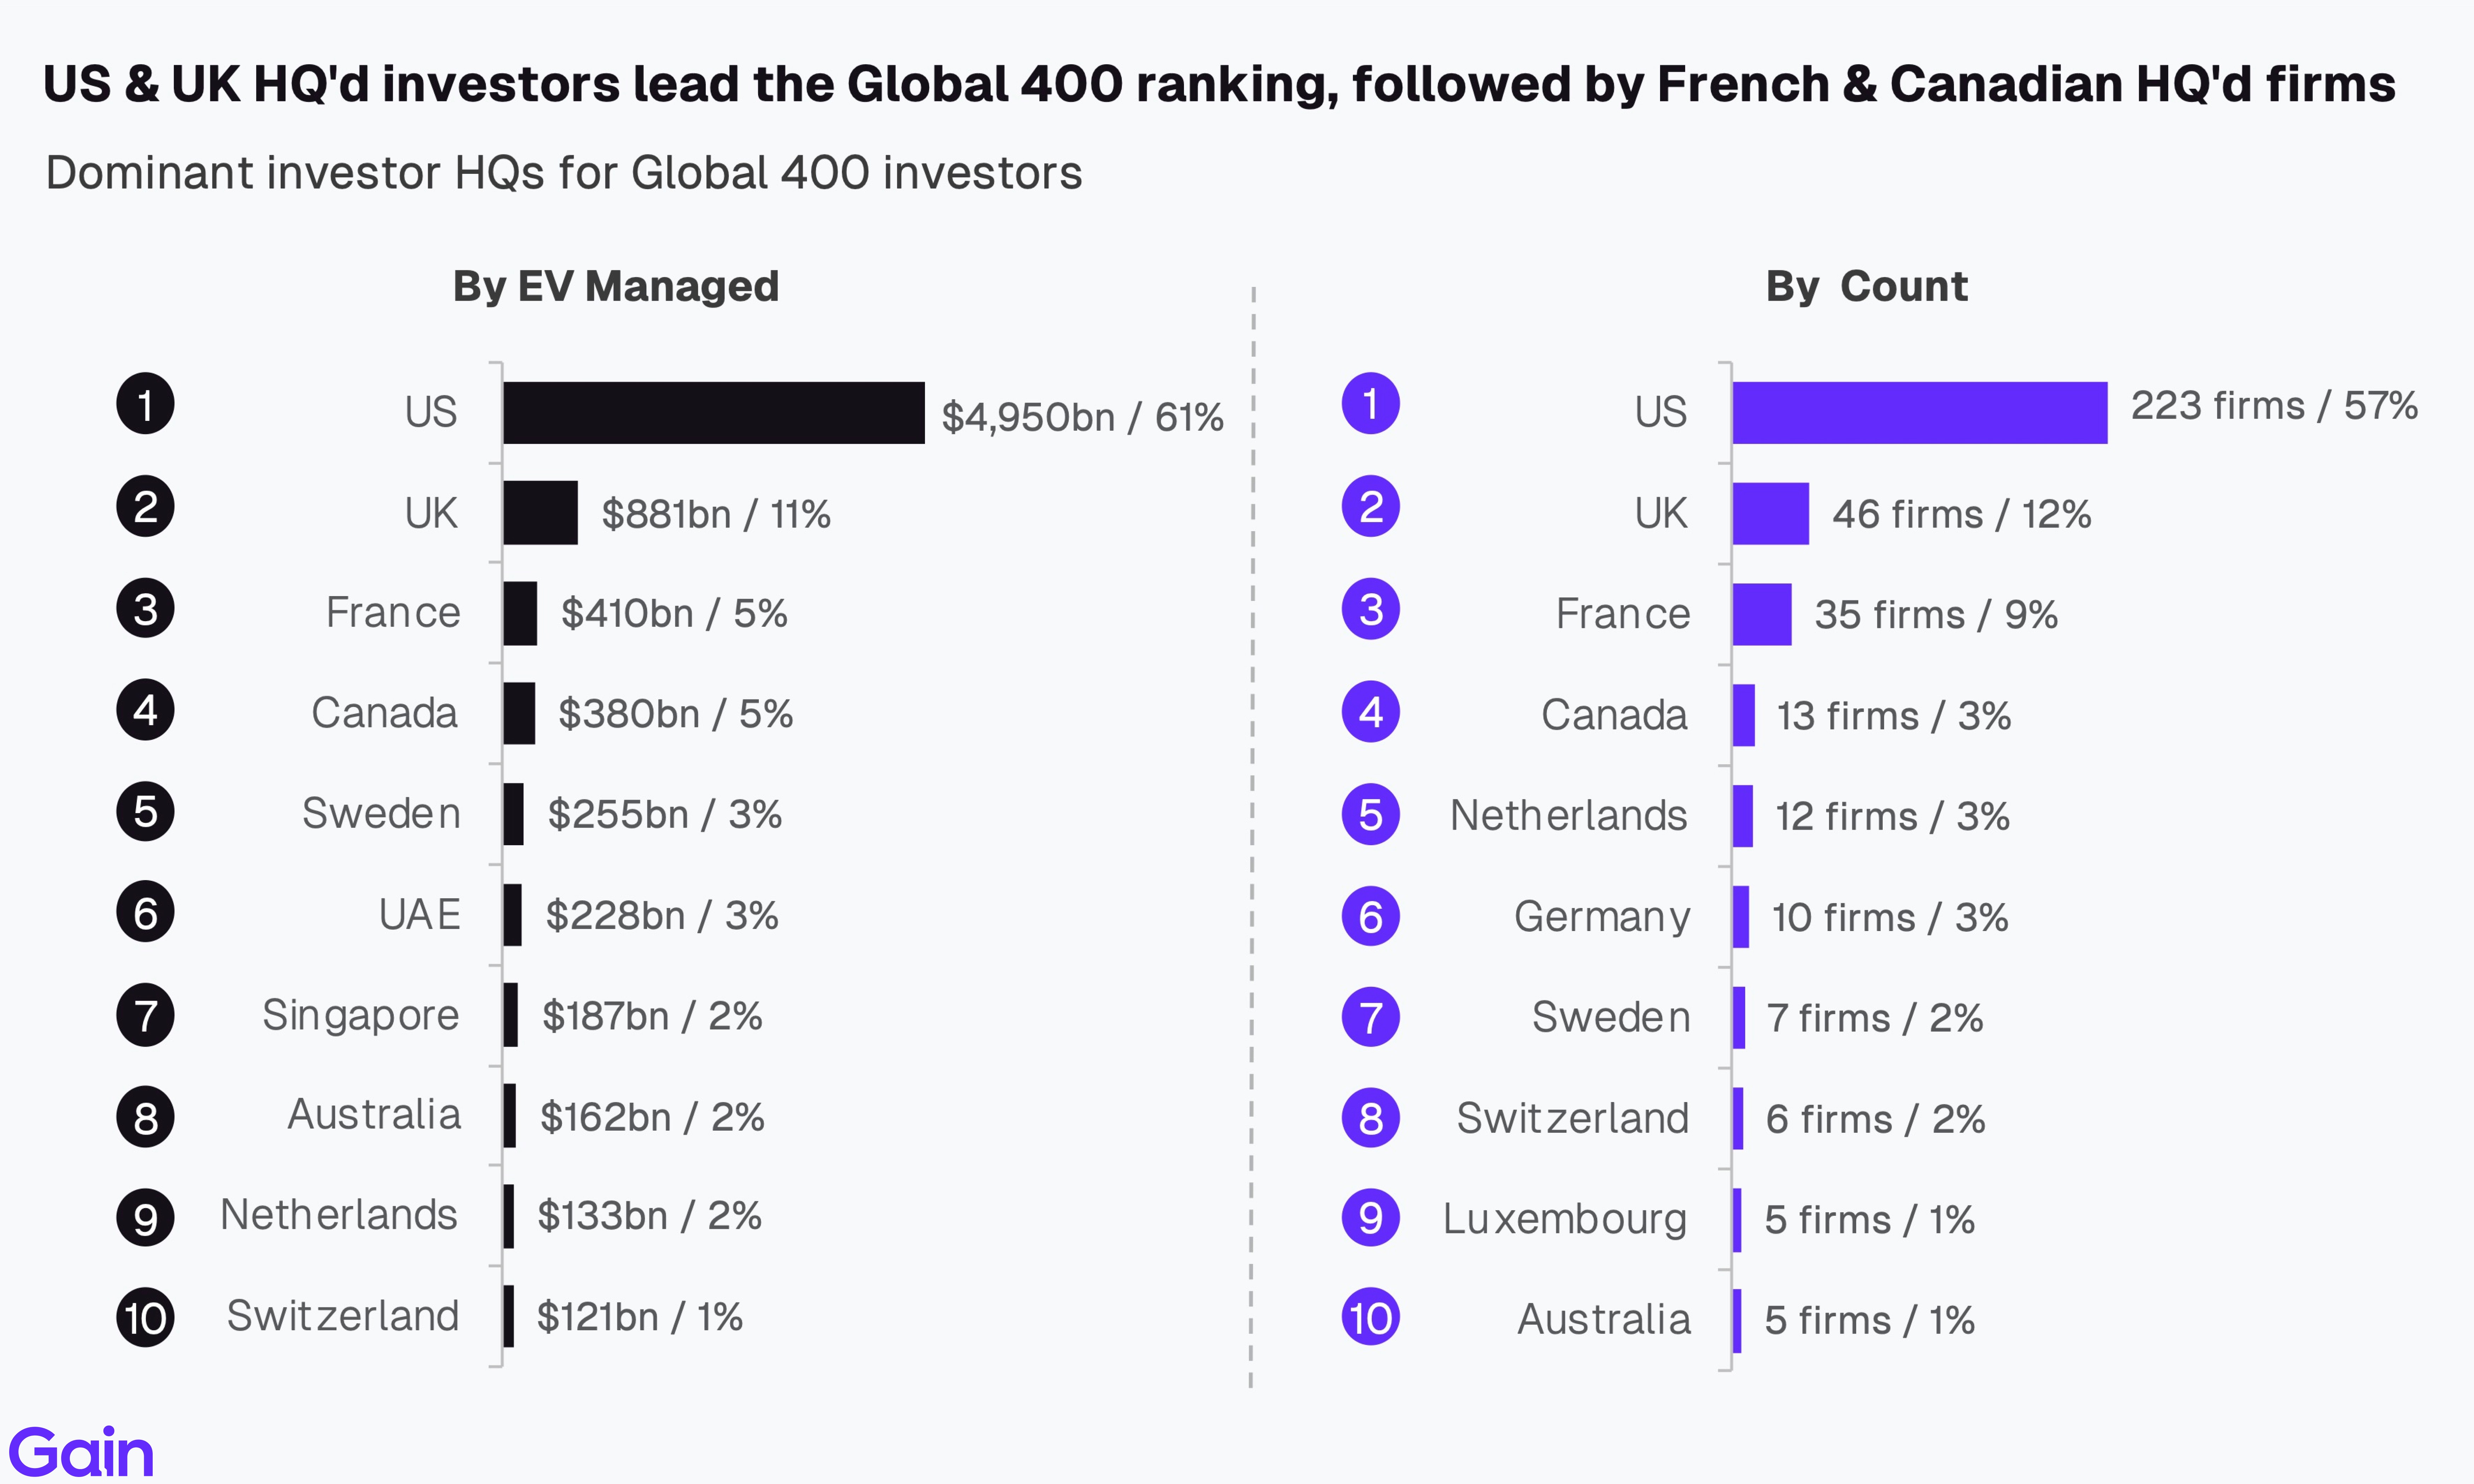
By city, New York is the largest hub for Global 400 investors with 103 PE firms, well ahead of London (44), Paris (31), and San Francisco (24). The largest 4 metropolises account for nearly half of all investor HQs, followed by a long tail of other North American and European cities. Outside the transatlantic region, Singapore (3), Abu Dhabi (3), and Sydney (3) are the most prominent hubs.

Blackstone ($366bn), KKR ($343bn), and Apollo ($178bn) are the three largest North American HQ'd investors. Among European HQ'd investors, EQT ($195bn), CVC ($135bn), and Ardian ($97bn) lead the ranking. Middle Eastern HQ'd investors are represented by sovereign wealth funds, with PIF ($95bn), Mubadala ($84bn), and ADIA ($65bn) being the three largest. GIC ($135bn) leads among Asian HQ'd investors, while Macquarie ($73bn) and IFM Investors ($67bn) top the Australia/NZ ranking.

North American HQ'd investors account for ~66% of Global 400 EV, followed by European HQ'd investors at 25%, Middle East HQ'd at 5%, and APAC HQ'd at 5%. North American HQ'd investors are predominantly invested in larger assets (68% of all assets >$1bn in EV) vs. European investors (21%), which also reflects the larger asset pool and market size in the US compared to Europe.

Chapter 02: Sector 50 Rankings
This table showcases the top 50 private equity firms ranked by sectors. Use the buttons to navigate between the sector rankings.
Top Investors
Leading the sector rankings are Thoma Bravo (TMT), Blackstone (Services & Infrastructure), EQT (Science & Health), KKR (Energy & Materials), Apollo (Industrials), Stone Point Capital (Financial Services), and Roark Capital (Consumer). Vista Equity (97% TMT), Thoma Bravo (93% TMT), DigitalBridge (78% Infra), IFM Investors (68% Infra), Roark Capital (84% Consumer), 3i Group (79% Consumer), and Stone Point Capital (62% Financials) predominantly allocate to a single sector.

Sector Insights
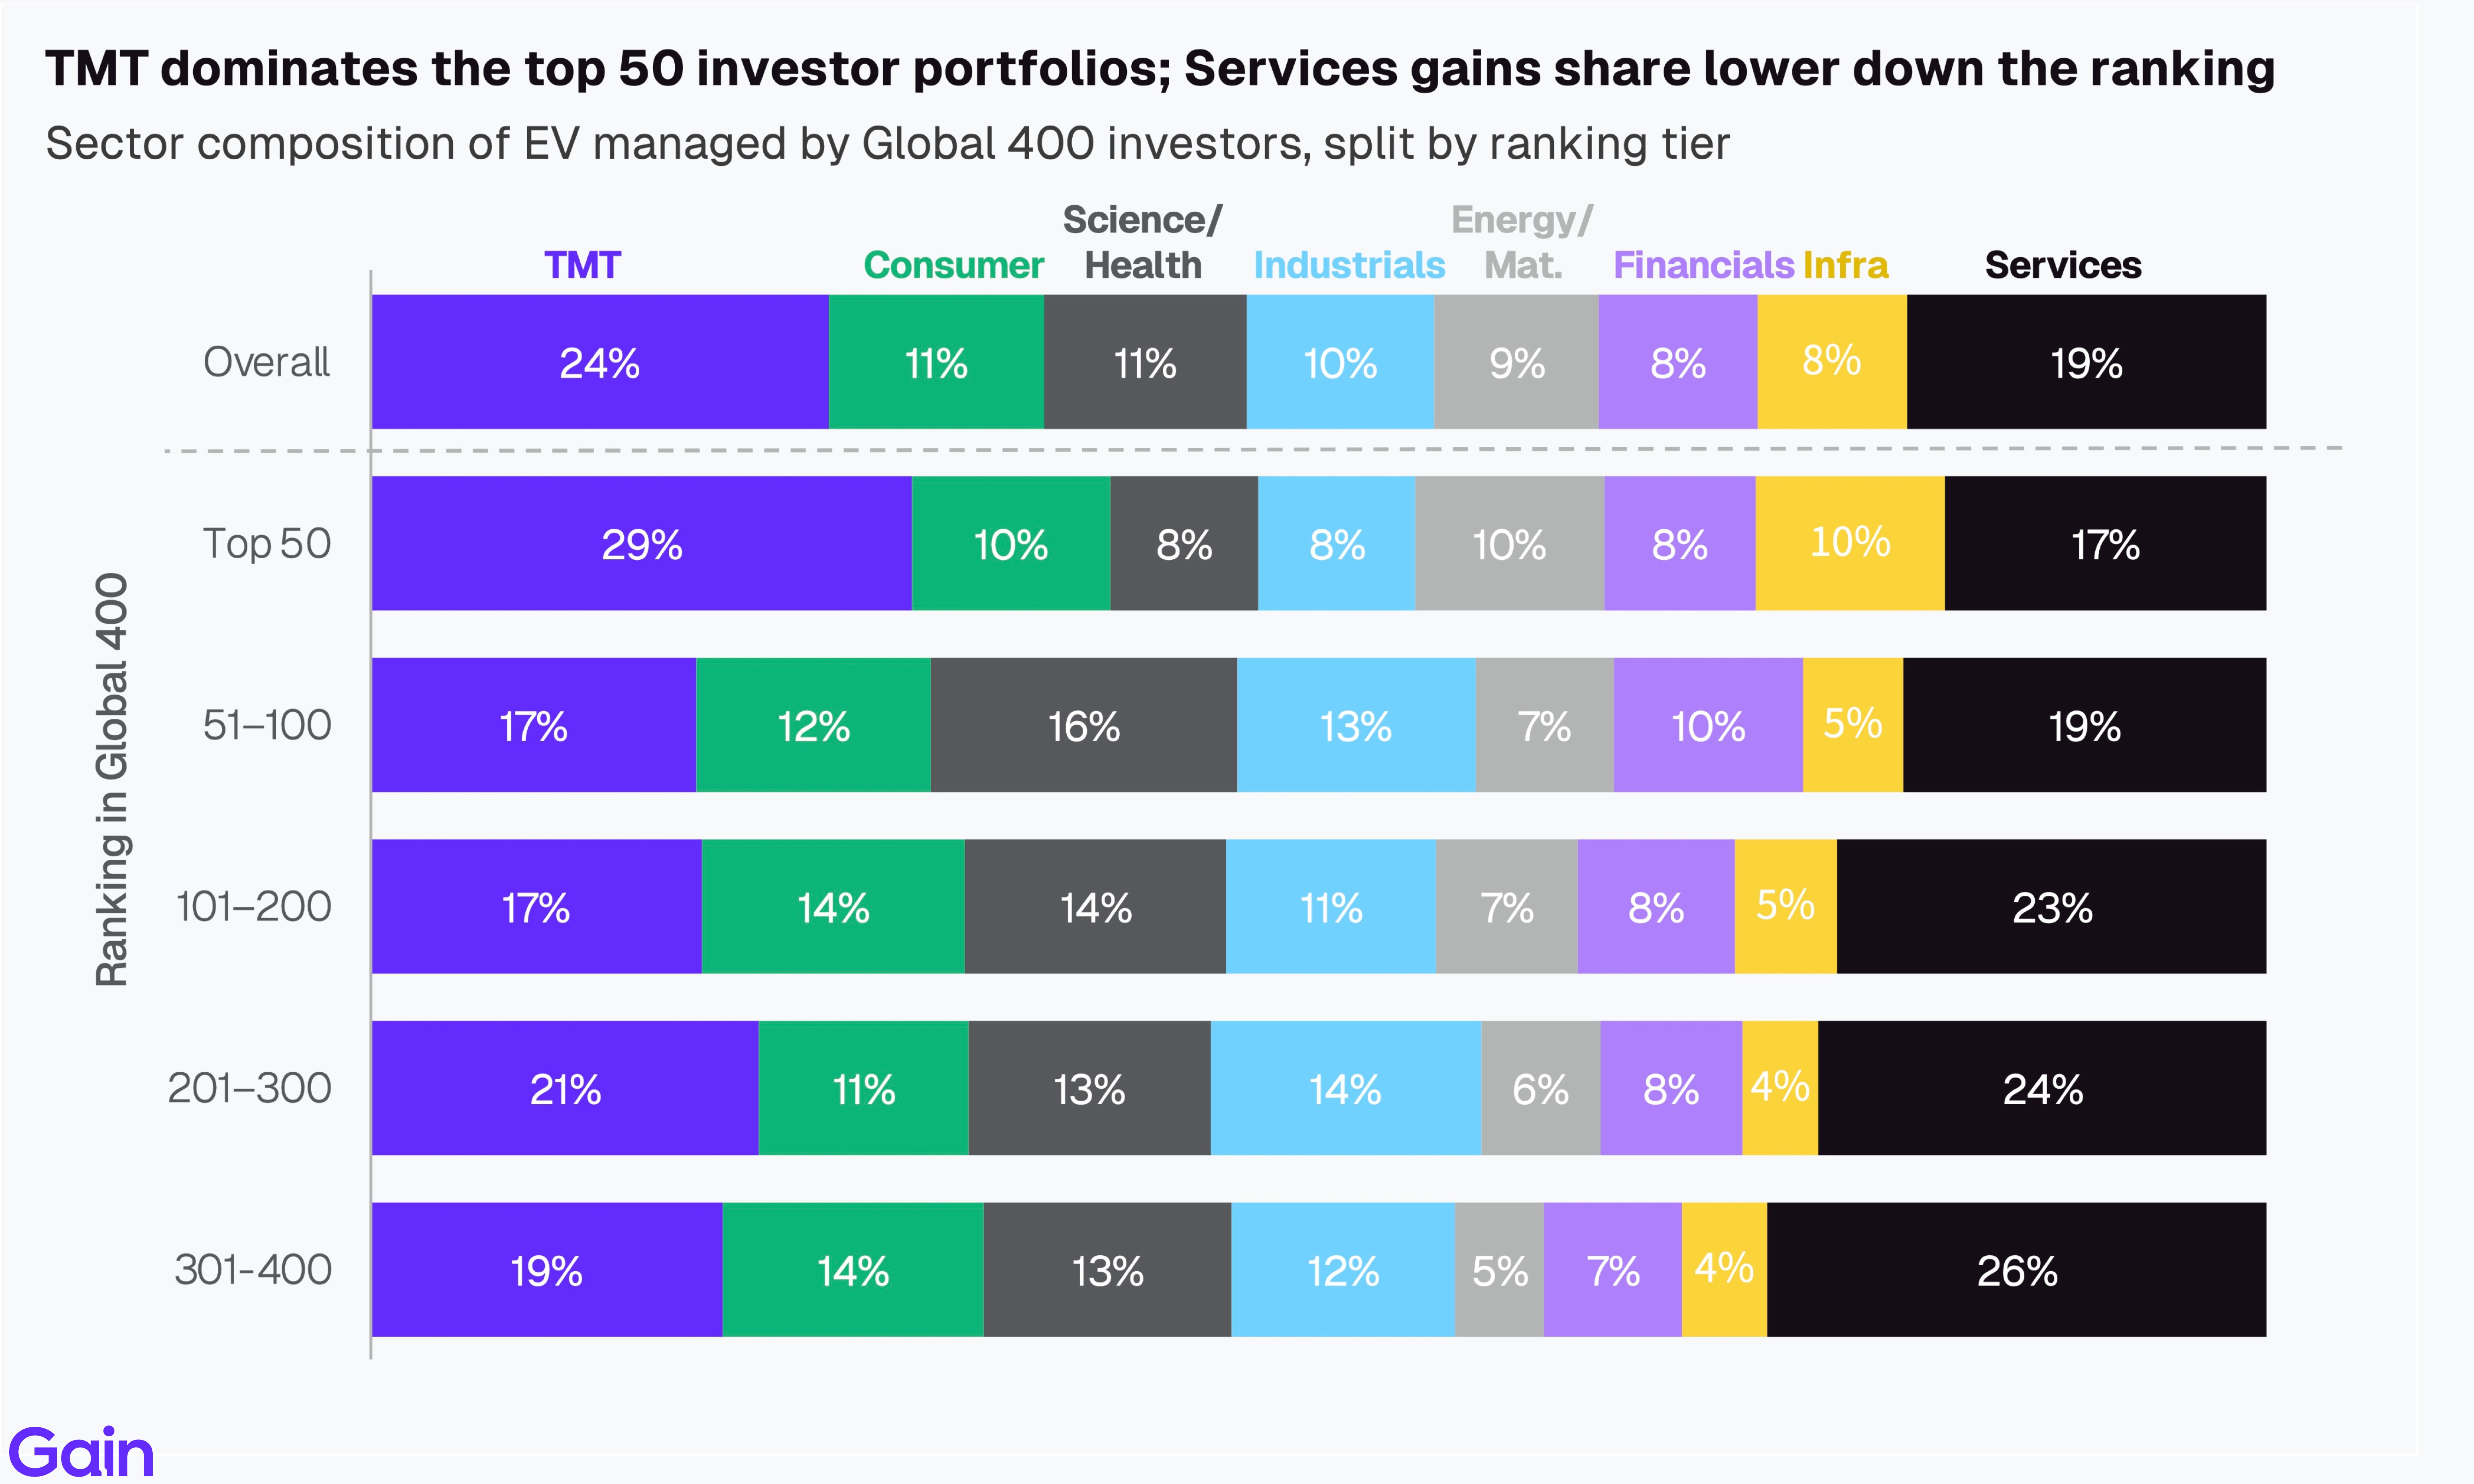
TMT is the largest PE sector in the world (24% of Global 400 EV), followed closely by Services (19%) and then Consumer (11%). Combined, these three sectors account for over half of the overall Global 400 EV. At the subsector level, the largest ones are Software (15%), Professional Services (9%), Infrastructure (8%), Manufacturing (7%), Energy (7%), and Healthcare Services (6%).

The sector mix for PE entry activity has shifted materially since 2010. The share of TMT has grown by +12pp as investors have gravitated toward asset-light, fast-growing businesses, though recent stress in public software markets may put pressure on this trend. Consumer (-11pp) and Industrials (-8pp) have seen the sharpest declines, driven by slowing underlying growth rates and a challenging exit environment. Other sectors have collectively gained +7pp.

By sector, TMT (29%) is the dominant sector for the top 50 investors, though whether this persists remains to be seen given recent sell-downs and stress in TMT valuations. Services gains prominence lower down the ranking (17% to 26%). Science & Health is relatively higher among ranks 51-200, indicating a stronger mid-market healthcare focus. Infrastructure skews toward the top of the ranking (10%), consistent with the large-ticket focus of mega-funds, while Industrials is more prominent among smaller investors.
Sponsor Consolidation
Infrastructure, Energy & Materials, and Financial Services are the most concentrated sectors in terms of investor ownership, with 40% of EV in Infrastructure managed by just the top 5 investors. In contrast, Science & Health, Services, and Industrials exhibit a broader investor base, with the top 5 accounting for an average of 16% of sector EV, indicating more distributed ownership across multiple investors.

Infrastructure stands out as the sector with the largest concentration of EV in assets over $1bn, with mega-large assets accounting for 86% of sector EV. In contrast, Industrials, Services, and Science & Health show a more balanced EV mix across mid- and large-cap assets. Overall, assets valued above $1bn account for 66% of aggregate portfolio EV across the Global 400, while assets below $50m contribute less than 1%.

TMT has the highest proportion of EV managed by sector specialists at 42%, with Thoma Bravo, Vista Equity Partners, and Silver Lake among the leading specialists (>50% EV allocation to the sector). Consumer follows at 25%, driven by investors such as Roark Capital, 3i Group, and PAI Partners. Energy & Materials, in contrast, shows the lowest specialist concentration at 7%.

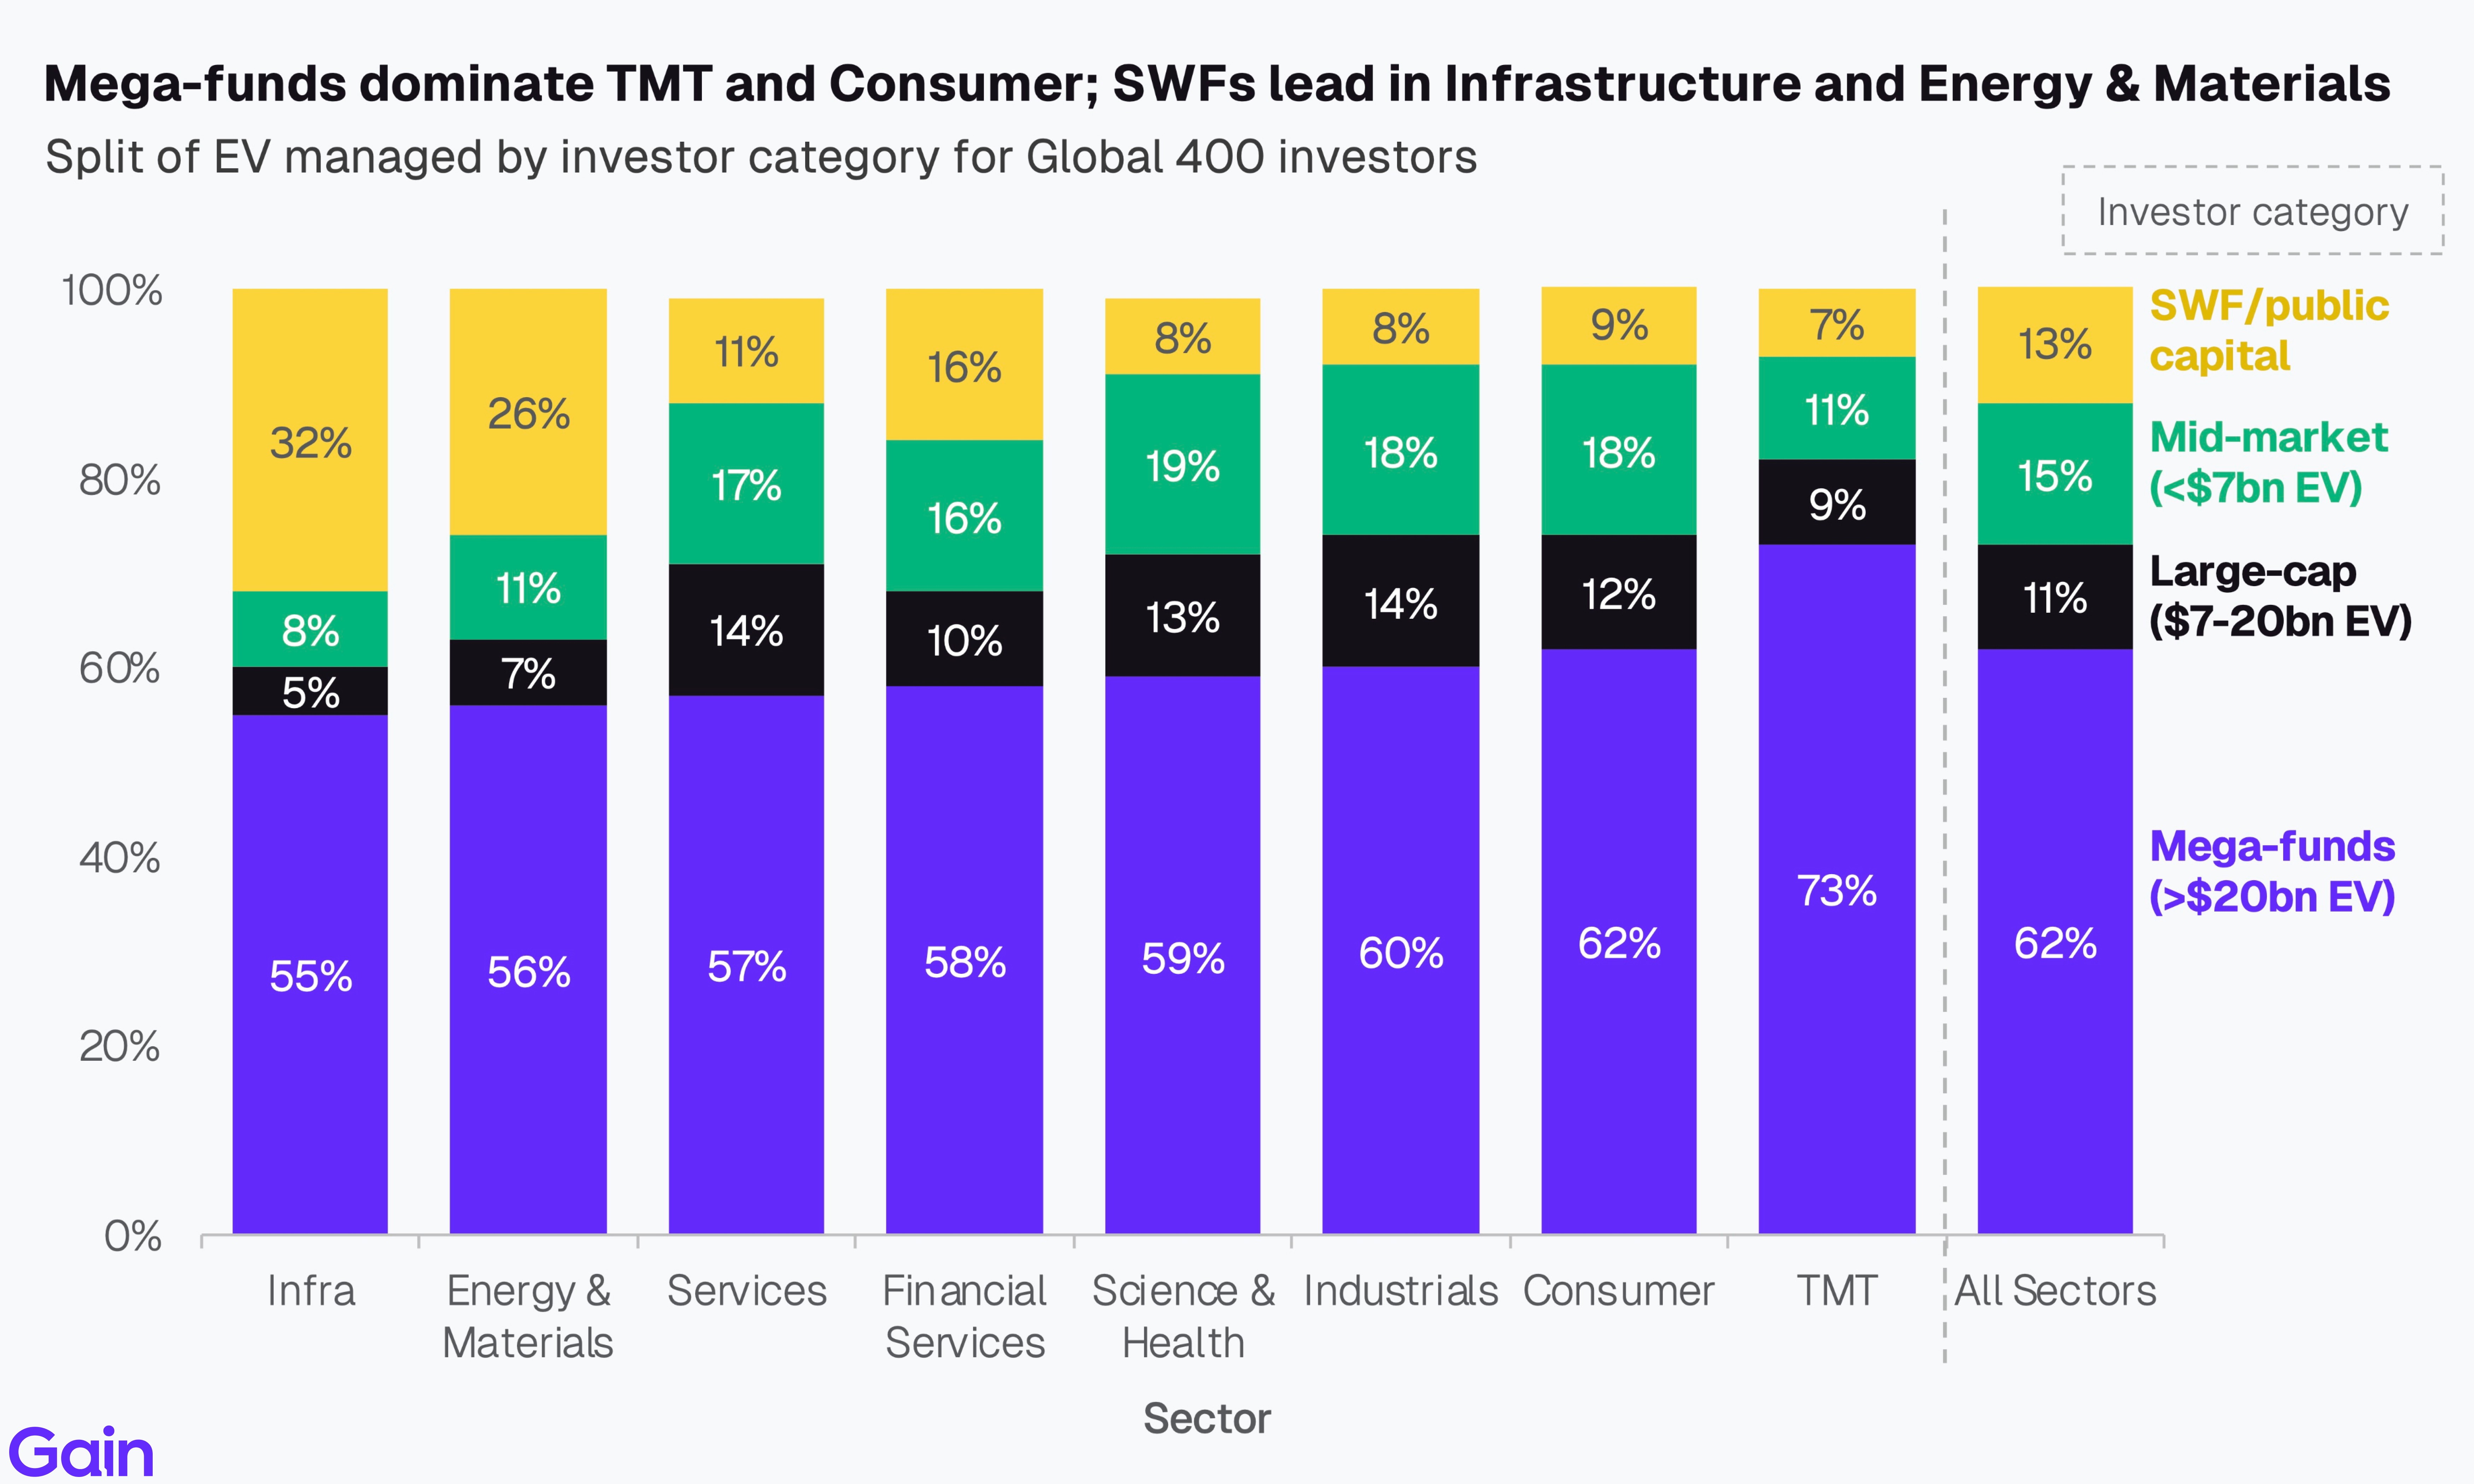
Mega-funds dominate across most sectors, with their share highest in TMT (73%) and Consumer (62%). Large-cap and mid-market investors are more active in Services and Industrials. Infrastructure (32%) and Energy & Materials (26%) show the highest SWF/public capital presence, consistent with the large-ticket, long-duration focus of sovereign capital in real assets.
Asian HQ'd investors overweight Financial Services (18%) and Energy & Materials (13%) relative to other regions. North American and European HQ’d investors, in contrast, concentrate in TMT and Services. Middle Eastern investors are more broadly diversified, with no single sector exceeding 20% of EV. Australia/NZ HQ’d investors stand apart, with nearly half (46%) of their EV allocated to Infrastructure.

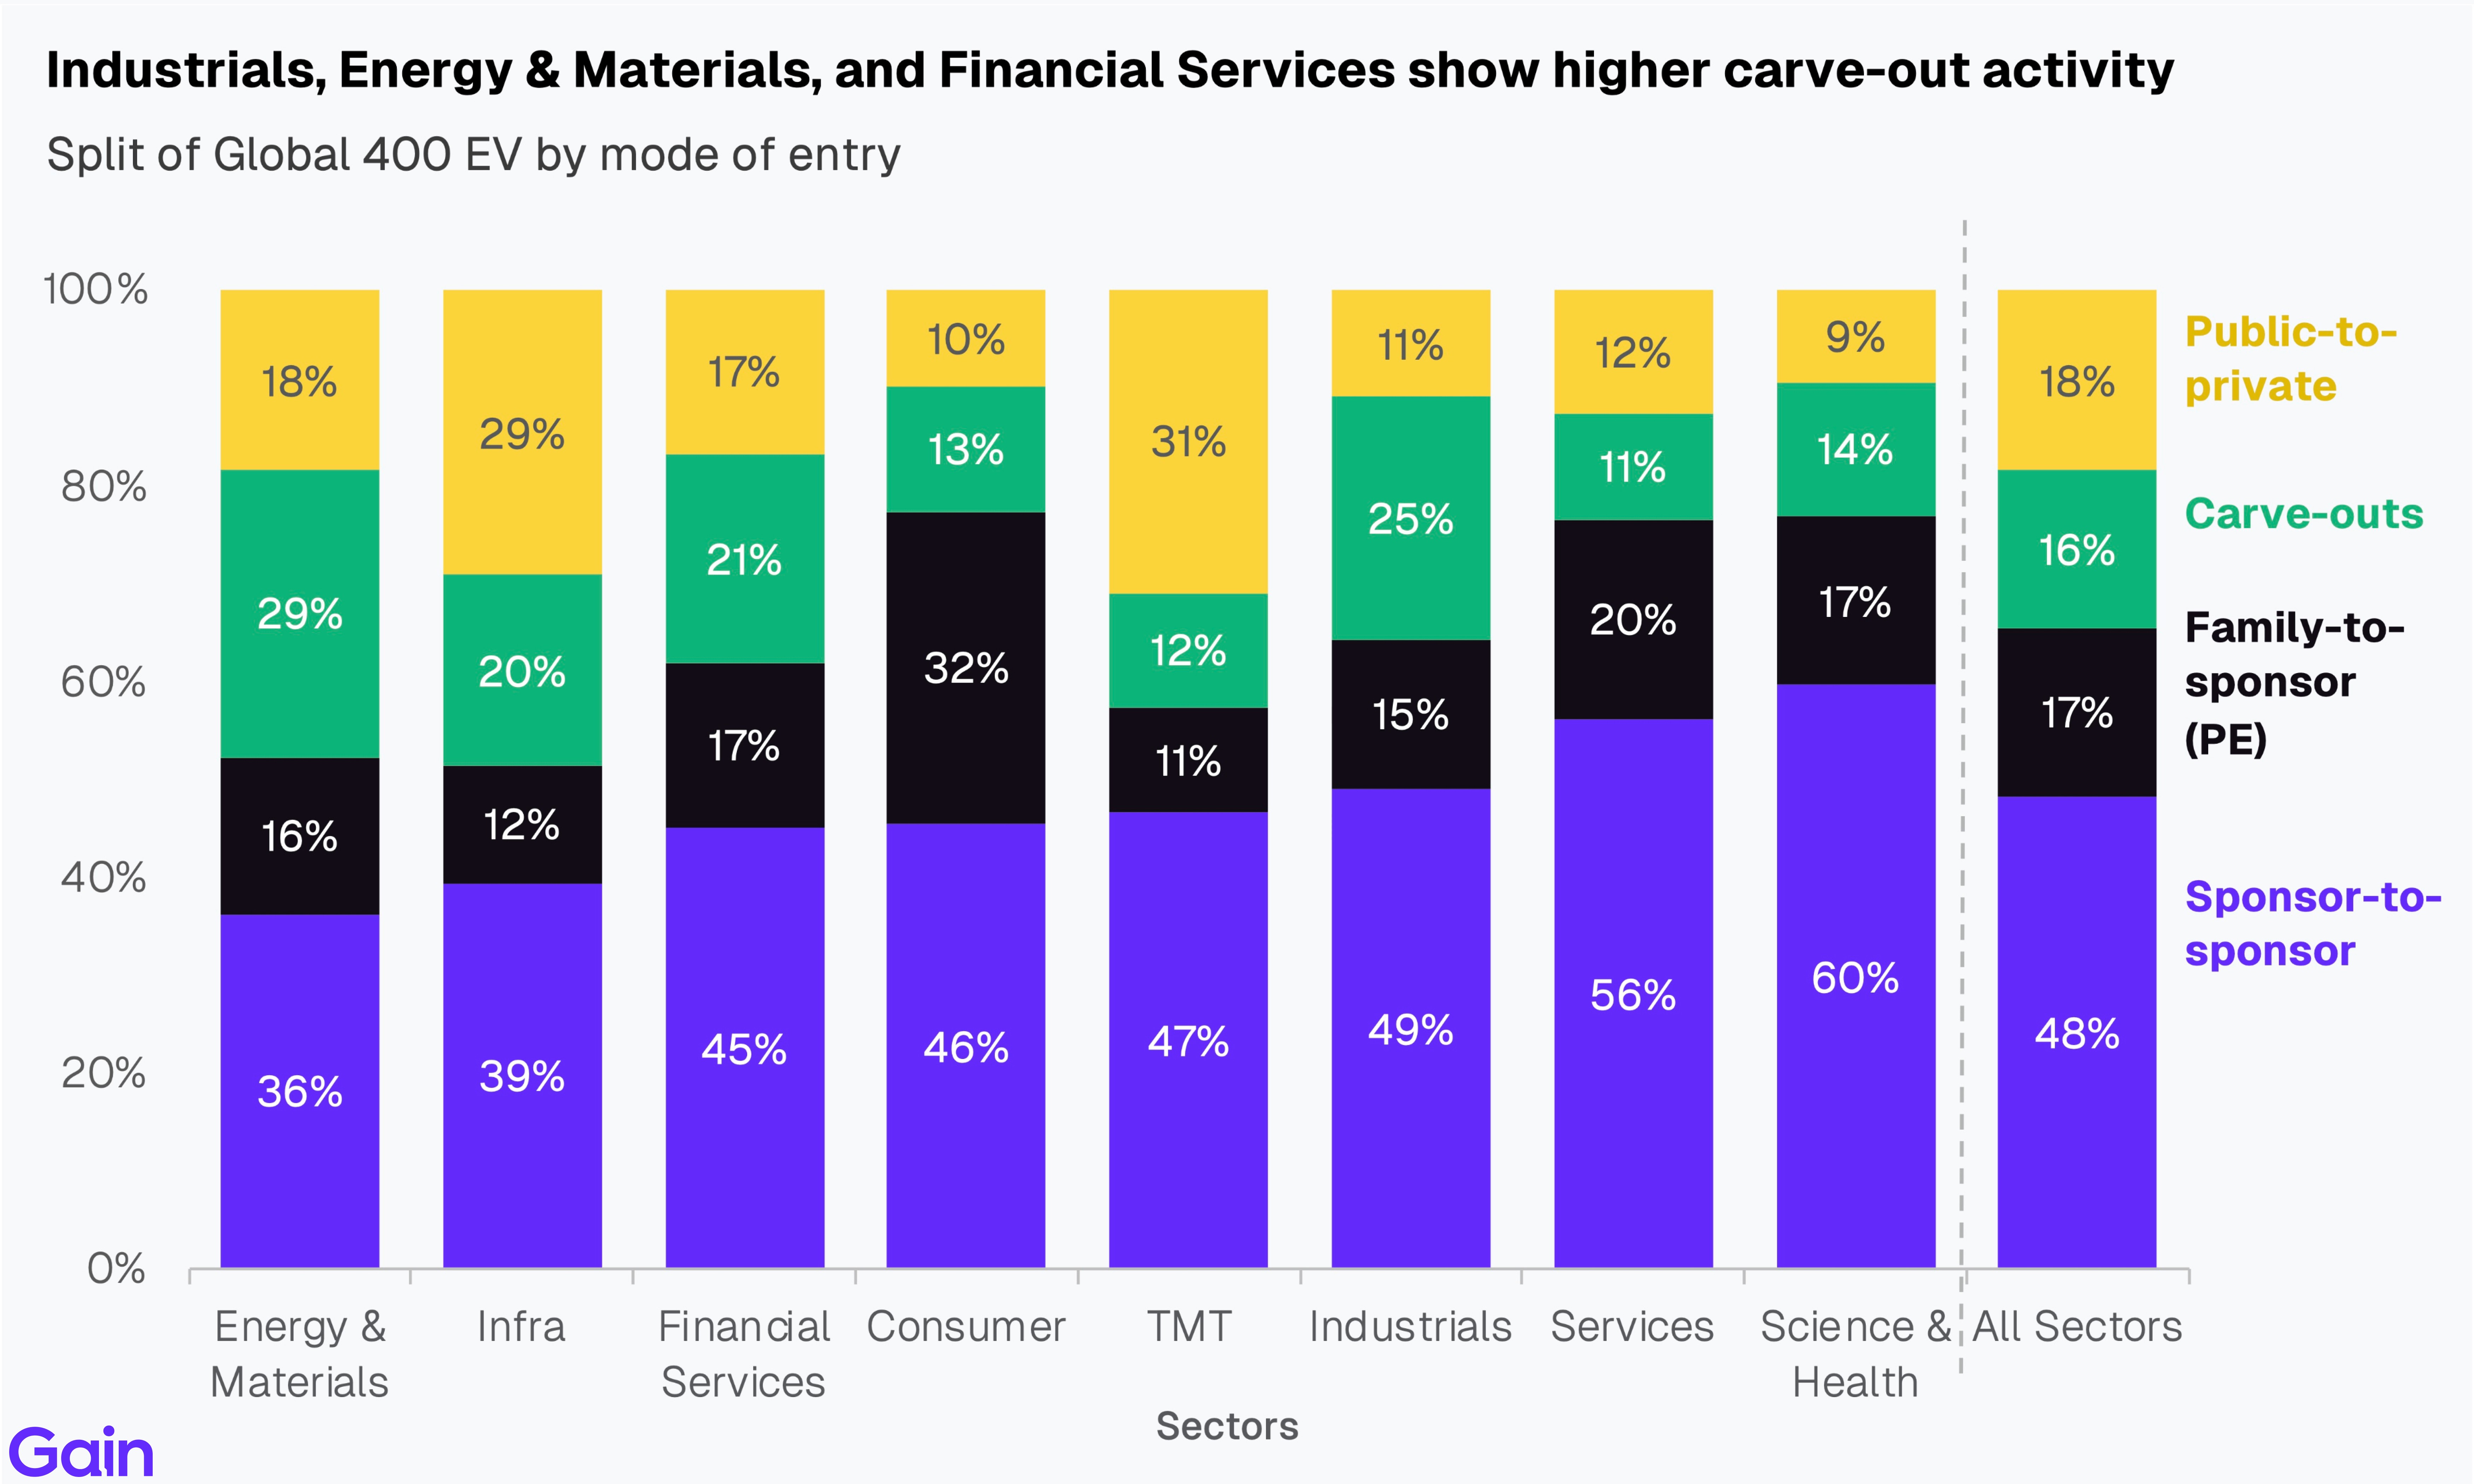
Sponsor-to-sponsor transactions dominate across all sectors, with Science & Health (60%) and Services (56%) showing the highest share. Carve-outs are more prominent in Energy & Materials (29%), Industrials (25%), and Financial Services (21%), driven by large-scale conglomerates divesting assets to realign strategic focus. Public-to-private activity is highest in TMT (31%) and Infrastructure (29%). Family-to-sponsor transactions are most active in Consumer (32%), with a relatively consistent distribution across other sectors.
Chapter 03: Regional Insights
Region of Investment
North America accounts for 54% of Global 400 EV and 48% of the portfolio by count. Europe accounts for 38% and 43%, respectively. APAC and the Middle East remain comparatively small, with APAC accounting for 5% of both EV and portfolio count, and the Middle East for 2% of each.

The US overwhelmingly dominates transatlantic PE markets, accounting for ~46% of Global 400 PE-backed companies, well ahead of France (~12%) and the UK (~10%). Outside transatlantic markets, Australia and India host the largest share of Global 400 portfolio companies, followed by Saudi Arabia and China.
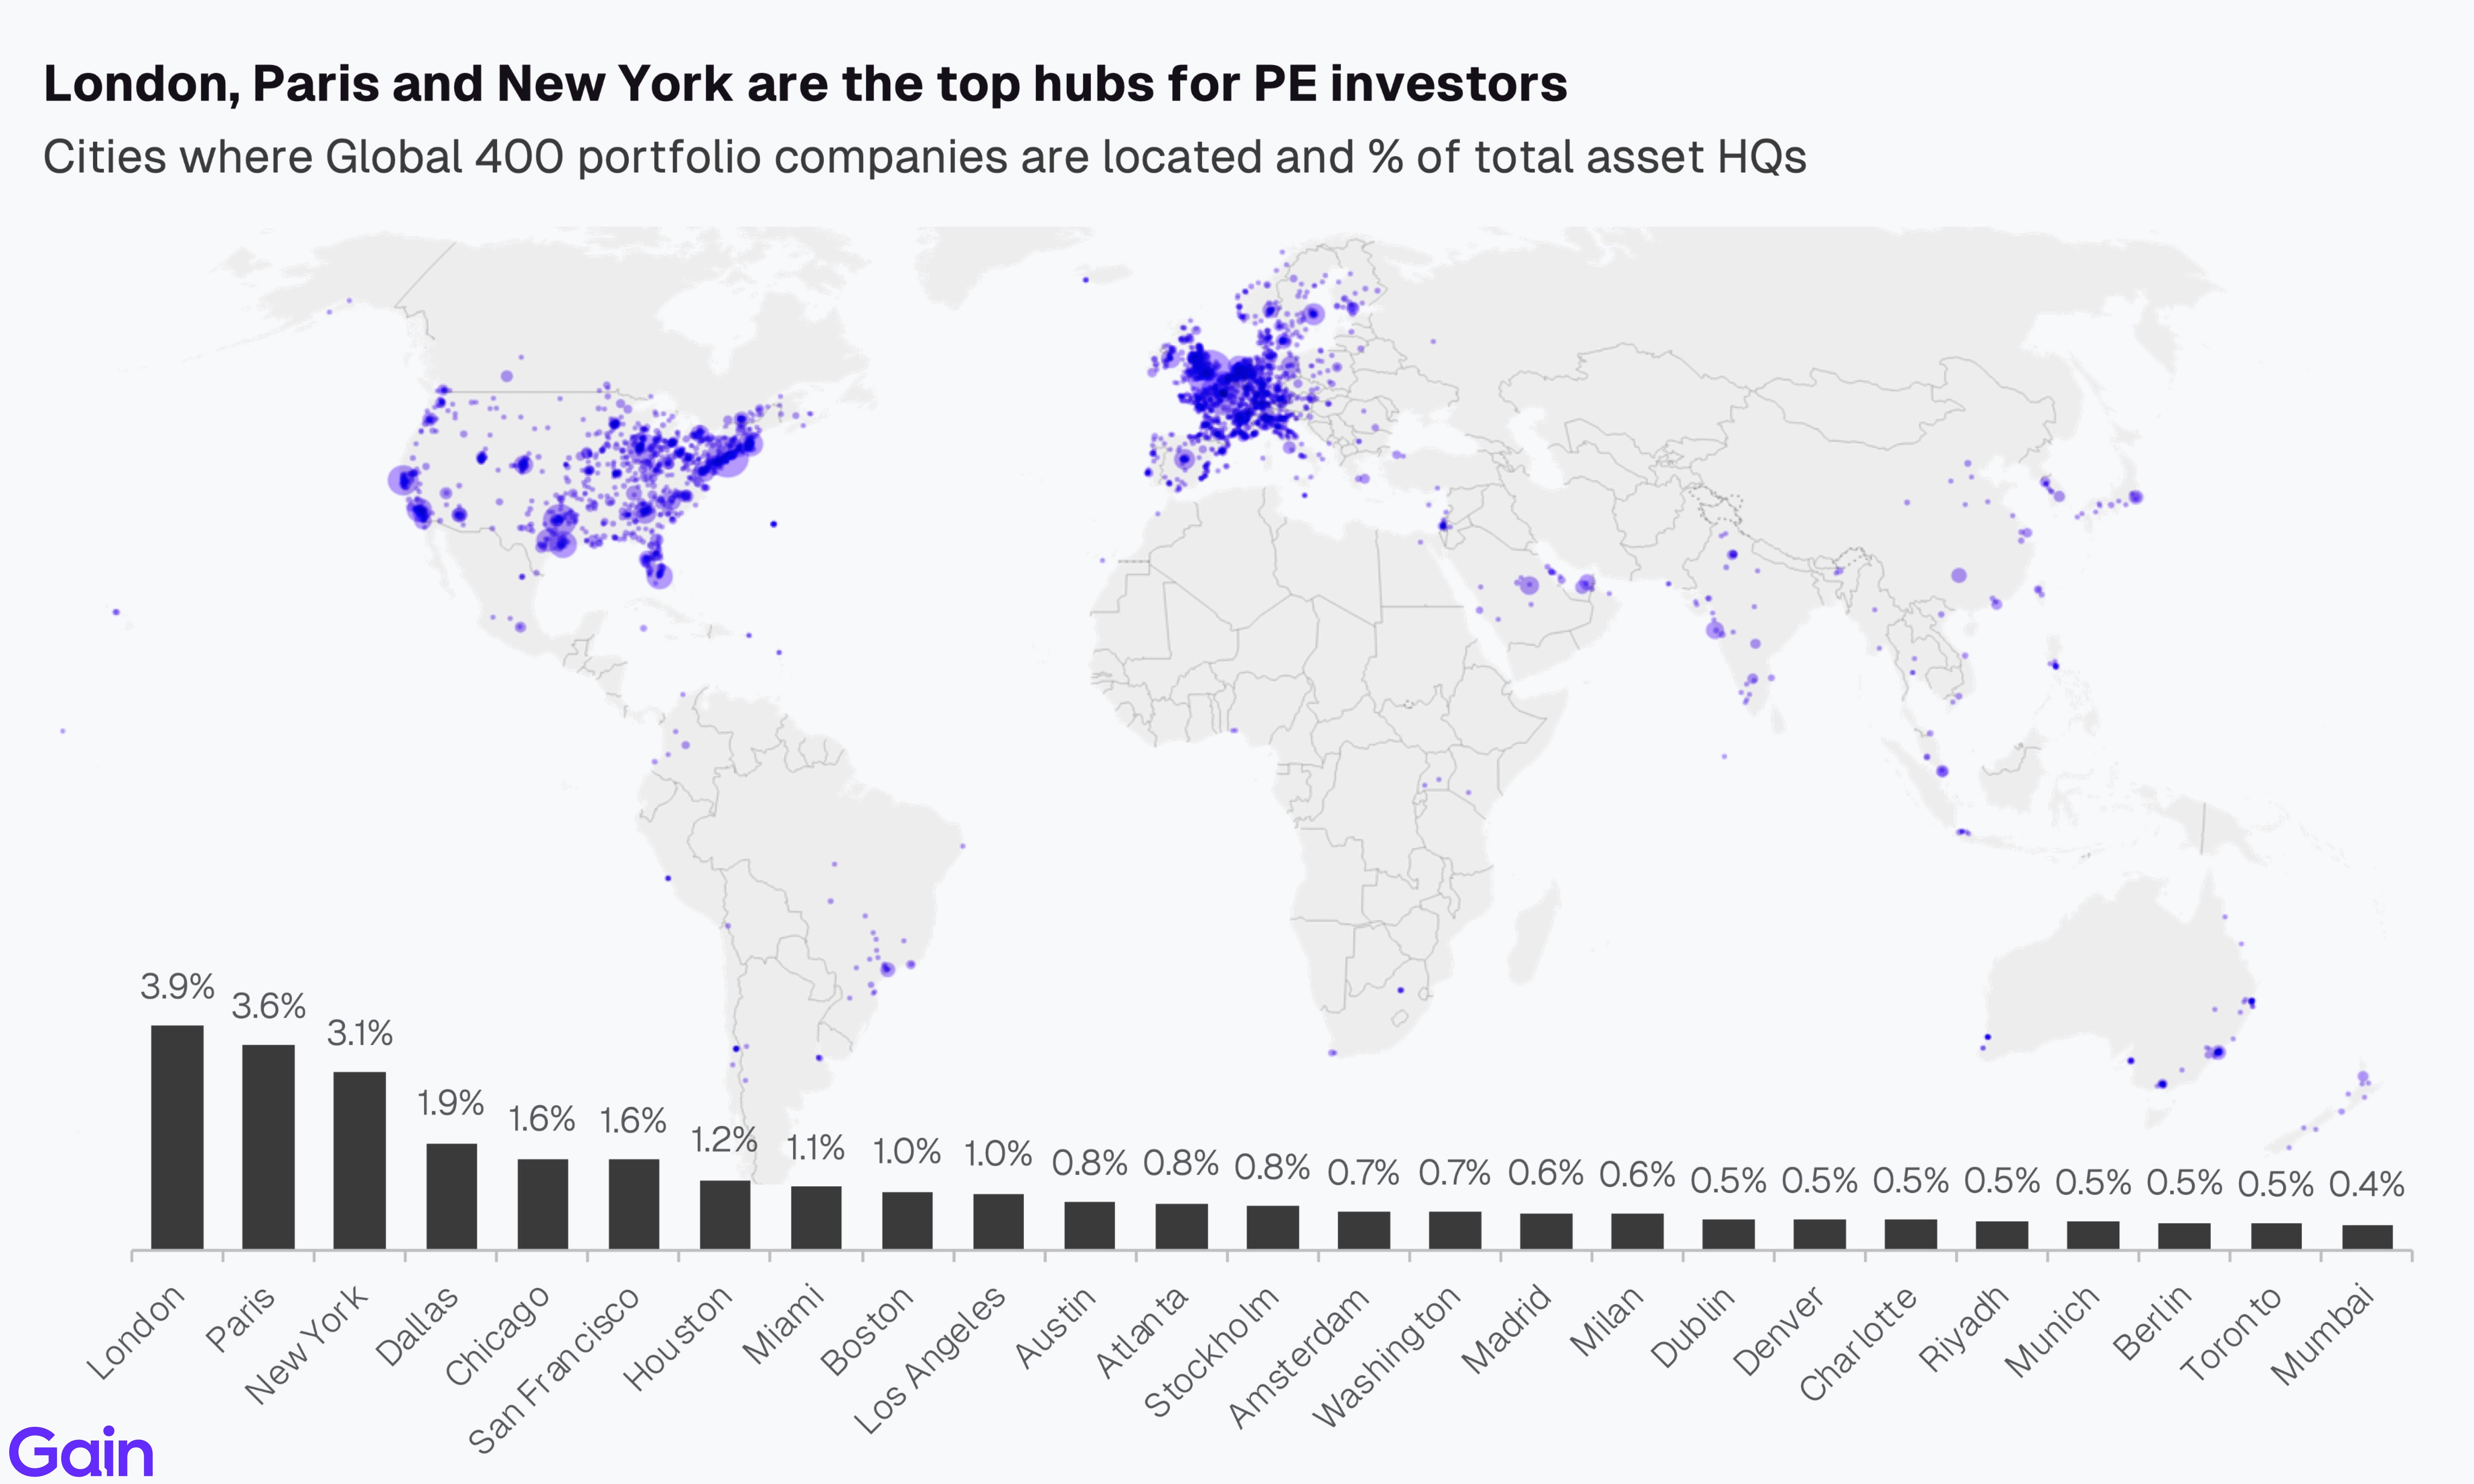
By city, London, Paris, and New York are the largest hubs for Global 400 portfolio companies, reflecting the concentration of PE-backed businesses in the major global financial centers. Within the US, activity is broadly spread across Dallas, Chicago, San Francisco, and Houston, with no single city dominating outside New York. Stockholm, Amsterdam, Milan, and Madrid stand out as the leading European hubs beyond the UK and France, while Riyadh, Mumbai, Dubai, Singapore, Sydney, and Tokyo highlight growing PE activity across the Middle East and APAC.
Sector Mix by Region of Investment
TMT and Services dominate North American PE activity, accounting for nearly half of all PE-backed firms. In Europe, Services leads ahead of TMT and Industrials, reflecting the region’s strong mid-market services asset pool. Non-transatlantic markets show a more balanced sector mix, led by Consumer and Services, supported by large domestic demand across markets such as India, China, and the Middle East.

TMT is the largest sector of investment in North America (28%), while Services leads in Europe (20%), the Middle East (27%), and Asia (18%). Australia/NZ stands out for its strong Infrastructure exposure, where the sector accounts for 26% of managed EV. Across most regions, Services and TMT consistently rank among the leading sector exposures, with Australia/NZ and Rest of the World as the main exceptions.

Chapter 04: Portfolio Benchmarking
In this section, we explore the investment portfolios of the top 30 PE investors in the world, analyzing entries, exits, growth rates, profitability, buy-and-build activity, holding periods, EBITDA range and the sector/regional makeup of their global investments.
Note: We exclude from this analysis investors who have fewer than 5 data points for a particular metric.
By Sector & Region
Among the top 30 investors, Vista Equity (97%), Thoma Bravo (93%), and Hg (86%) lead in TMT concentration. Investors with the strongest Services focus include EQT (28%), CVC (27%), and Macquarie (27%). In Consumer, Apollo (22%), CD&R (19%), and CVC (19%) show higher concentration, while CD&R also leads in Industrials at 30%. IFM Investors (68%) and BlackRock (47%) show the strongest Infrastructure allocations. In contrast, KKR, Carlyle, and Goldman Sachs AM showcase more balanced portfolios across sectors.

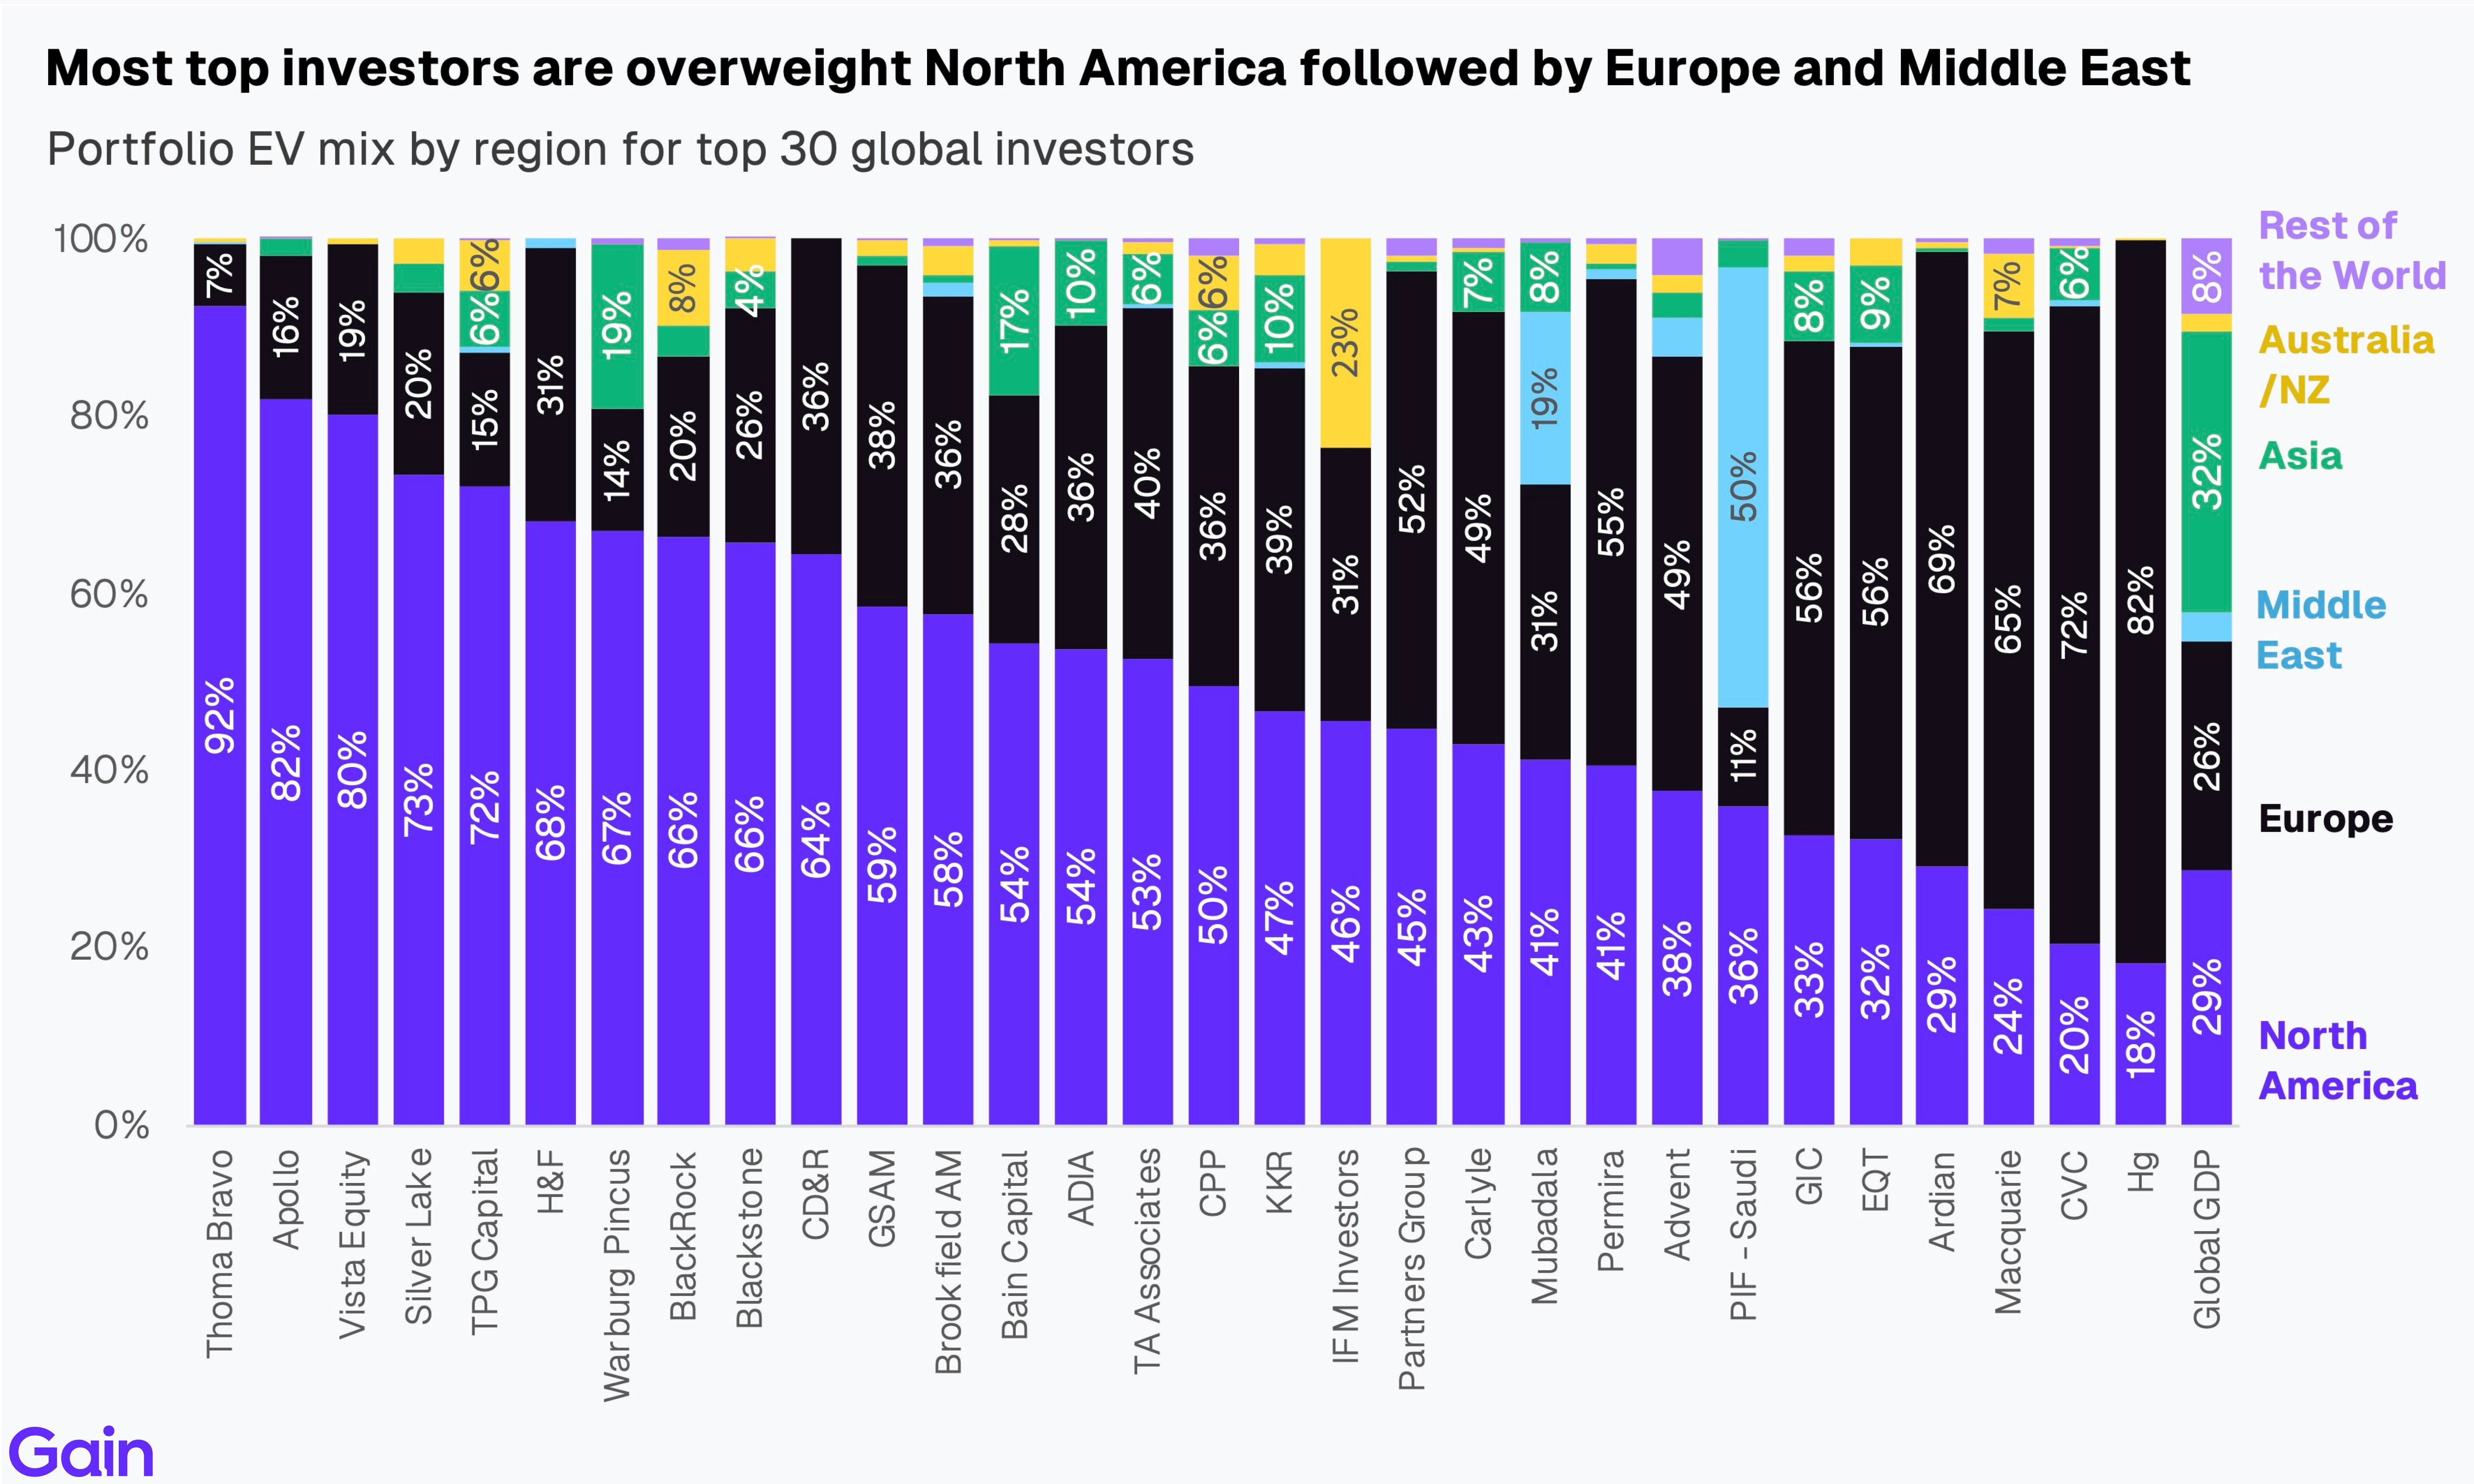
By region, North America dominates portfolio allocations among the top 30 investors, led by Thoma Bravo (92%), Apollo (82%), and Vista Equity (80%). In Europe, Hg (82%), CVC (72%), and Ardian (69%) are the most Europe-focused investors, while sovereign funds such as PIF, Mubadala, and ADIA show the highest exposure to the Middle East. Bain Capital (19%) and Warburg Pincus (17%) lead in Asia exposure. IFM Investors and Macquarie stand out for their exposure to Australia/NZ, whereas KKR, Carlyle, and Advent maintain more balanced transatlantic portfolios.
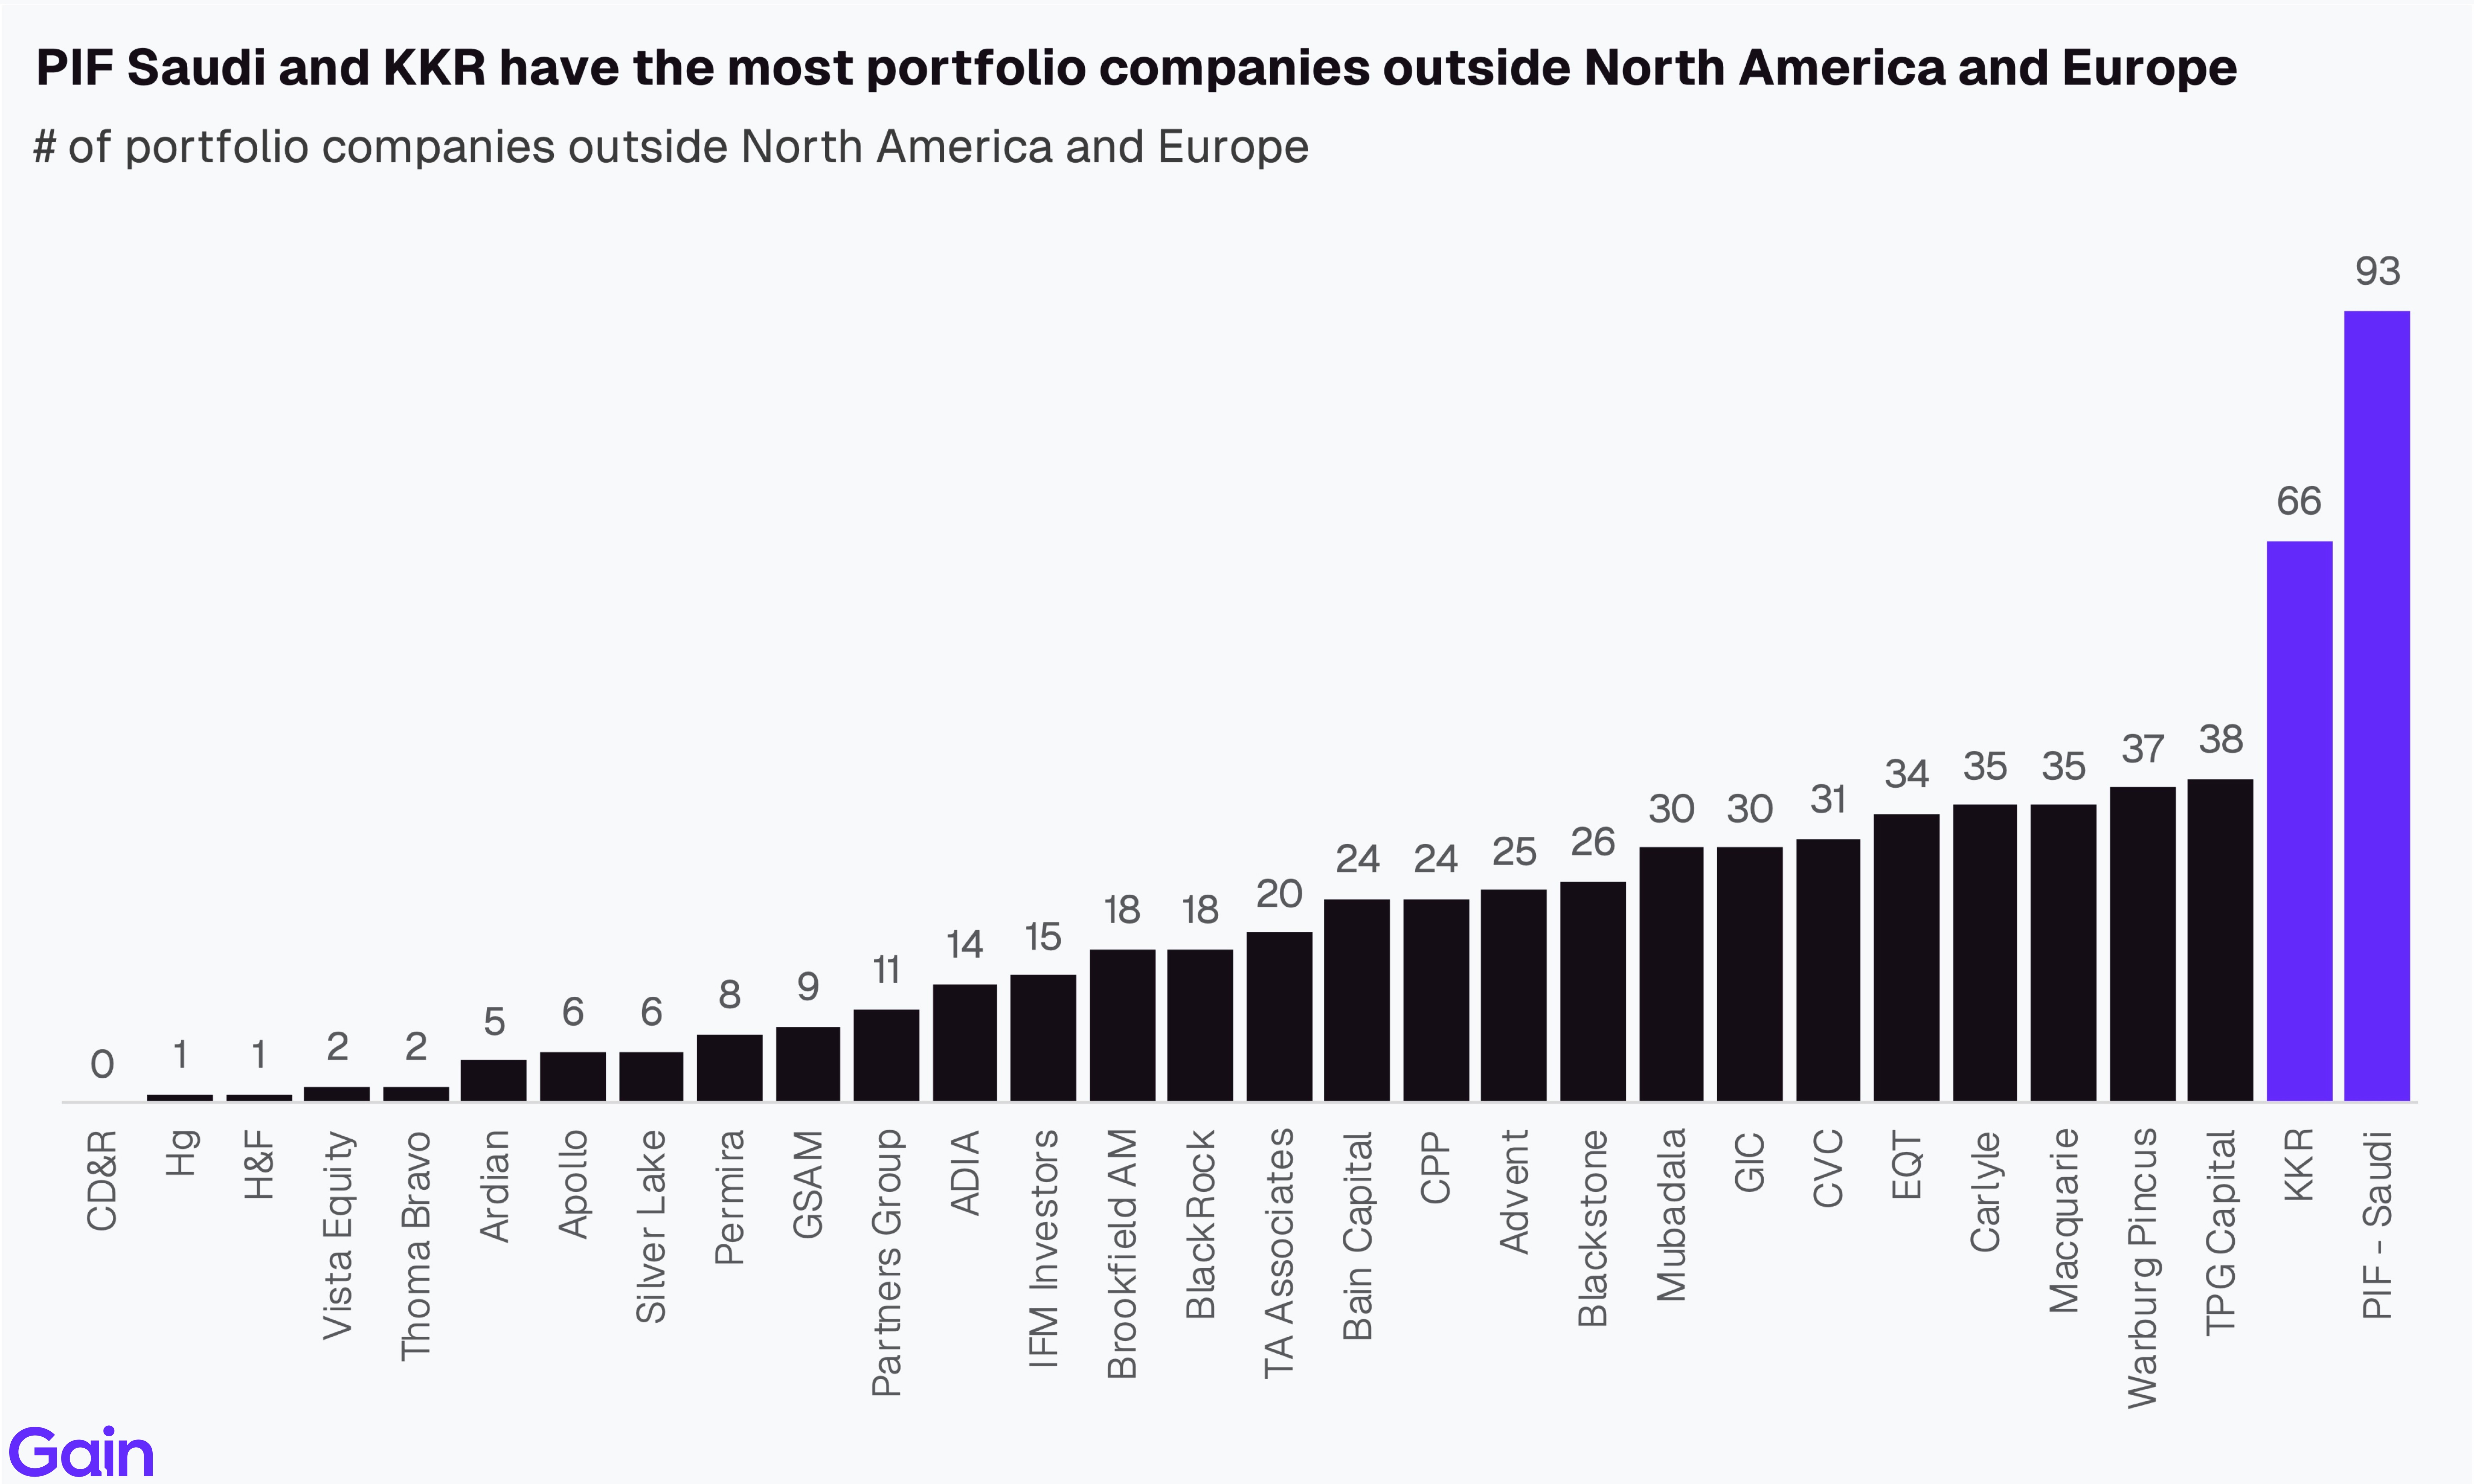
PIF (93) and KKR (66) stand out with the highest number of portfolio companies outside North America and Europe. TPG Capital (38), Warburg Pincus (37), and Macquarie (35) also have a higher international exposure. In contrast, CD&R, Hg, and H&F have minimal presence outside these regions, consistent with their focus on North America and Europe.
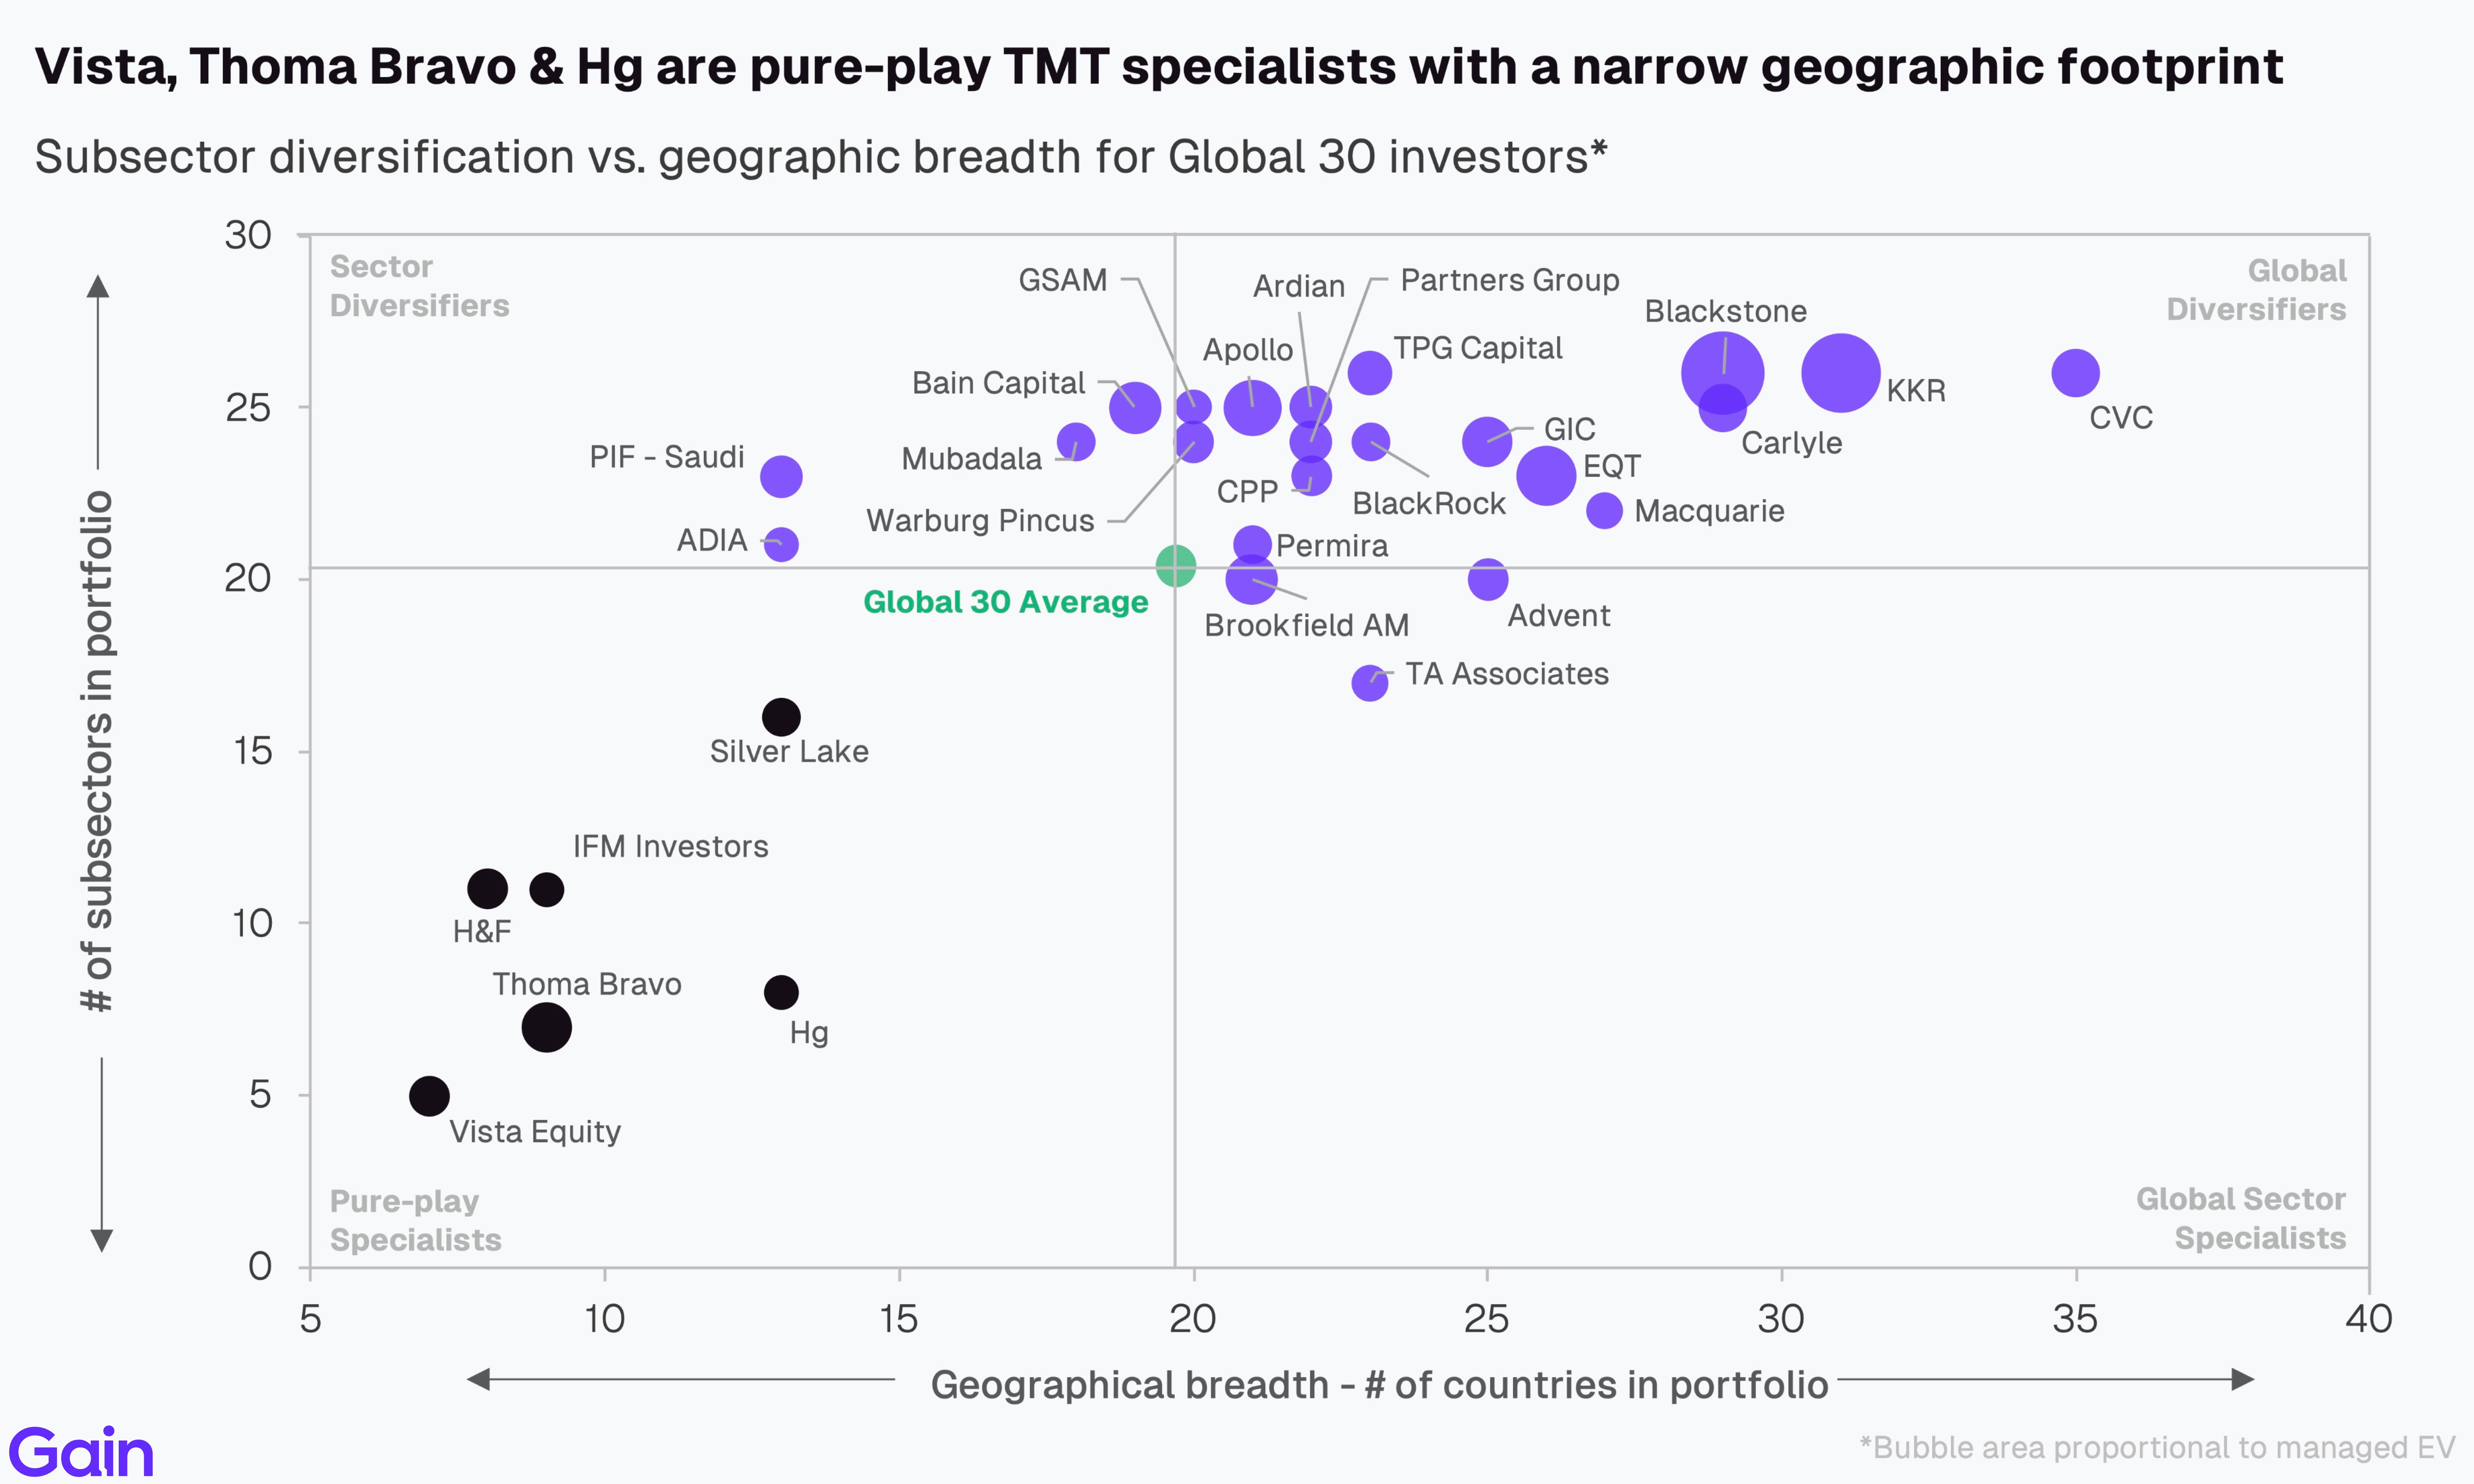
Vista Equity, Thoma Bravo, and Hg stand out as pure-play TMT specialists with narrow geographic footprints, investing across fewer than 10 subsectors and 15 countries. IFM Investors and H&F also exhibit limited subsector and geographic breadth. At the other end, KKR, Carlyle, CVC, and Blackstone combine exposure to more than 25 subsectors across 30+ countries.
By Size
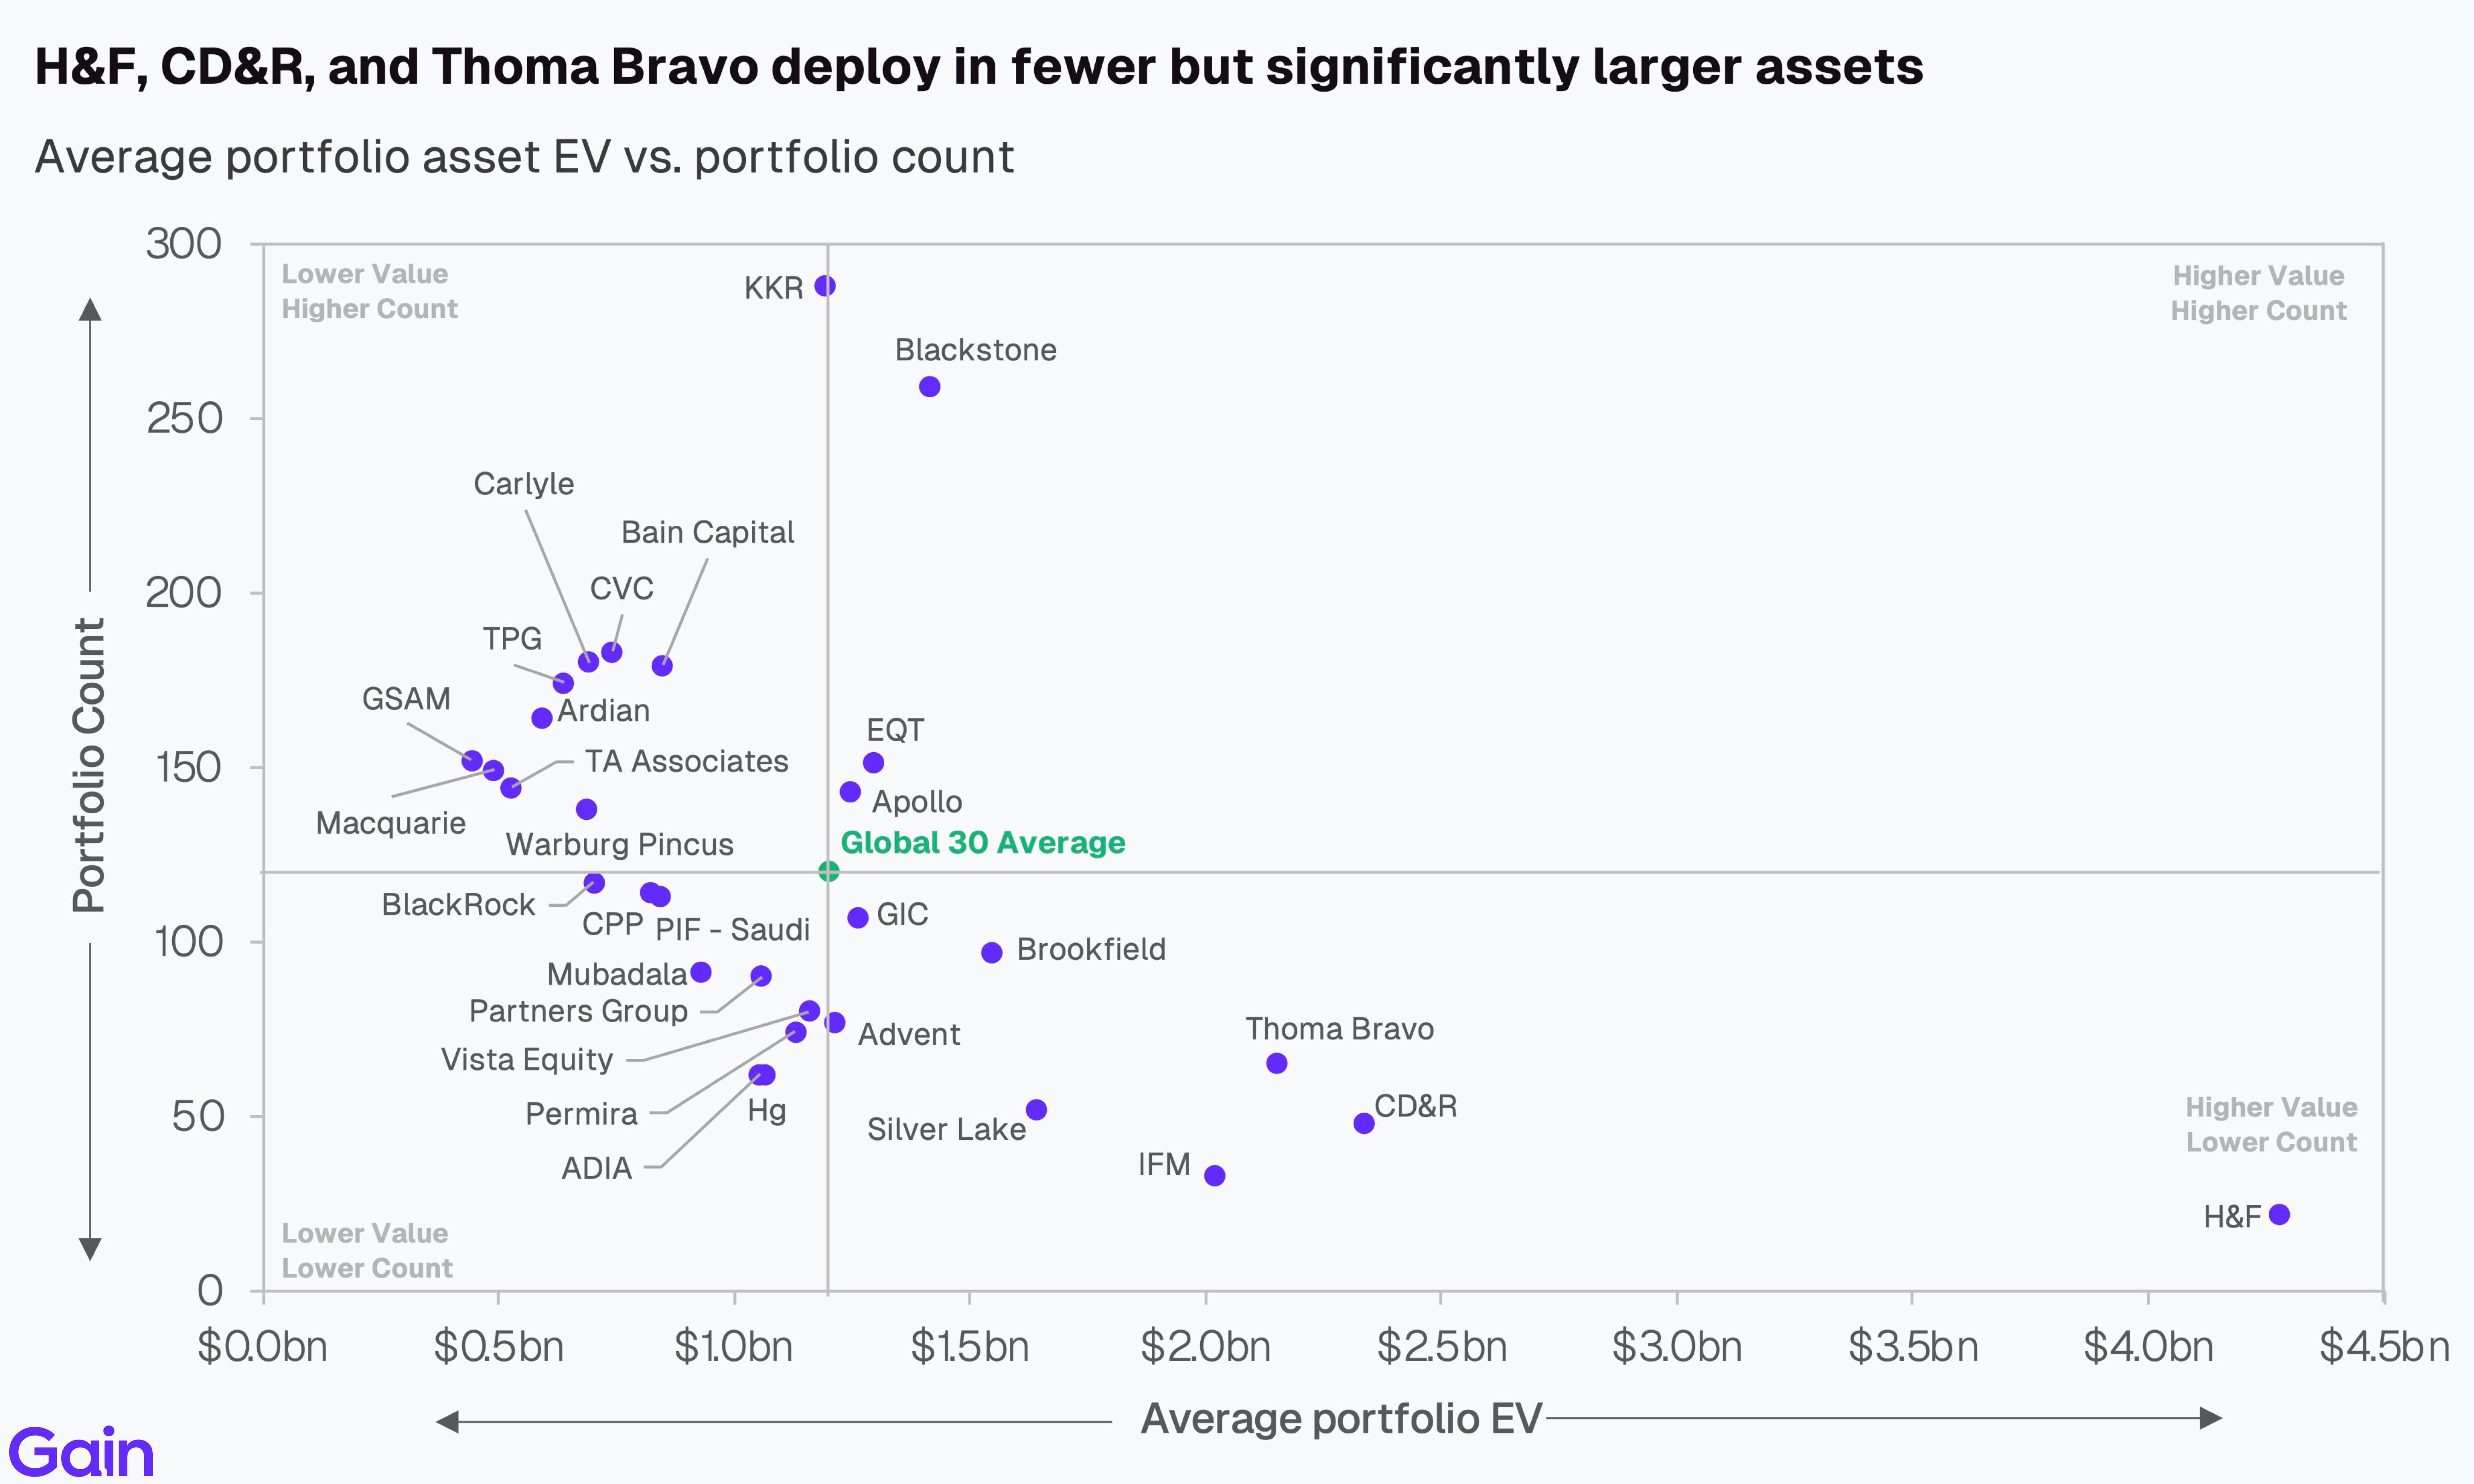
H&F, CD&R, and Thoma Bravo deploy into fewer but significantly larger assets. Blackstone, EQT, Apollo, and KKR combine above-average asset size with a high portfolio count. Most other investors have an average ticket size below $1bn EV, with varying portfolio counts.
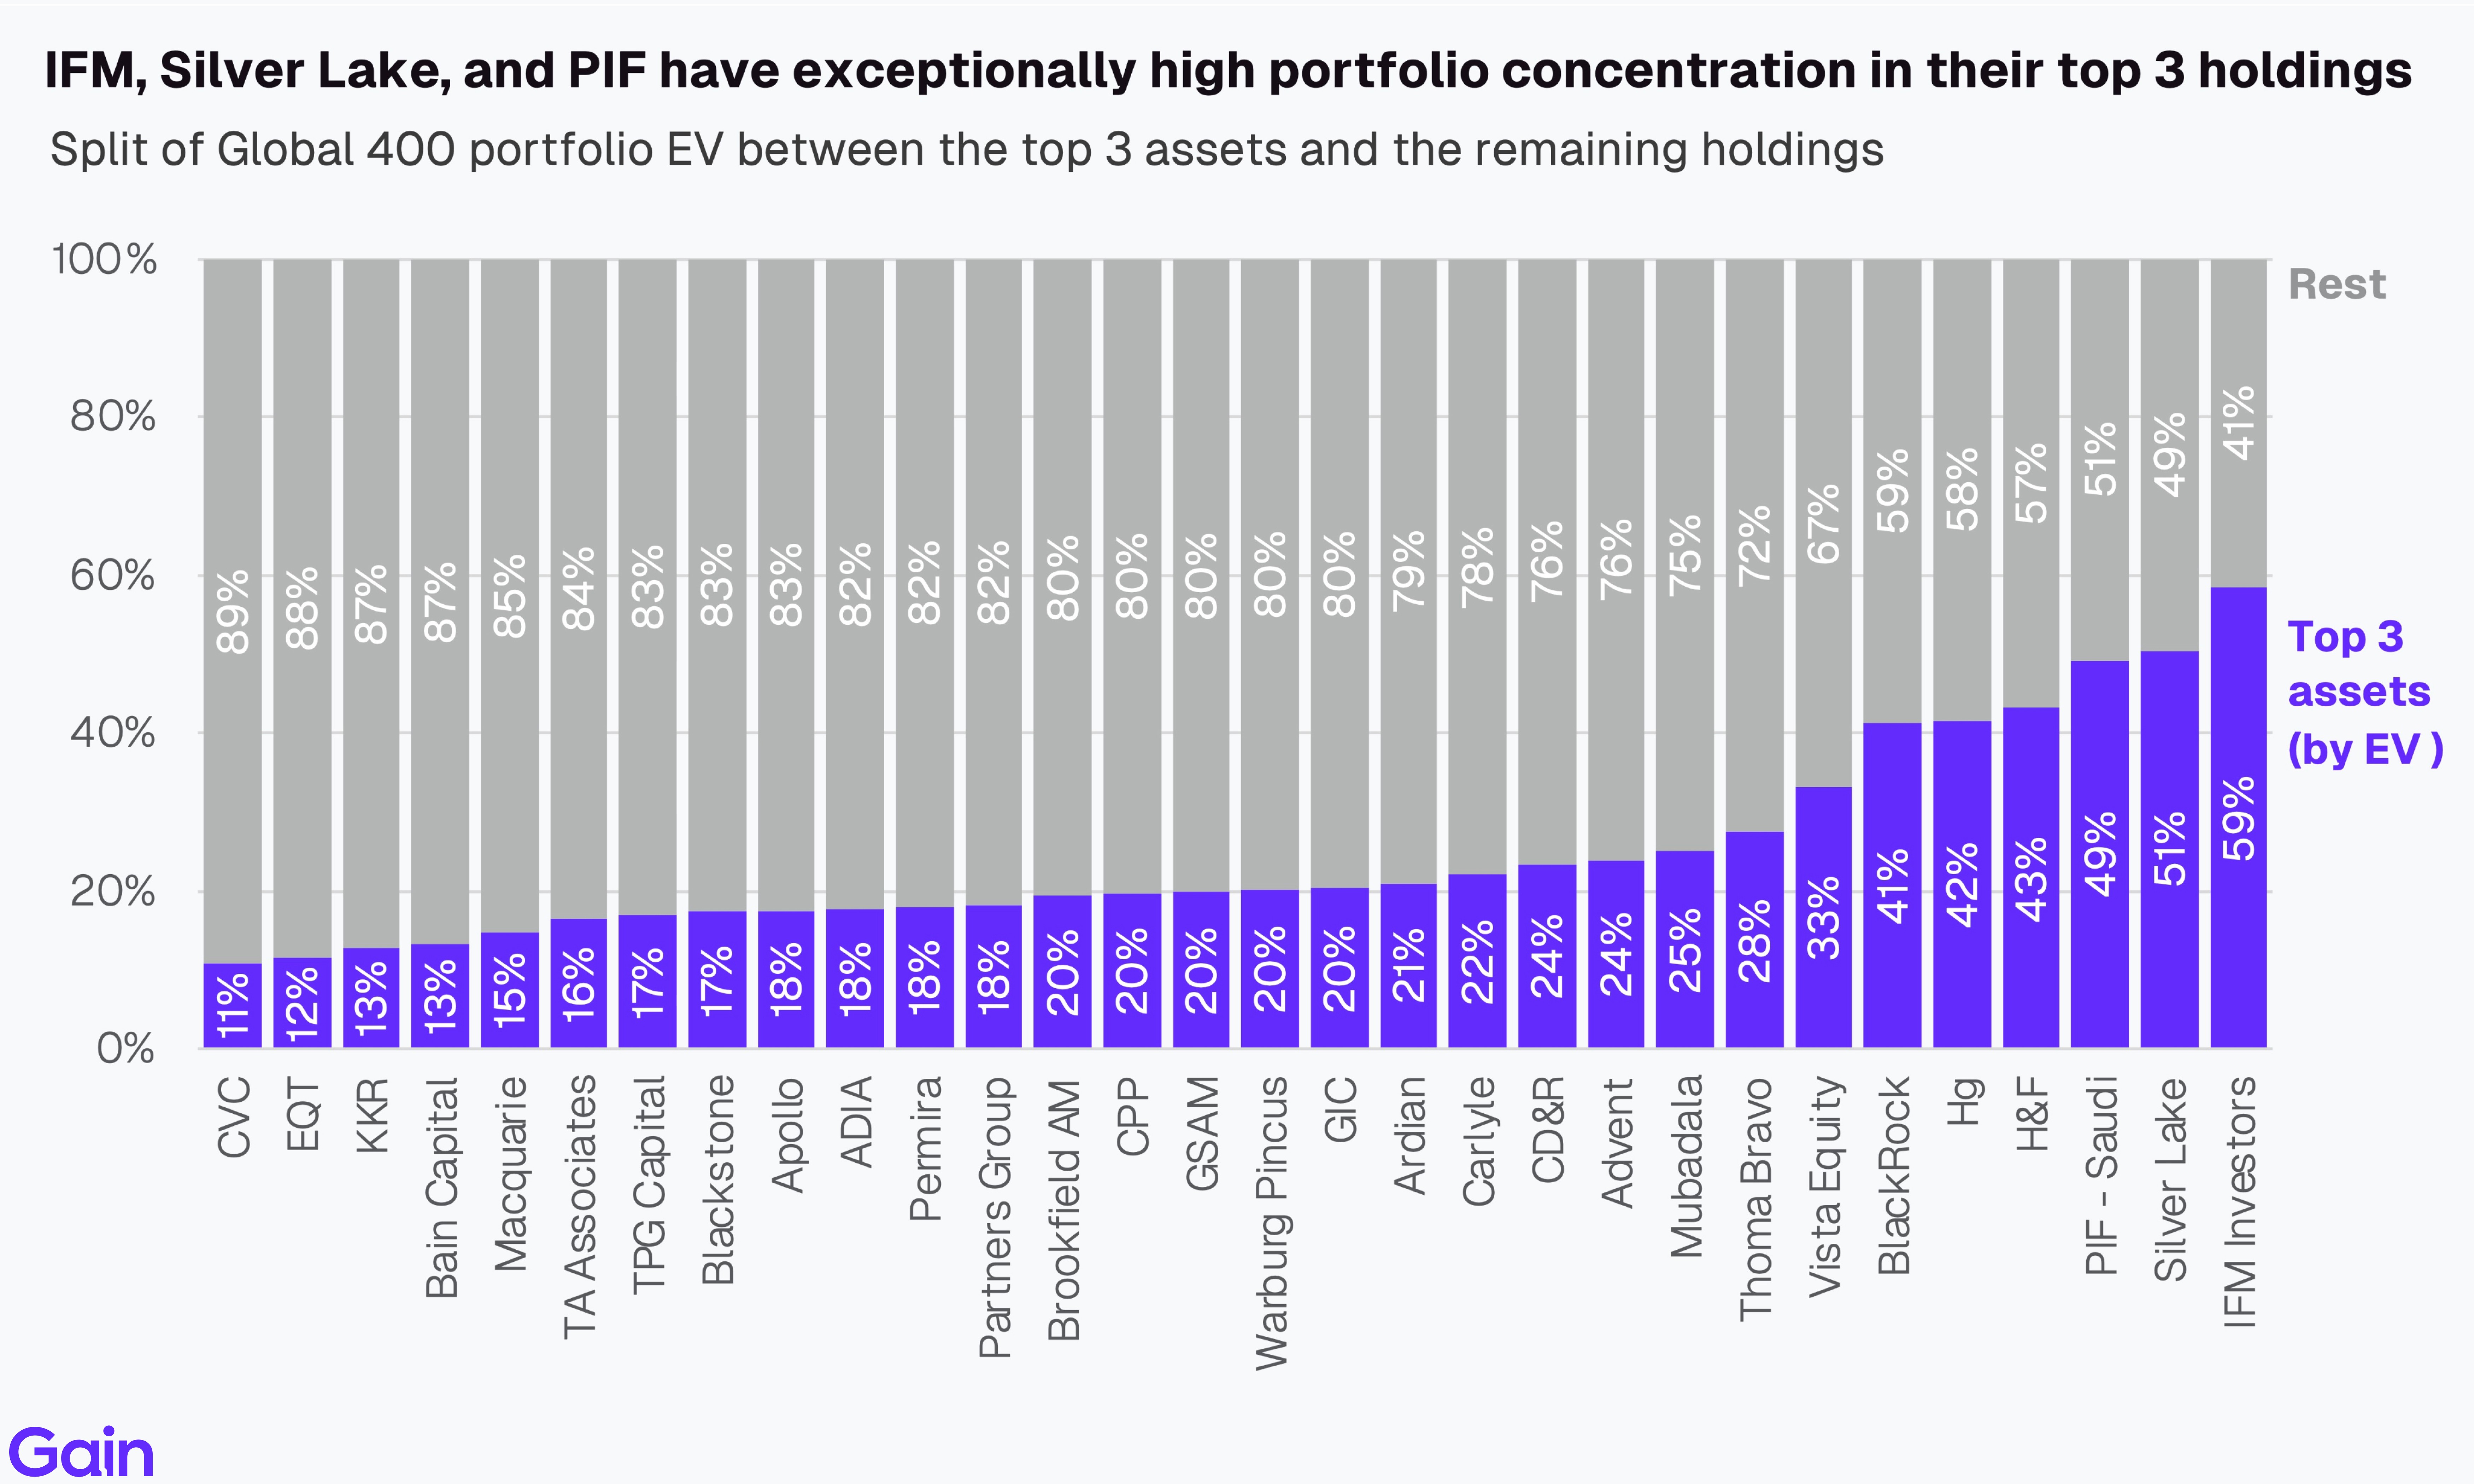
IFM Investors (59%), Silver Lake (51%), and PIF (49%) have exceptionally high portfolio concentration in their top 3 holdings. In contrast, CVC (11%), EQT (12%), and KKR (13%) show the lowest portfolio concentration, with top 3 holdings representing less than 15% of their total EV, reflecting their broad and diversified portfolio approach.
The preference for minority versus majority stakes differs among the top investors. A few sovereign wealth funds and pension funds, such as ADIA, CPP, GIC, and Mubadala, alongside large multi-asset investors such as BlackRock and Goldman Sachs, lean heavily toward minority stakes. In contrast, PIF Saudi, Thoma Bravo, CD&R, and EQT are mostly majority-focused.

Deal Activity
Over the last 7-year period, KKR, Blackstone, and Carlyle led global PE entry activity with 277, 216, and 182 entries, respectively. Entry activity peaked in 2021 followed by softening in 2022-23 amid challenging market conditions. Activity has rebounded since then in 2024-25.

Sponsor-to-sponsor transactions remain the dominant entry route type across investors. TMT specialists Thoma Bravo (73%), Vista Equity (57%), and Silver Lake (53%) stand out as large take-private investors, reflecting their focus on listed technology assets. IFM Investors (59%) also exhibits significant take-private activity. Meanwhile, Macquarie (38%) and CD&R (32%) show the high contribution from carve-outs, driven by their focus on Infrastructure and Industrials, respectively.

Most of the top PE investors are not as active in venture capital. Exceptions include GSAM, Bain Capital, EQT, BlackRock, and OMERS, who have a notable VC portfolio alongside their PE investments. In contrast, KKR, Blackstone, and CVC focus predominantly on buyouts with minimal VC activity.

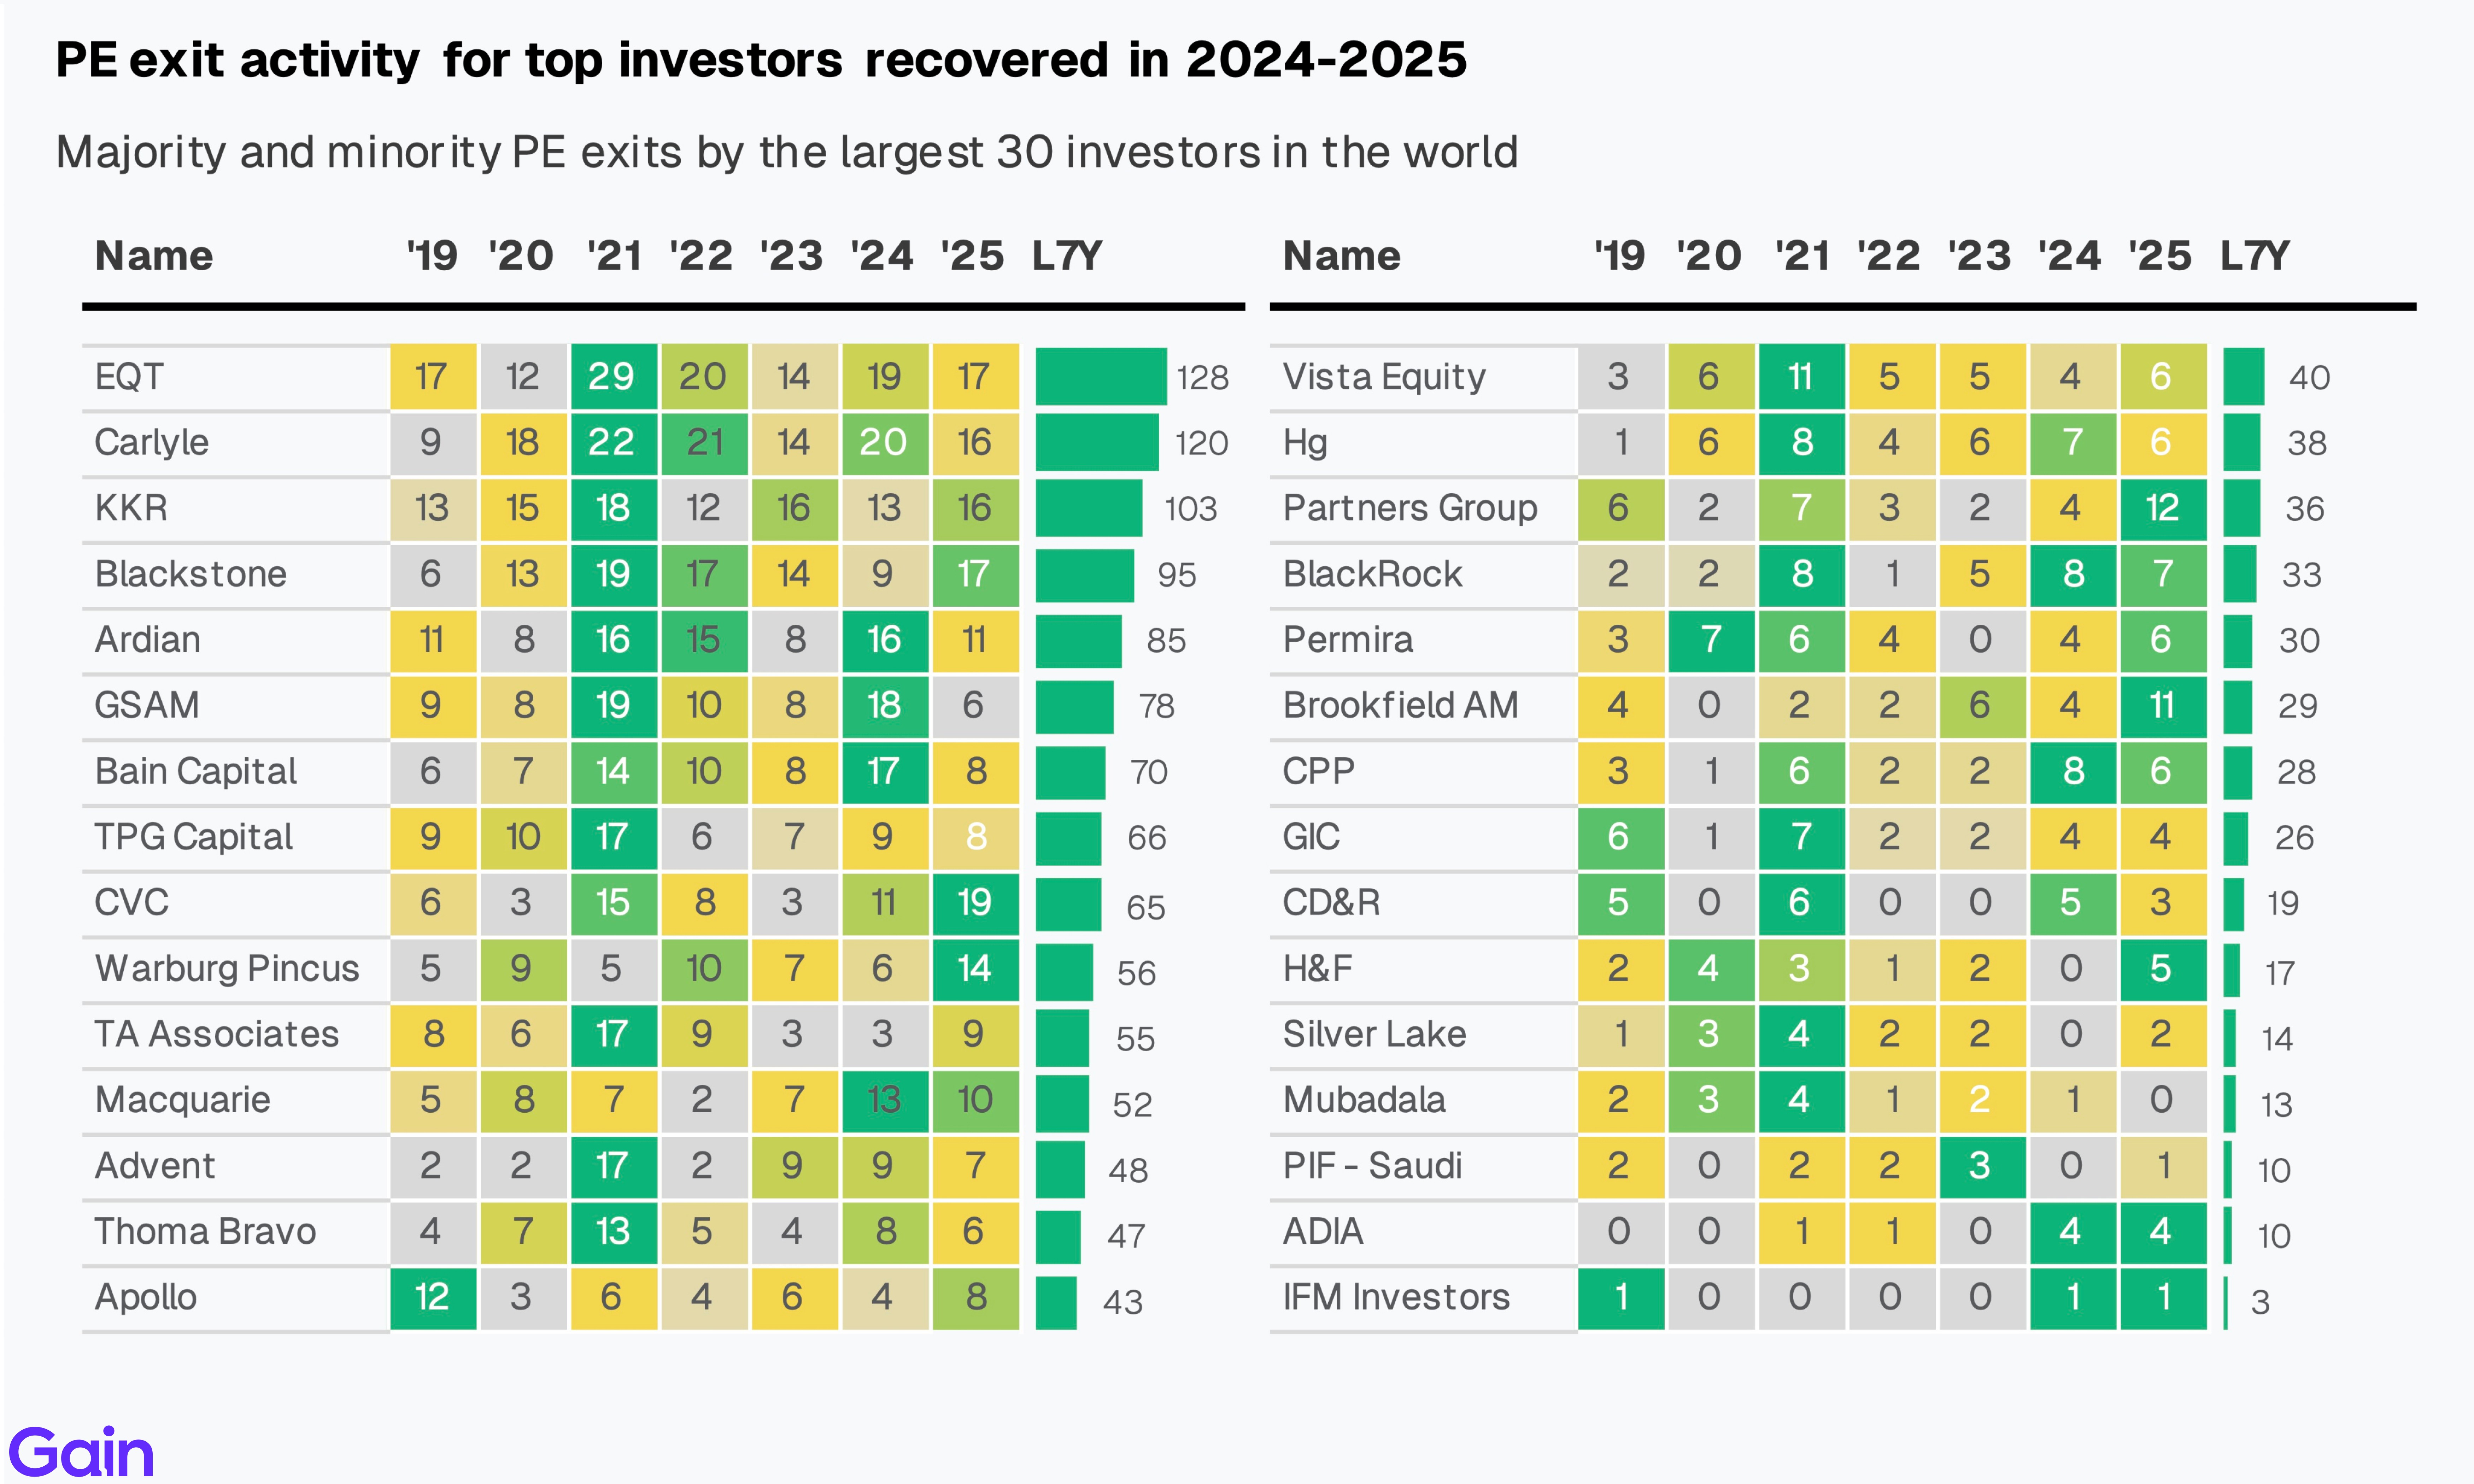
CVC (19), EQT (17), Blackstone (17), Carlyle (16), and KKR (16) were among the most active in the exit markets by count in 2025. Broadly, exits peaked in 2021 before declining in 2022-2023 as market conditions deteriorated, but activity has recovered moderately in 2024-2025.
Holding Periods
TA Associates, CD&R, and Thoma Bravo tend to have shorter holding periods, with a median of approximately 4 years. In contrast, Macquarie, Goldman Sachs Asset Management, and Permira with a median of around 6-7 years.

IFM Investors, Ardian, and Blackstone have portfolios with a higher share of mature investments, with over 22% of investments tied to platform deals made more than five years ago. In contrast, investors like Hg, ADIA and TA Associates have portfolios more heavily weighted toward recent acquisitions.

Buy-and-Build
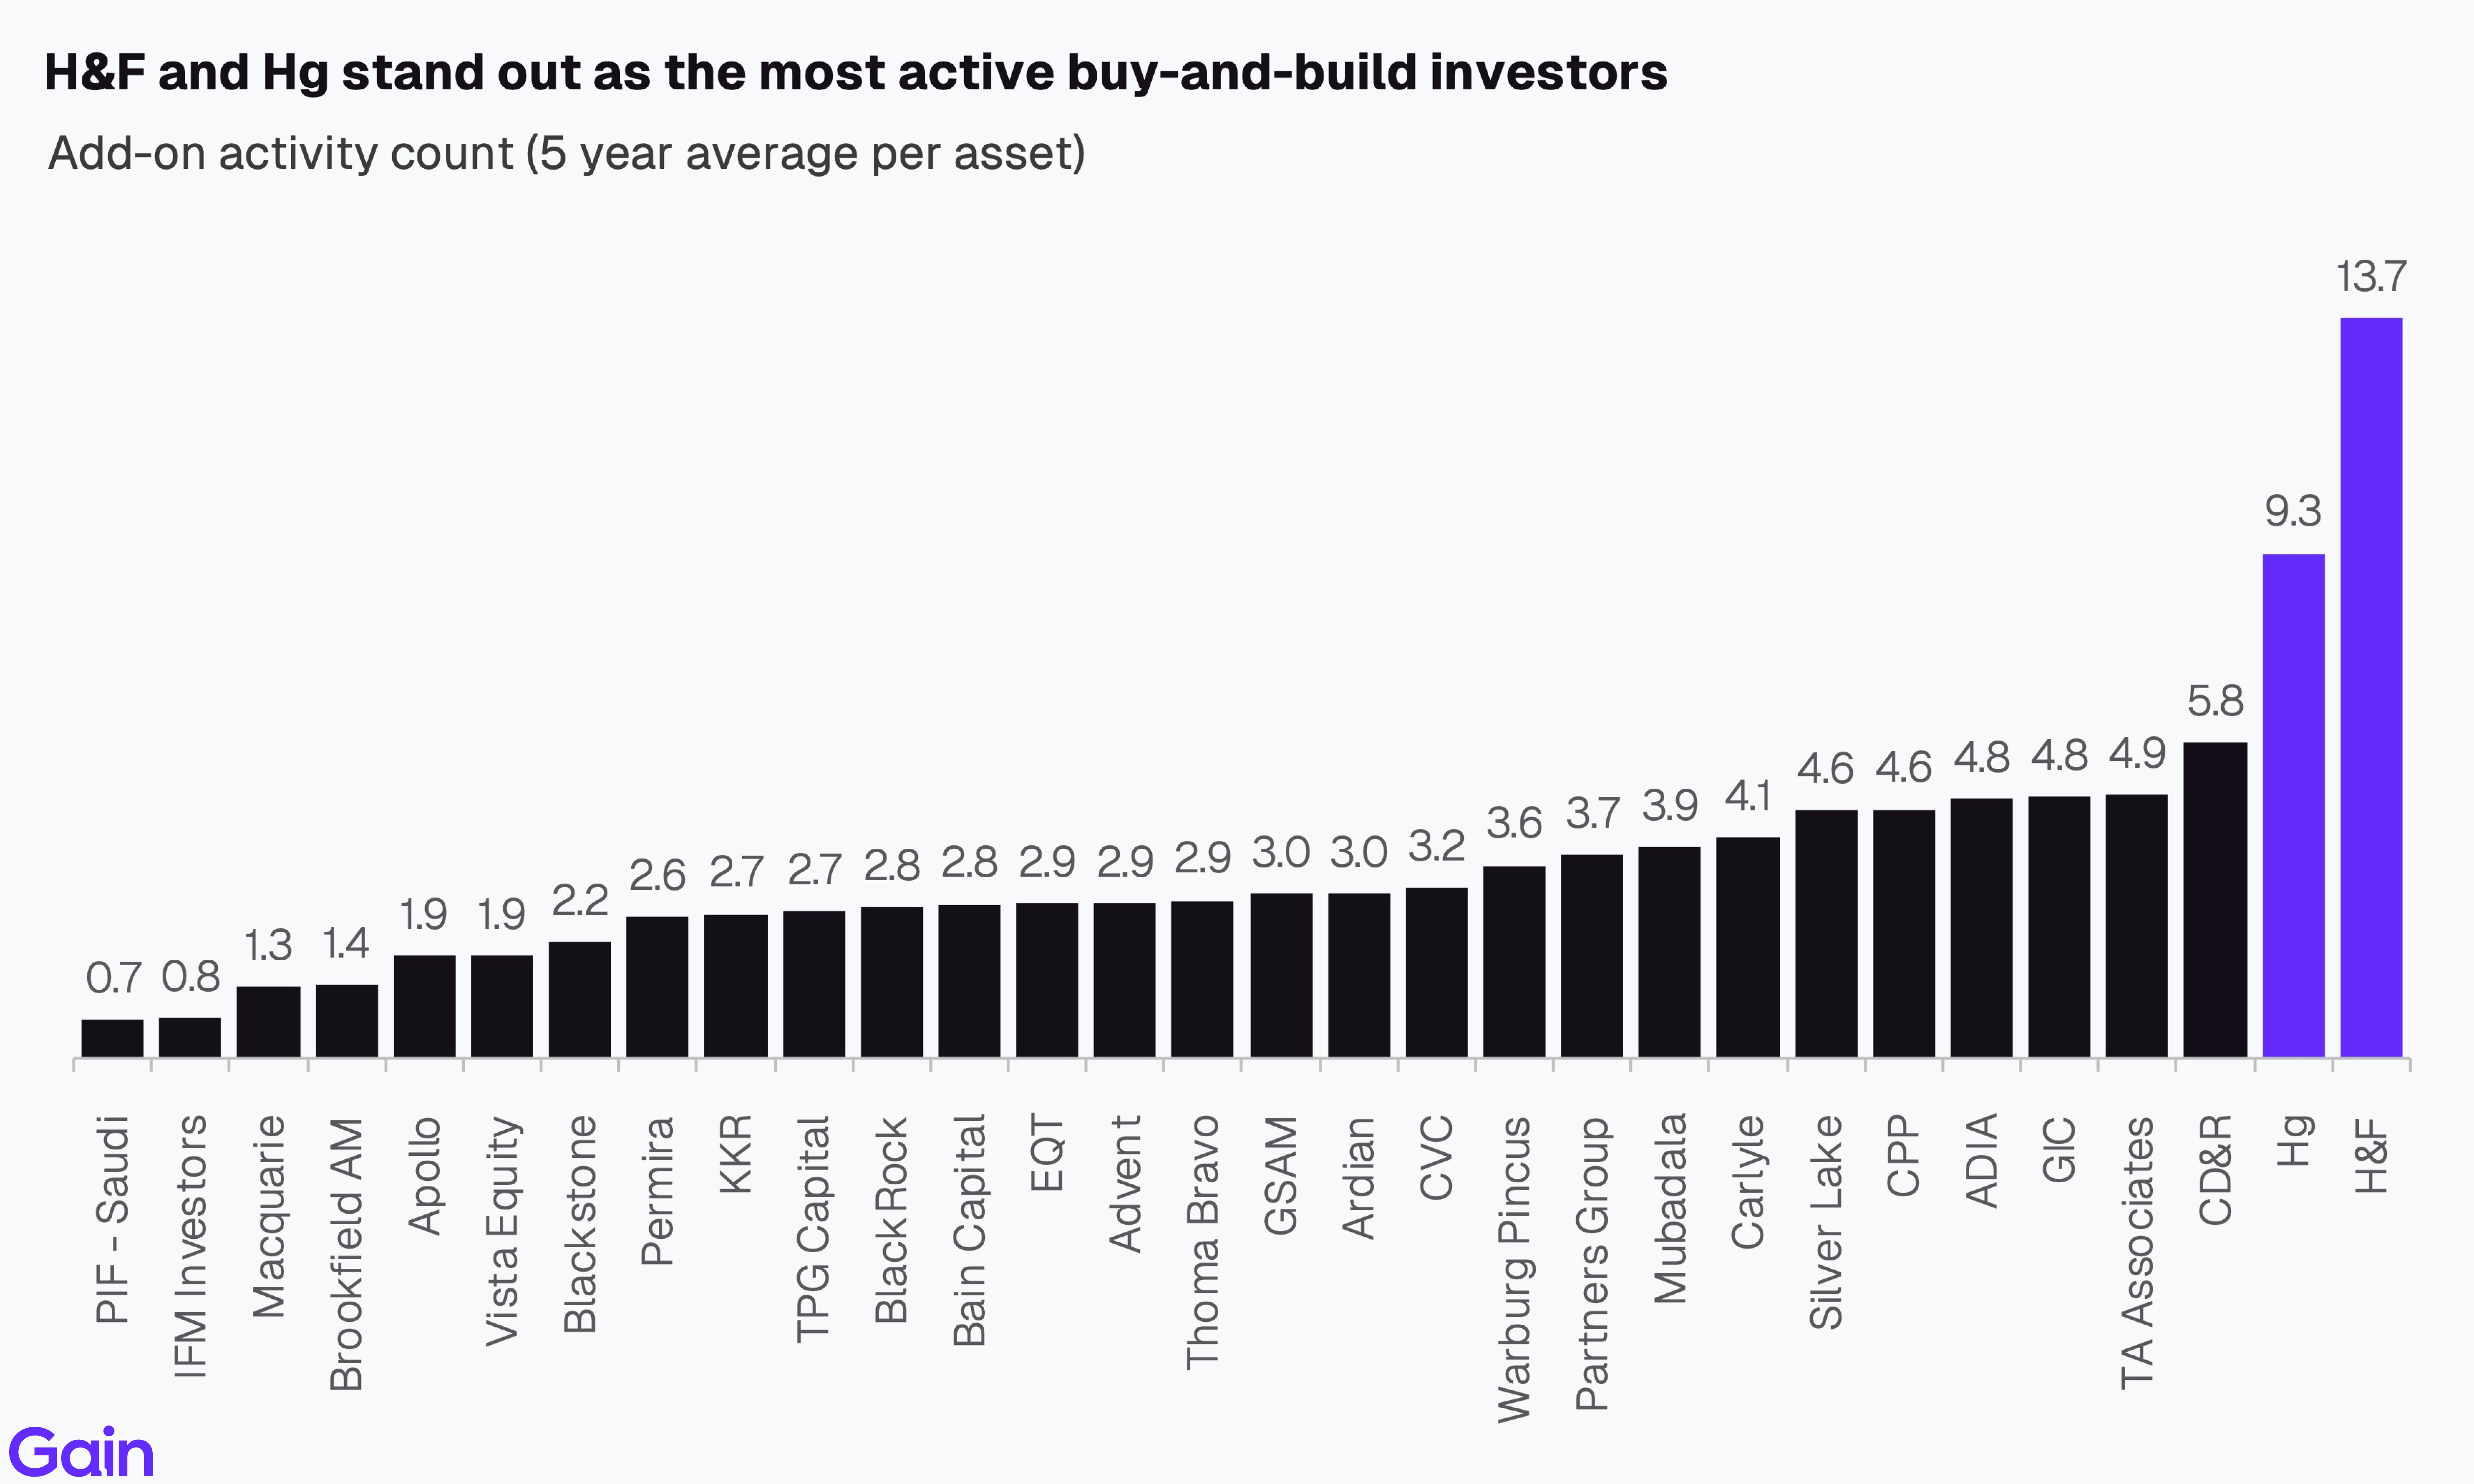
TA Associates, Hg, and KKR lead global PE-backed add-on activity with 726, 565, and 560 add-ons, respectively, since entry. Carlyle (483), CVC (433), and GIC (430) are also active consolidators. In contrast, IFM Investors (24), PIF (60), and Brookfield AM (91) show limited add-on activity.

Normalized for number of assets, H&F and Hg stand out as the most active buy-and-build investors, averaging 13.7 and 9.3 add-ons per asset, respectively, well ahead of the broader peer group. Buy-and-build has become a core value creation strategy across the industry; for example, Visma, one of Europe’s largest PE-backed holdings owned by Hg, has completed more than 100 acquisitions over the past five years.
By Growth Rates & Margin
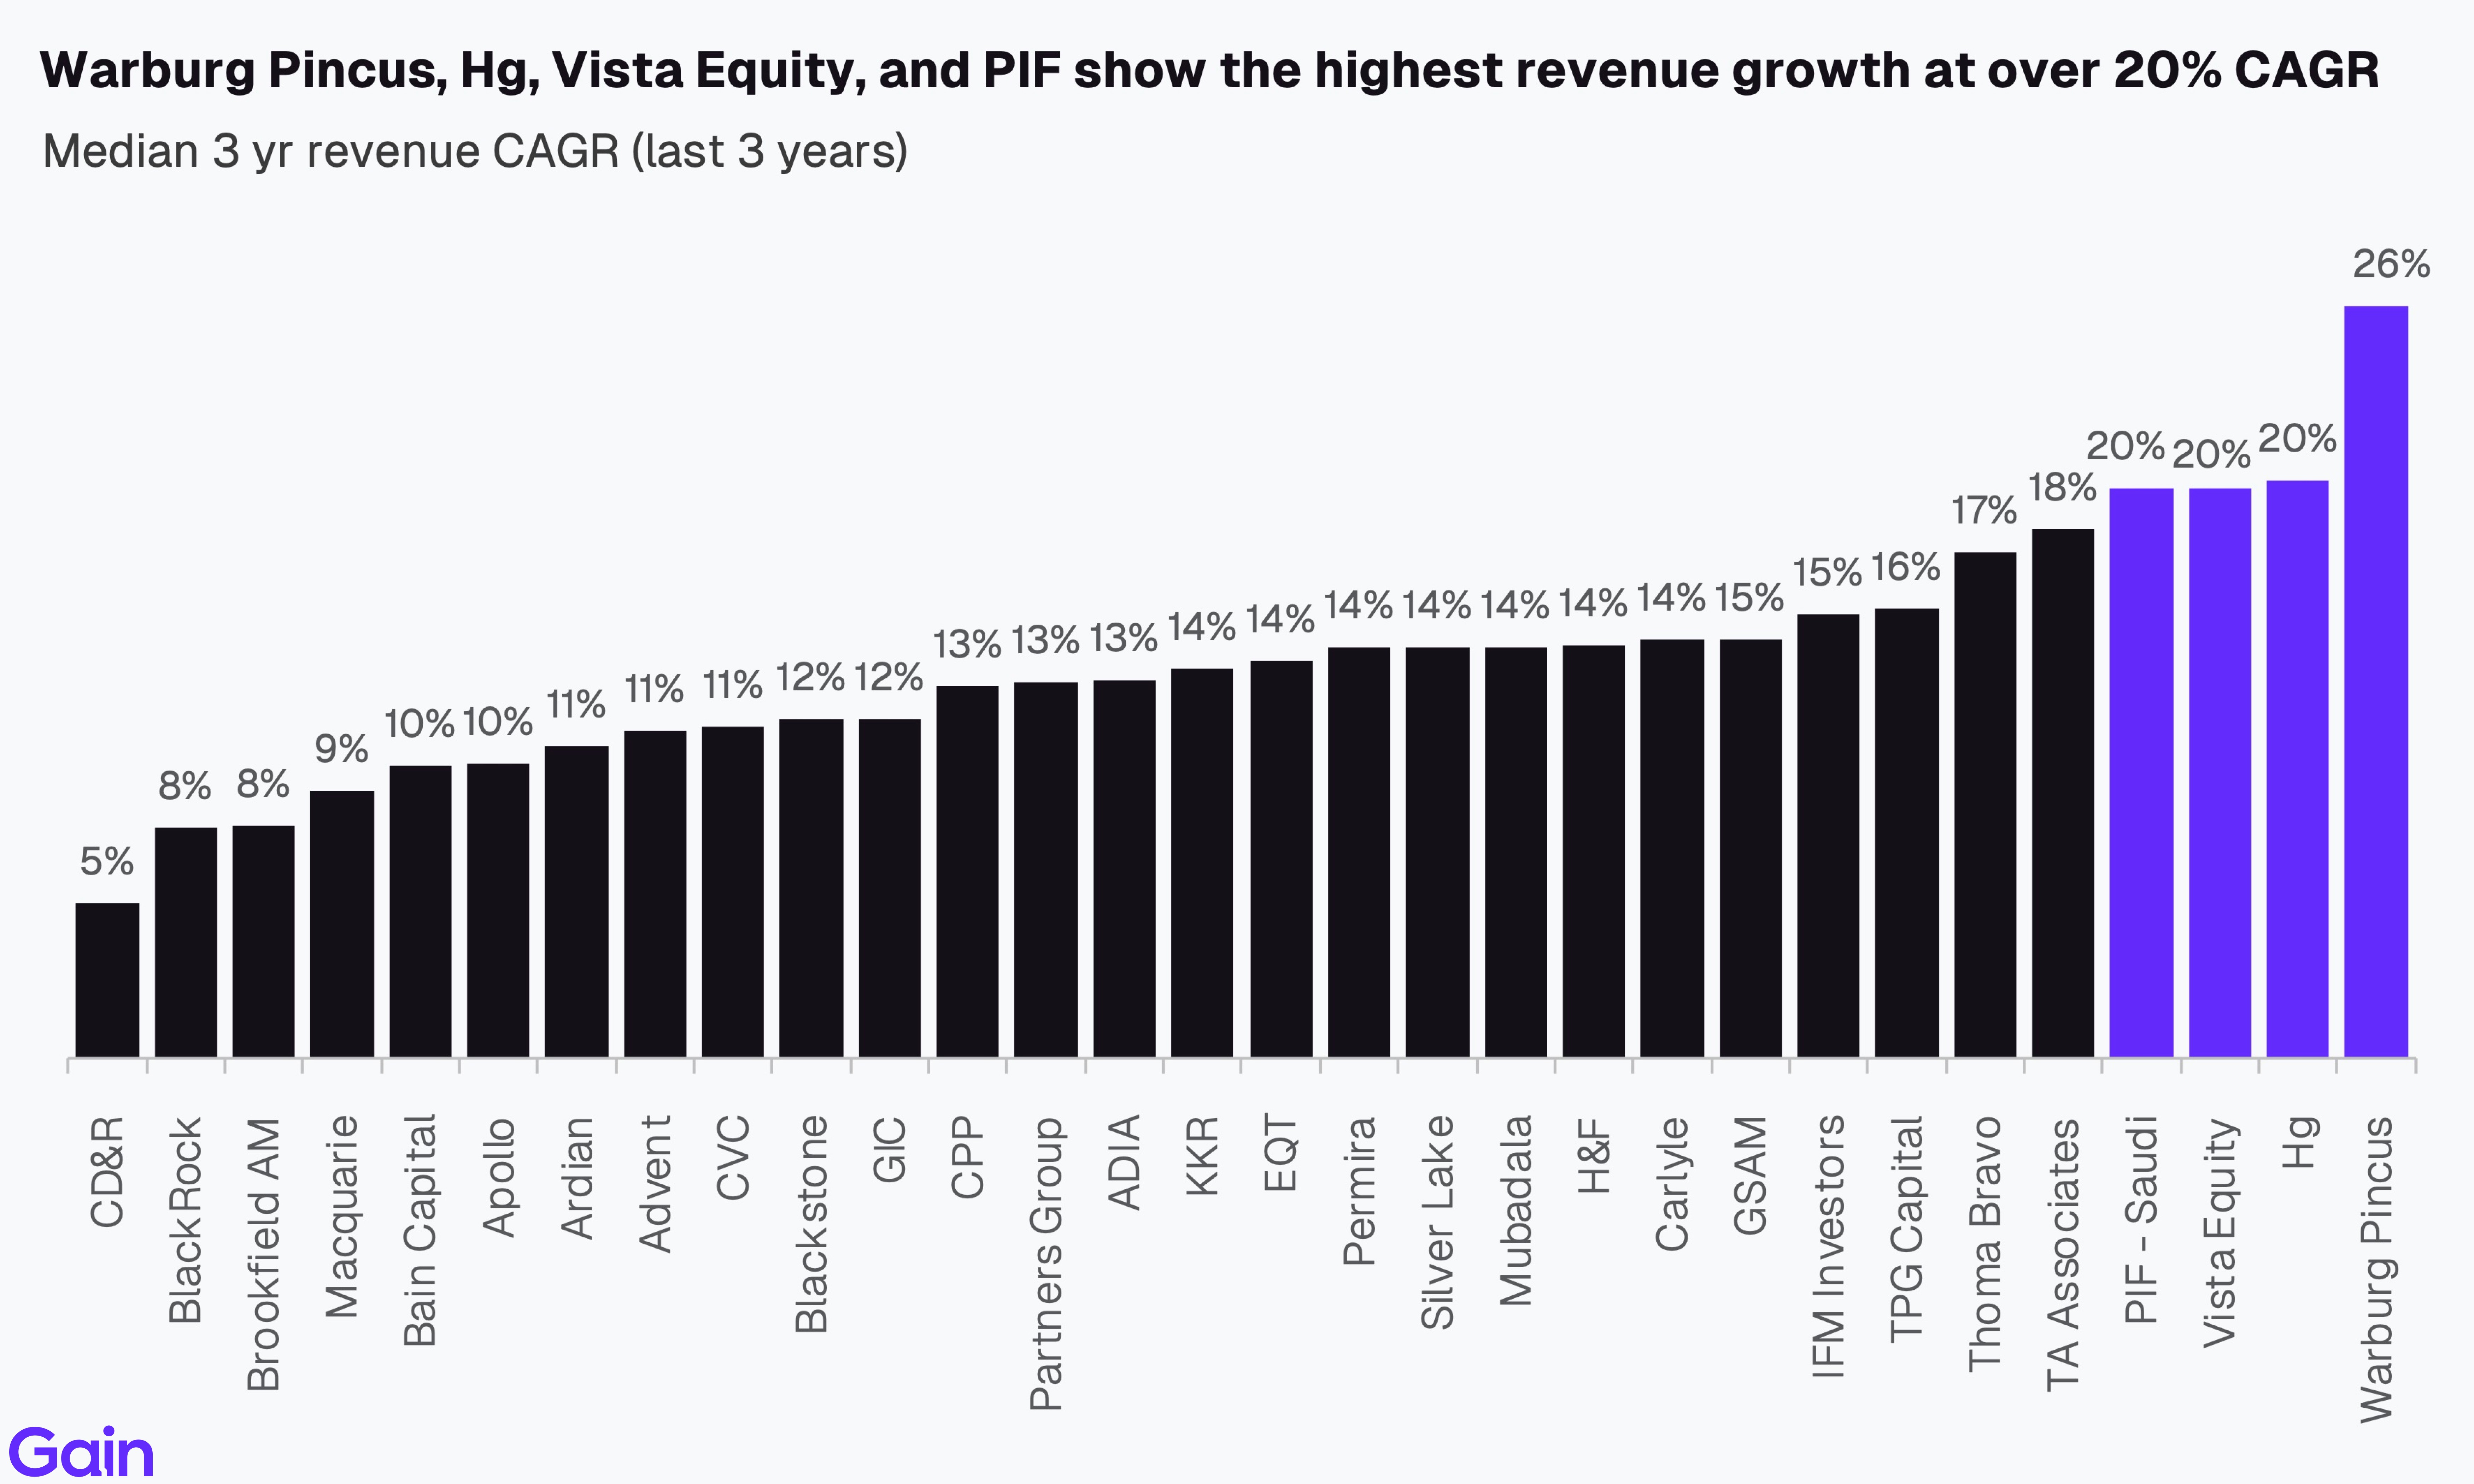
Warburg Pincus, Hg, Vista Equity, and PIF Saudi have the highest revenue growth in their portfolio (>20% CAGR), driven largely by TMT exposure. In contrast, CD&R, BlackRock, and Brookfield Asset Management show lower growth due to higher exposure to mature and slower-growing Infrastructure, Industrials, and Energy assets.
Hg, TA Associates, Vista Equity, and Warburg Pincus stand out as investors with high-growth, high-margin portfolios, reflecting their concentration in fast-growing TMT assets. IFM Investors shows the highest margins overall, driven by its focus on Infrastructure. CD&R and Bain Capital, in contrast, exhibit lower growth and margins relative to the Global 400 median, reflecting their focus on the slower-growing Industrials and Consumer sectors.

The top 30 investors collectively employ 4.9m FTEs, representing 32% of total Global 400 employment of 15.2m FTEs. KKR, CD&R, and Apollo lead in absolute employment figures (>400k FTEs each), partially reflecting their portfolio concentration in labor-intensive sectors such as retail and consumer.

Methodology
The data for this report comes from Gain.
We take a novel approach to our ranking, which is based on total managed enterprise value (EV). At Gain, we track over 23,200 investor portfolios in detail.
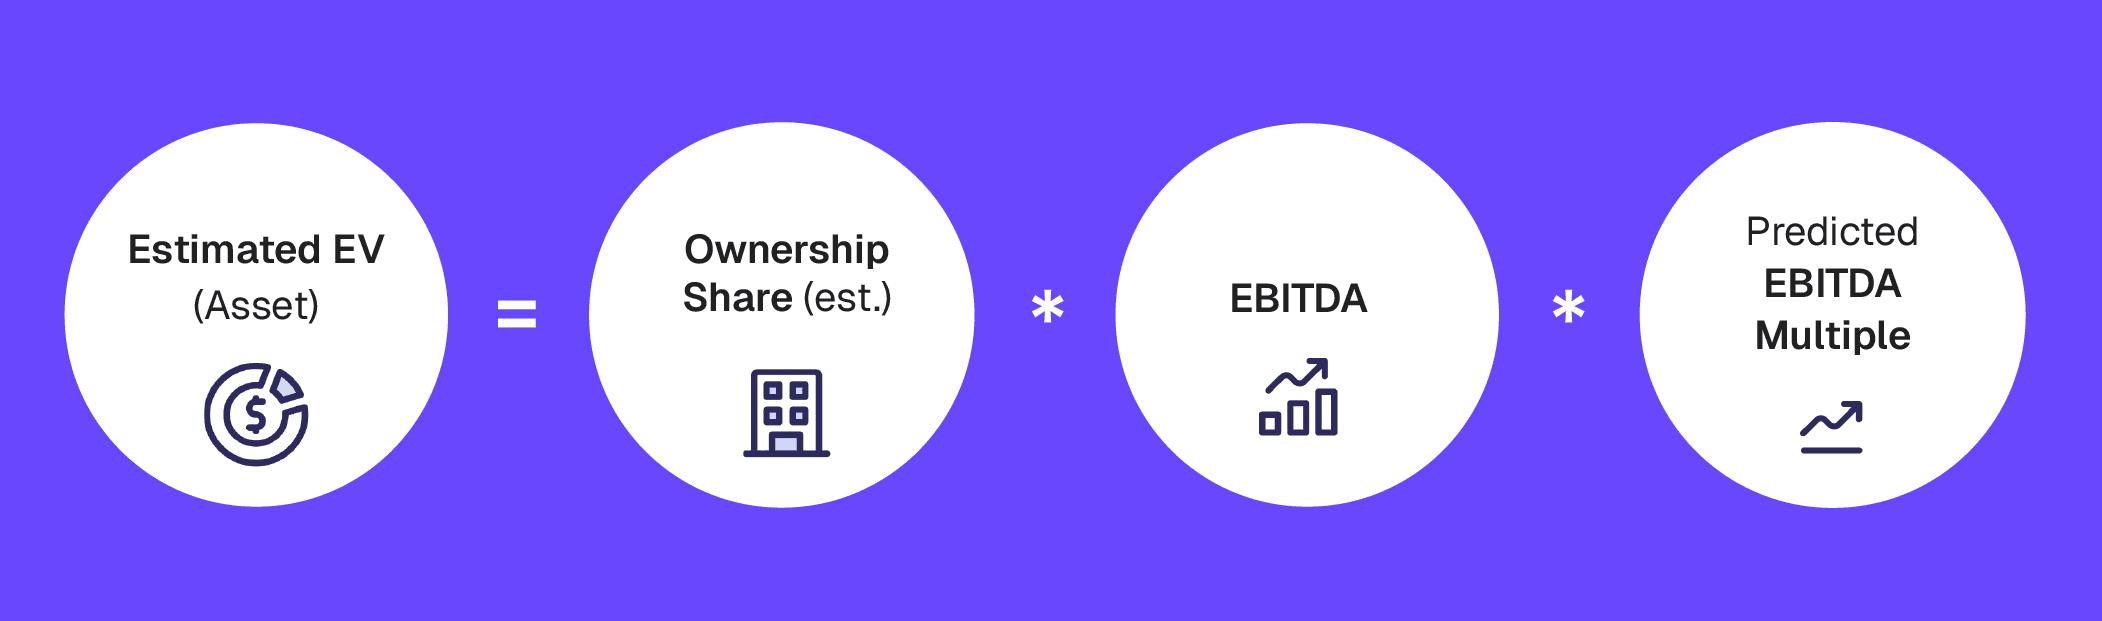
To estimate the managed enterprise value (EV), we estimate the EV for each asset in an investor’s portfolio. We begin with the latest reported deal value, where publicly available. We scale the last reported deal value by a growth multiplier to estimate its current holding value. We also adjust EV for the investor's estimated ownership share in an asset.
If the last reported deal value is not available, we estimate the EV by multiplying EBITDA by the predicted exit multiple. The total EV is then aggregated asset-by-asset at the investor level.
Where there aren't reported deal figures or financials, we estimate them using the asset's revenue, subsector margins, and revenue/FTE calculations.
We only consider majority buyout and minority-owned PE assets for our rankings. We exclude any VC investments, publicly listed stakes, and fully government-owned entities. To predict exit multiples, we consider an asset’s sector, size, growth rate, margin profile, and cash generation.
Further, we include only active investors in the Global 400 ranking with i) 5 or more portfolio companies across the globe and ii) 4 or more entries since 2020
For the sector rankings, we include investors with i) 3 or more portfolio companies in that sector and ii) 3 or more entries in that sector since 2020
Unless otherwise stated, all metrics and calculations are based on an investor's global PE portfolio. We excluded investors with <5 data points for any aggregate metrics in the portfolio insights section.
Related Research
Discover our proprietary reports on investors, assets and PE deals.