Europe 250 Report
Ranking the largest private equity investors in Europe
2026 Edition
Executive Summary
In this report, we rank and analyze the largest and most active private equity (PE) investors in Europe.
We take a novel approach to our ranking, which is based on total managed enterprise value (EV) in Europe. Ranking by managed EV, rather than funds raised, enables us to focus on investors’ European portfolio, allowing us to dive deep into specific regions and sectors of investment.
Further, this approach helps us capture large and active investors who do not follow traditional fundraising cycles/structures and are often overlooked.
Key takeaways from our analysis:
KKR has emerged as the #1 investor in Europe, managing a total estimated EV of €104bn, followed by EQT (€90bn) and CVC (€83bn). Other investors in the top 10 include Blackstone (€81bn), Ardian (€60bn), Partners Group (€55bn), Hg (€54bn), Carlyle (€50bn), GIC (€48bn) and Brookfield Asset Management (€46bn).
Collectively, the top 250 private equity firms in Europe manage an EV of €2.5tn across 5,803 assets. Despite its significant size, the aggregated Europe 250 EV is just 11% of the ~€23 trillion Europe’s public equity market.
Leading the sector rankings are Hg (TMT), KKR (Services), EQT (Science & Health), Carlyle (Energy & Materials), Triton (Industrials), GIC (Financial Services) and 3i Group (Consumer). Consumer and TMT stand out as the sectors with the most number of sector specialists.
The Europe 250 landscape is concentrated at the upper end, with the top 25 investors managing 48% of the Europe 250 EV. Investors established in the 1990s or before manage 74% of the total EV. US and UK HQ’d investors manage 56% of the aggregate EV.
Leading the regional rankings are KKR (UK&I), Advent (DACH), Ardian (France), 3i Group (Benelux), EQT (Nordics), Blackstone (Italy), Cinven (Iberia) and PPF (CEE). Nordics, CEE and France stand out as the most domestic PE markets in Europe with strong local investor presence.
By deal count, Hg, Waterland, CVC and Ardian have the highest overall PE activity in Europe. CD&R, CVC and KKR rank among the largest employers in Europe while Hg, TA Associates and CPP stand out for their high-growth, high-margin portfolios.
There is a lot more data and charts to explore in the full report. Reach out on insights@gain.ai if you have any questions.


Chapter 01: Europe 250 Ranking
KKR has emerged as the largest private equity investor in Europe, managing a total estimated EV of €104bn, followed by EQT (managing an EV of €90bn) and CVC (€83bn).
Other investors in the top 10 include Blackstone (€81bn), Ardian (€60bn), Partners Group (€55bn), Hg (€54bn), Carlyle (€50bn), GIC (€48bn) and Brookfield Asset Management (€46bn).
Collectively, the top 250 investors in Europe manage an estimated EV of €2.5tn. On average, they have a portfolio EBITDA of €100m and manage 29 companies each.
Over the last 6 years, Europe 250 investors have invested in nearly twice as many new portfolio companies as they have exited. Specifically, there have been 6,136 new investments and 3,165 exits among these sponsors.
The table below lists all the top 250 investors in Europe. Use the search bar or the arrows at the top to navigate through the ranking.

Dominant Investor HQs
European HQ'd investors lead the Europe 250 ranking, managing 59% of the total aggregate EV. North American HQ'd investors are close behind, managing 34% of the aggregate EV. Activity from North American investors is predominantly focused on larger assets.

By country, US and UK investors dominate the Europe 250 ranking. Sponsors headquartered in those countries manage an EV of €746bn (30% share) and €636bn (26%), respectively. German-based investors are underrepresented in the ranking despite Germany being Europe's largest economy, managing an EV of €54bn (2%).

By city, London is the largest hub for the Europe 250 investors, followed by Paris, New York, Munich and Stockholm. The largest 3 metropolises constitute ~44% of all HQs followed by the long tail of other large European and North American cities.

Chapter 02: Sector 50 Rankings
This table showcases the top 50 private equity firms ranked by sector in the US. Use the buttons to navigate between the different sector rankings.

Top Investors
Leading the sector rankings are Hg (TMT), KKR (Services), EQT (Science & Health), Carlyle (Energy & Materials), Triton (Industrials), GIC (Financial Services) and 3i Group (Consumer). Hg in TMT and 3i Group in Consumer predominantly target those sectors, representing 82% and 77% of their portfolio EV, respectively.

Sector Insights
By sector, Services is the largest PE sector in Europe (20% of EV), followed closely by TMT (17%) and Consumer (16%). Combined, these three sectors account for over half of the total Europe PE market EV. At the subsector level, the largest ones are Manufacturing (9%), Software (8%), Professional Services (8%), Energy (7%) and Technical Services (6%).

UK&I is the largest region of investment for most sectors. Its share is highest in Financial Services (59% by EV), Infrastructure (37%), Services (33%), TMT (32%) and Consumer (26%). DACH, on the other hand, dominates in both Industrials and Energy & Materials at 30% and 28%, respectively, reflecting Germany's strong manufacturing and industrials prowess.

Chapter 03: Region 50 Rankings
This table showcases the top 50 private equity firms ranked by region across Europe. Use the buttons to navigate between the regional rankings.

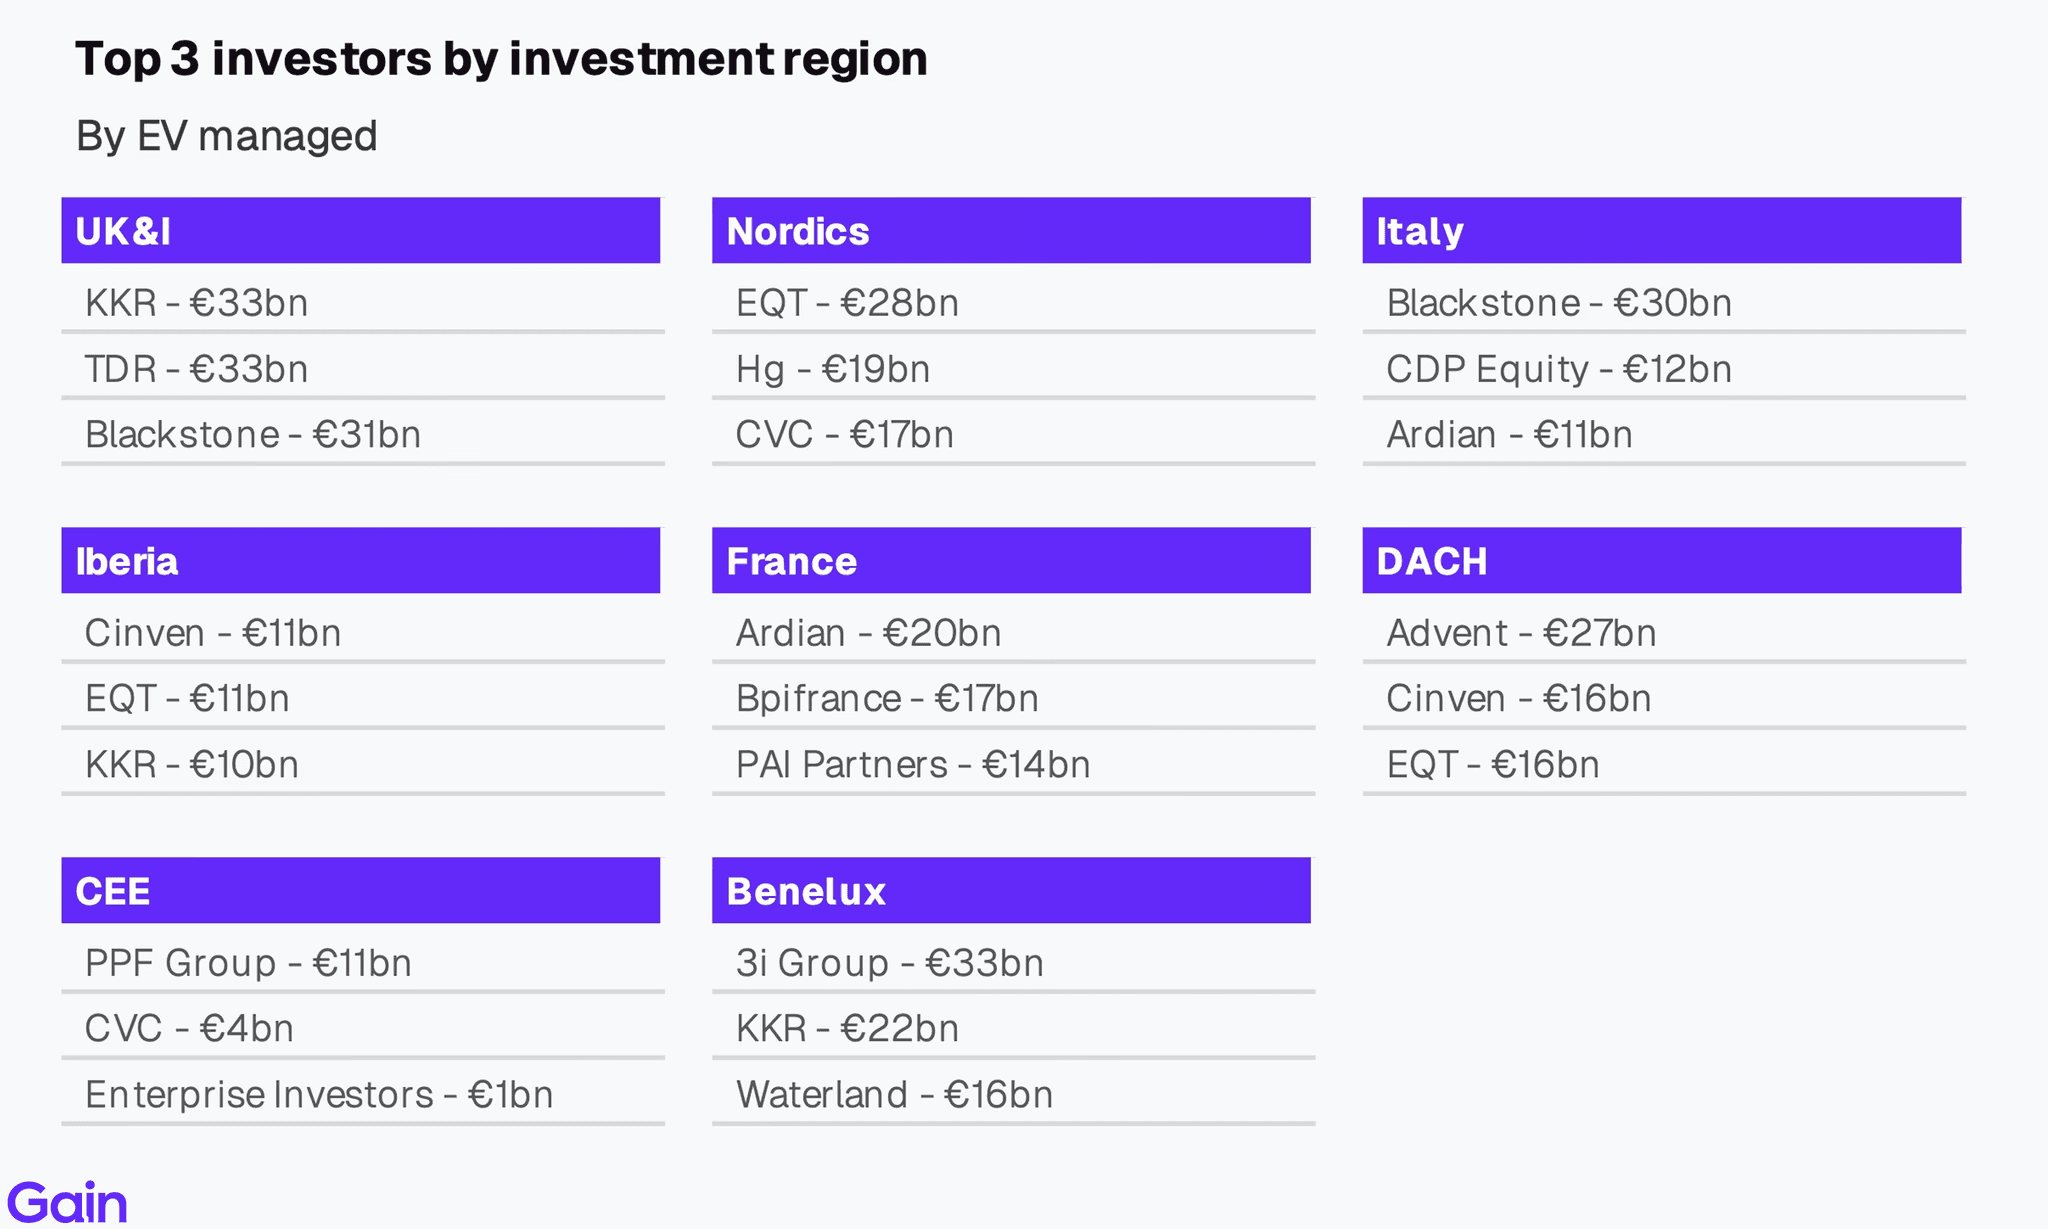
Top Investors
Leading the rankings in each region are KKR (UK&I), Advent (DACH), Ardian (France), 3i Group (Benelux), EQT (Nordics), Blackstone (Italy), Cinven (Iberia) and PPF (CEE). KKR and EQT also stand out as investors with a top 3 presence across multiple regions.
Regional Insights
UK&I (29%), DACH (17%) and France (14%) together account for 60% of European private equity EV. These large regions are followed by Benelux at 12% and Nordics at 11%.

Nordics, CEE and France are the most domestic PE markets in Europe, driven by strong local investor presence. In contrast, UK & Ireland is the most international, with over 43% of EV owned by North American investors. Iberia, Italy and DACH, on the other hand, show significantly lower domestic investor participation with only a handful of large local funds.

Chapter 04: Portfolio Benchmarking
In this section, we explore the investment portfolios of the top 30 PE investors in Europe, analyzing key metrics such as growth rates, profitability, buy-and-build activity, holding periods, EBITDA range and the sector/regional makeup of their European investments.
Note: We exclude from this analysis investors who have fewer than 5 data points for a particular metric.
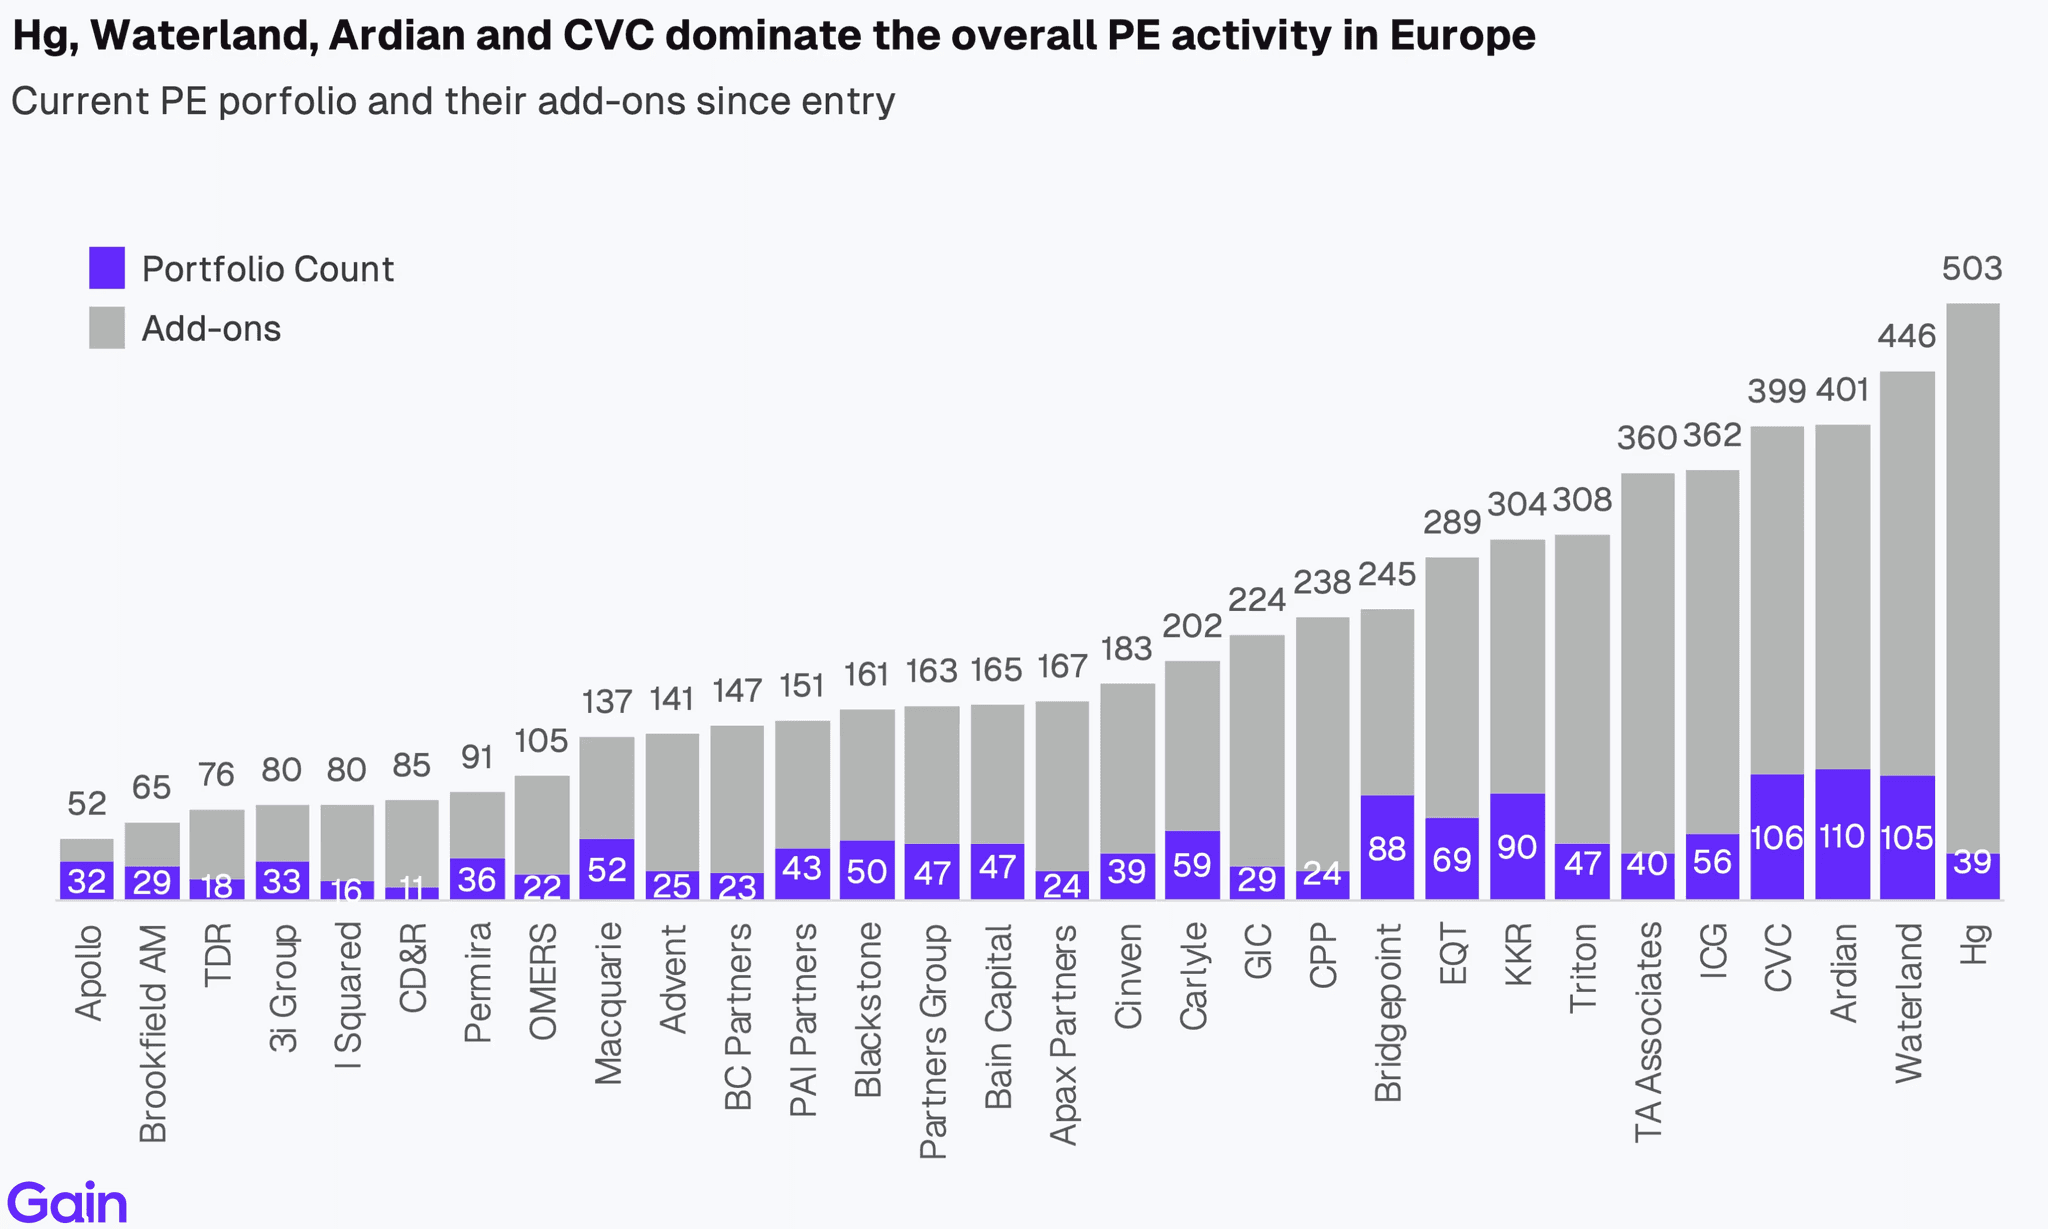
By Deal Activity
Hg, Waterland, CVC and Ardian have the highest overall PE activity in Europe. In addition to their platform investments, they are also among the most active buy-and-build investors in Europe (~300-400 add-ons). In contrast, Apollo, Brookfield Asset Management and TDR Capital pursue a more concentrated strategy with fewer overall transactions.
PE entry activity for top investors is returning to 2021 levels. Entry activity peaked in 2021 followed by softening in 2022-2023 amid challenging market conditions. Activity rebounded in 2024-25 as investors returned to the market. KKR, Bridgepoint and Macquarie were particularly active in 2024-2025, reflecting renewed confidence in European markets. Over the last 7 year period, Ardian, CVC and Waterland led European PE entry activity with 121, 112 and 107 entries, respectively.

CD&R, Blackstone, Hg and TDR Capital stand out as large take-private investors, reflecting their focus on large-scale investments. EQT, Permira, Bridgepoint and CPP Investments are also active in the take-private market. Meanwhile, I Squared Capital, Advent and Triton show significant carve-out concentration at over 40%, driven by their Industrials focus. However, sponsor-to-sponsor transactions remain the most popular entry route across the board.

Related Research
Discover our proprietary reports on investors, assets and PE deals.