Executive Summary
In this report, we go deep into the PE landscape in the US. We share insights on entries, exits, multiples, add-ons, holding periods, growth rates, margins and much more. Here is a summary of our key findings:
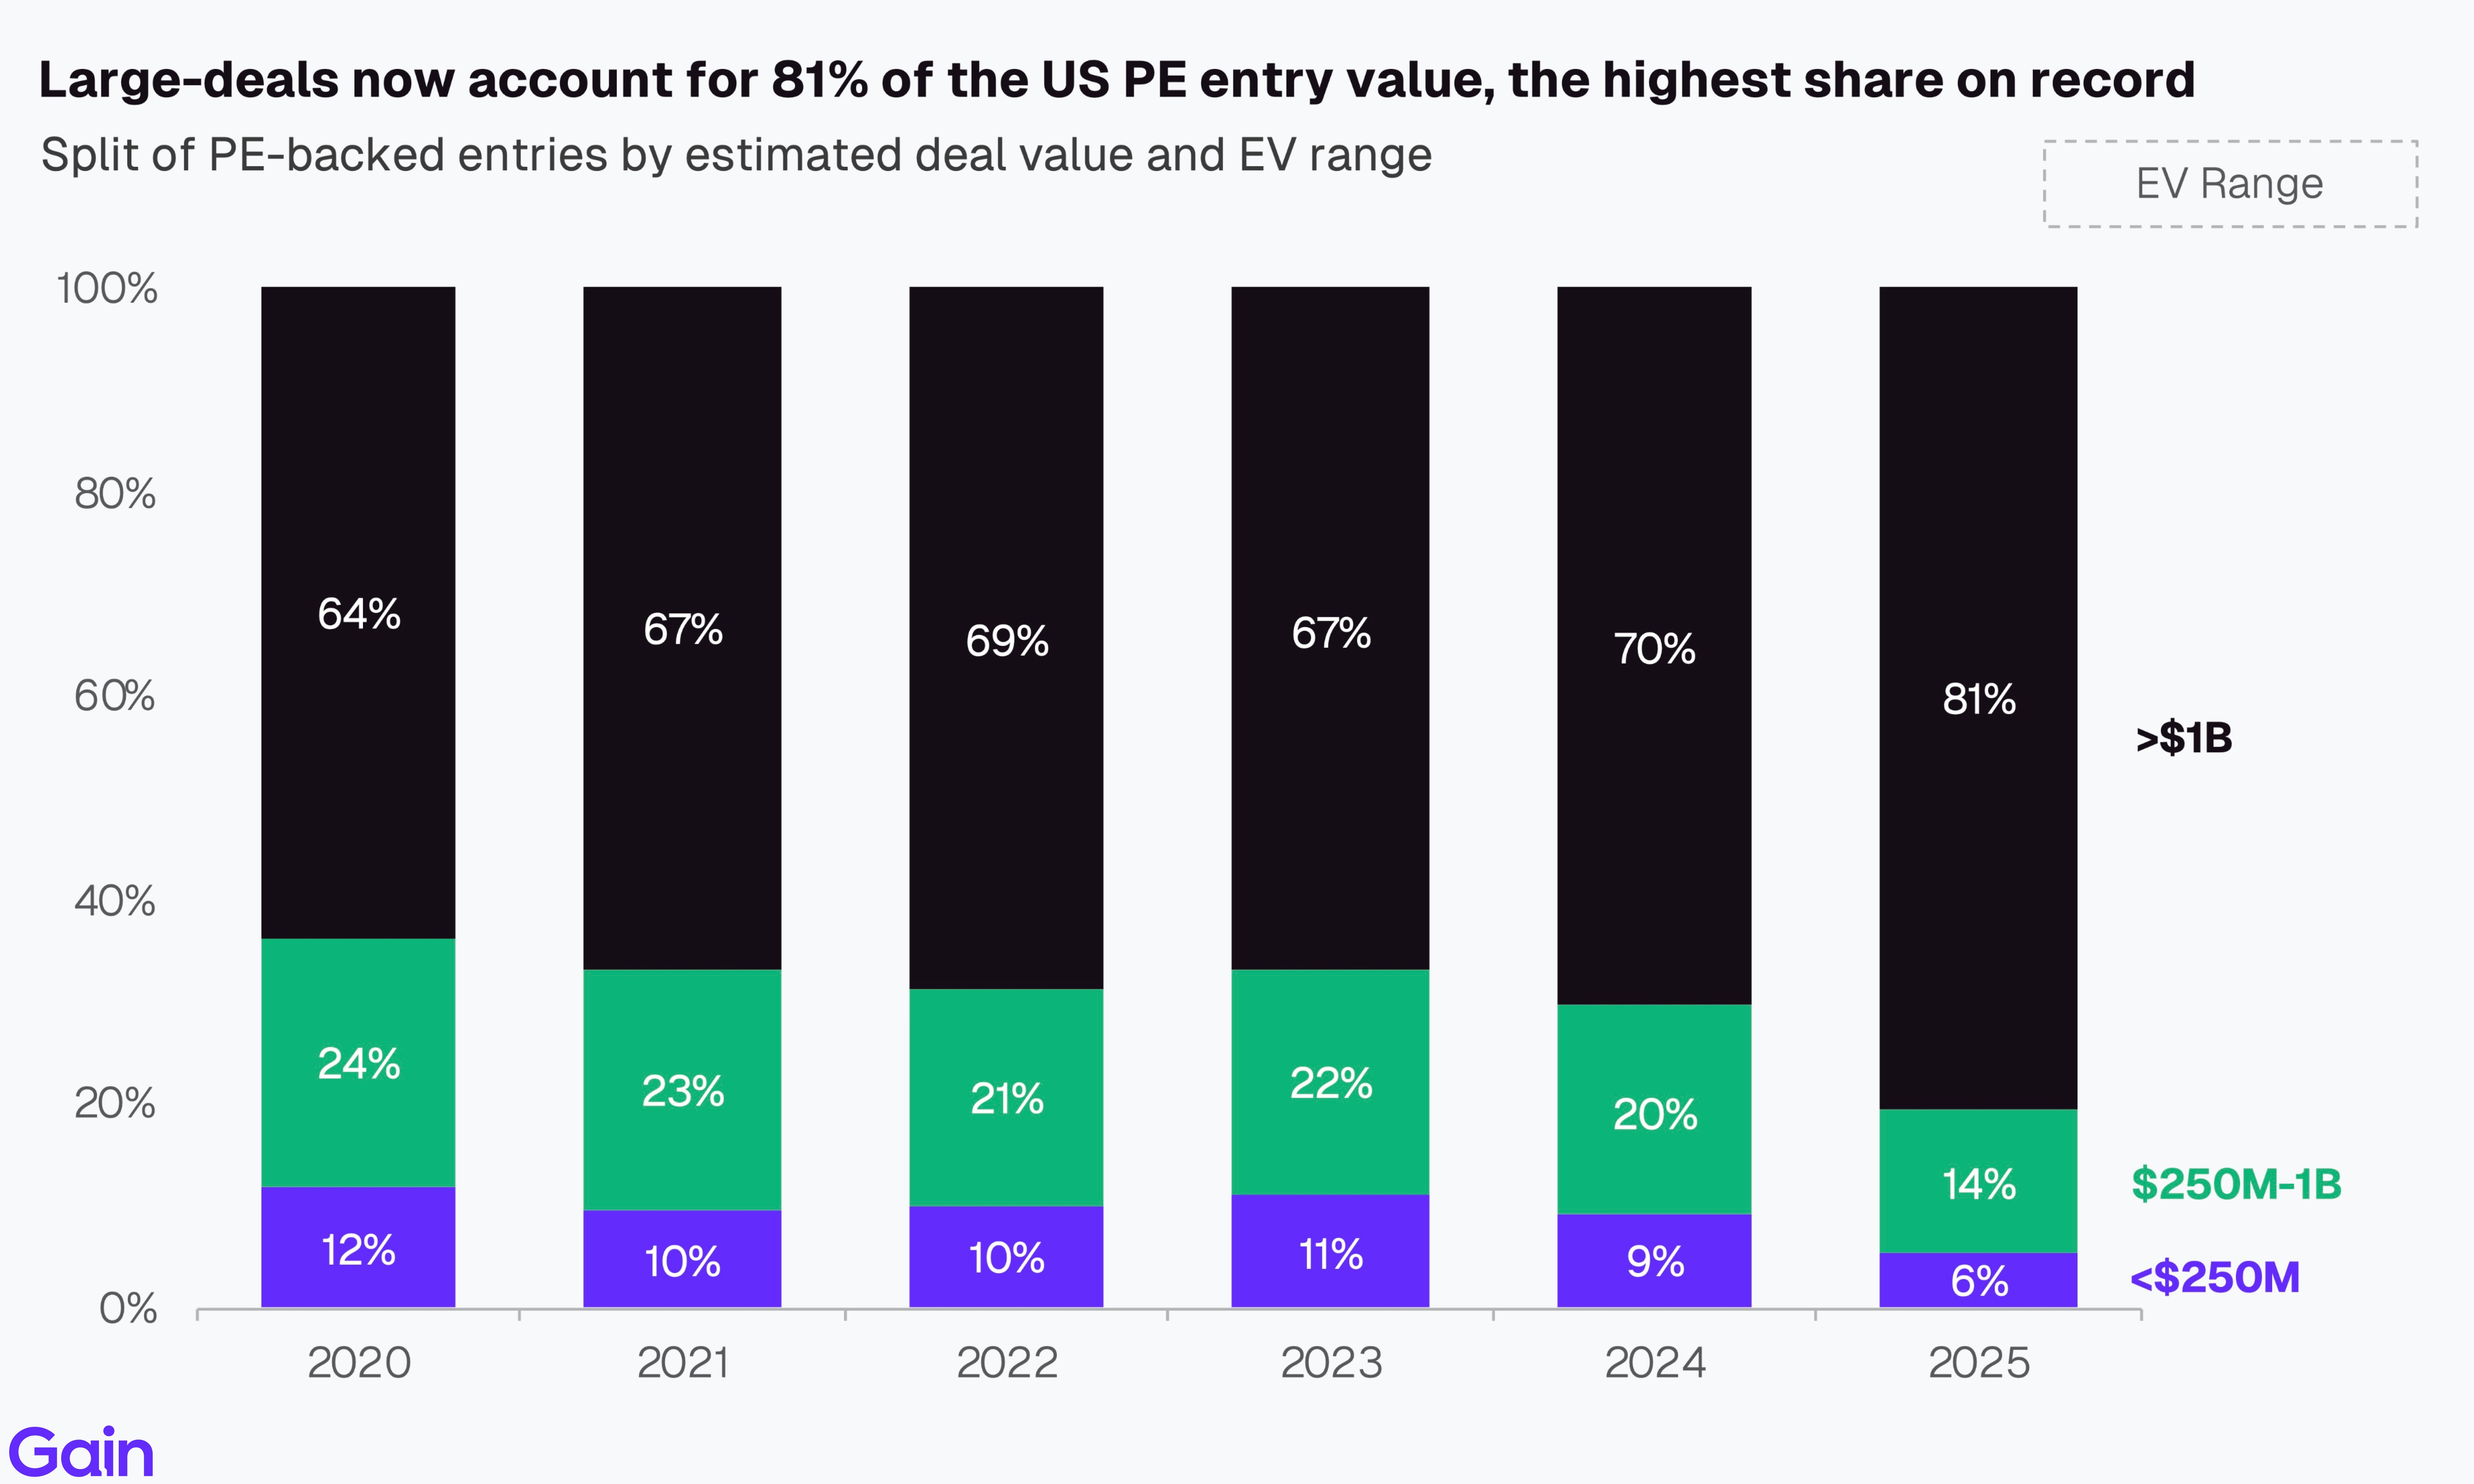
US PE entry count declined marginally in 2025, down 10% year-over-year. In contrast, deal value was up 30%. This divergence was driven by a surge in large-deals (>$1bn EV), which accounted for 81% of all deal value, up from 64% in 2020. Early 2026 activity points to a stronger start by count, though deal value has been lower, with large public-to-private transactions almost non-existent.
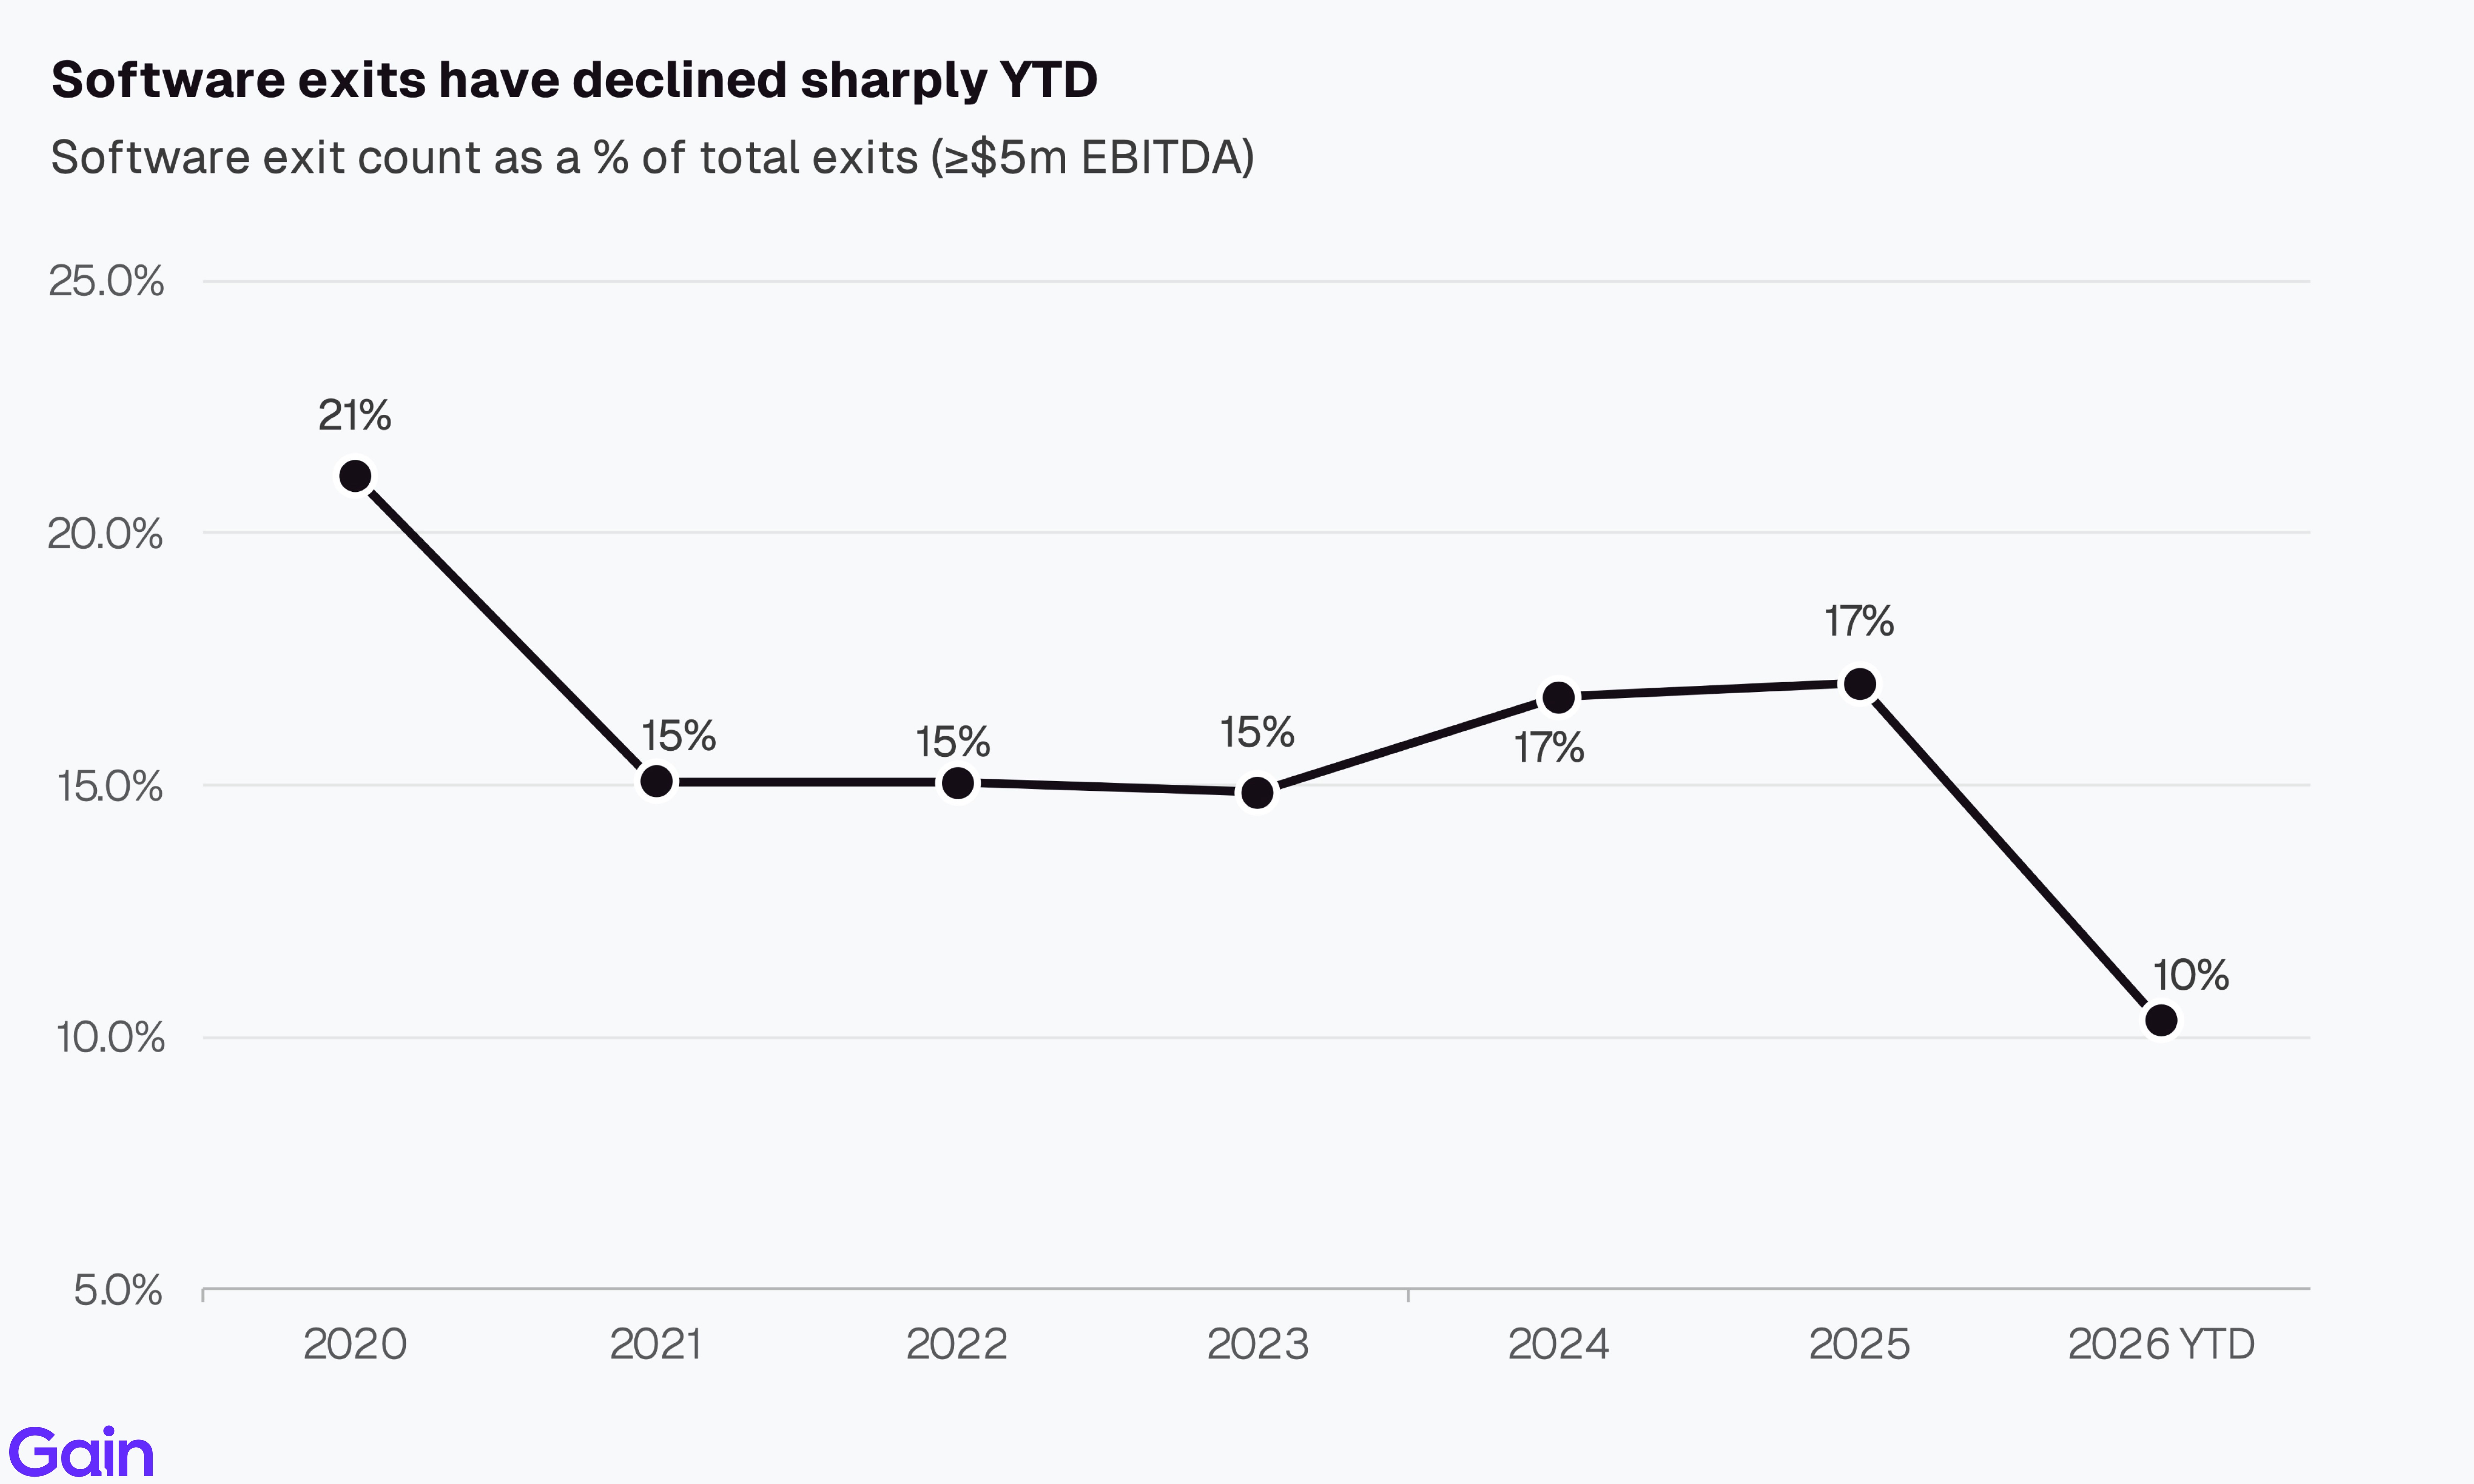
US PE exits gained momentum, with exit count rising 12% in 2025 and exit deal value jumping 72% year-over-year to $599bn. The share of $1bn+ exits rose from 71% of deal value in 2024 to 82% in 2025. Software exits, which accounted for ~15% of all US PE exits (>$5m EBITDA) on average, have fallen to just 10% of exits this year.
Exits from the 2021 vintage are running behind prior cohorts at the same stage, with only 15% realized by year 4 vs a typical 25–30% range. This reflects the challenge of exiting assets bought at peak valuations. Holding periods rose for the fourth consecutive year. The median company spent 5.3 years in the portfolio in 2025, up from 4.2 years in 2021.
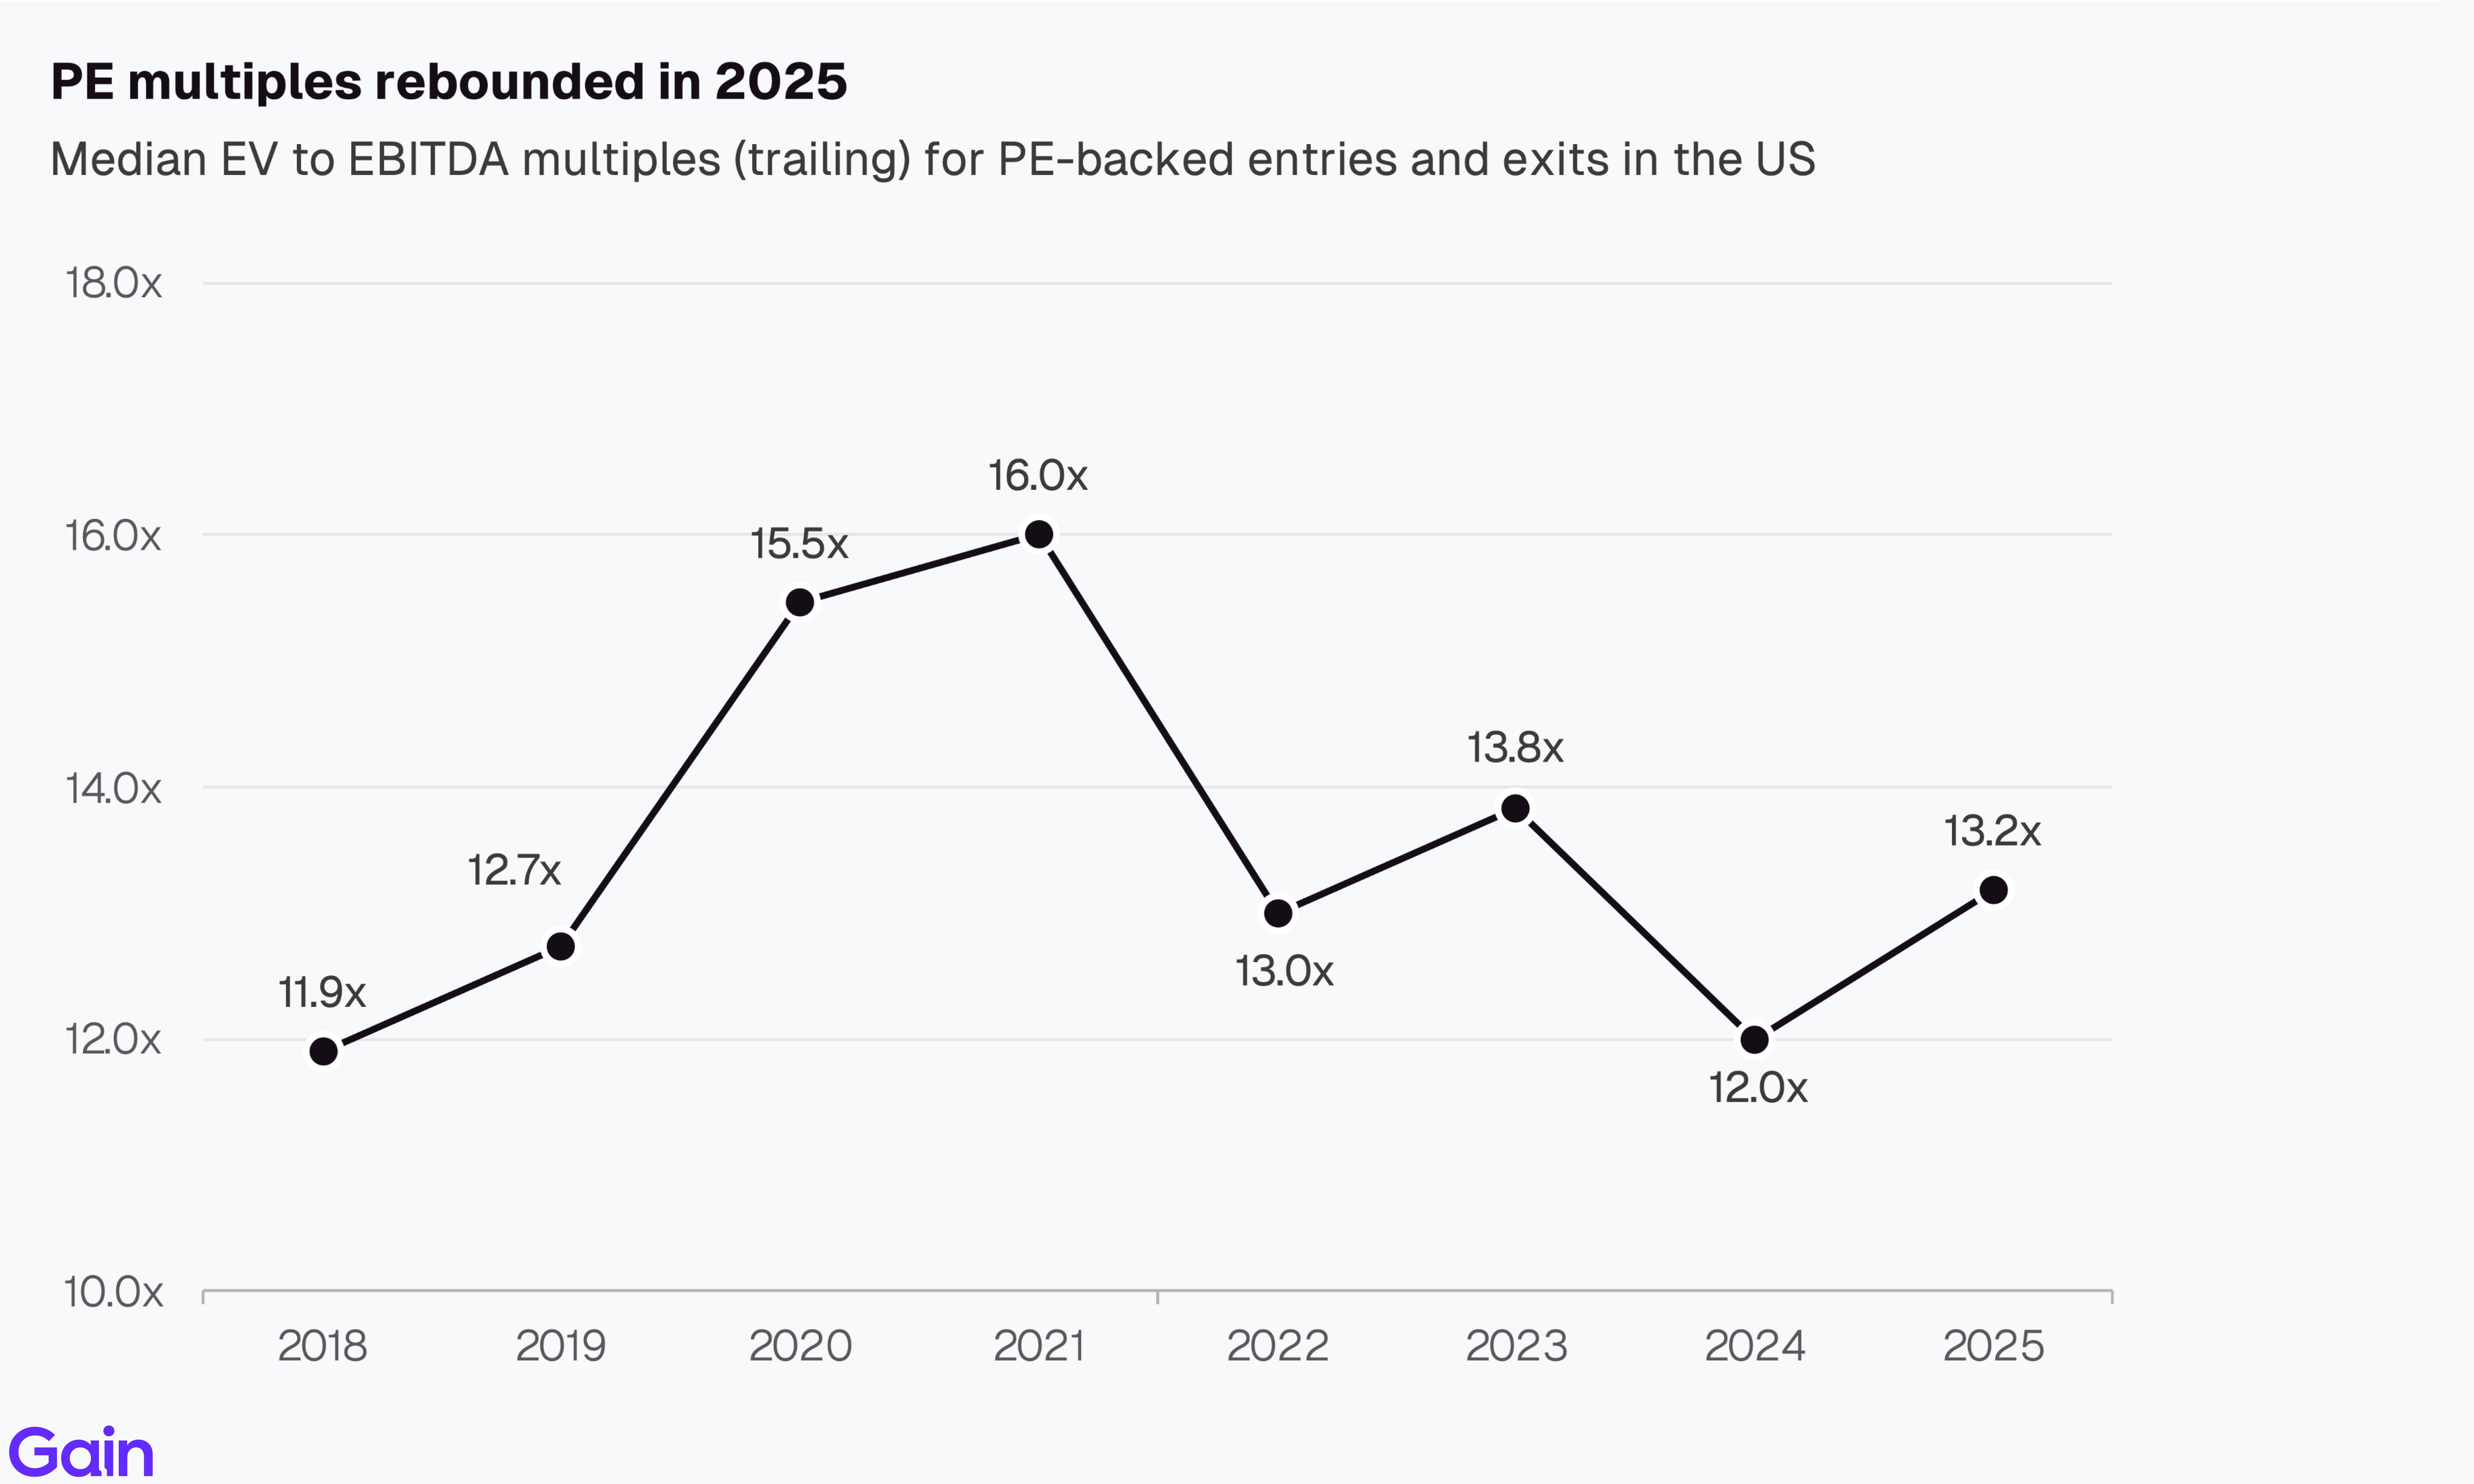
PE multiples rebounded in 2025 (13.2x) but remain well below the 2021 highs (-18%). Growth for PE-backed assets is also coming off cycle highs, now below pre-pandemic levels. The median PE-backed business grew 5.6% in 2025, down from 22.1% in 2021.
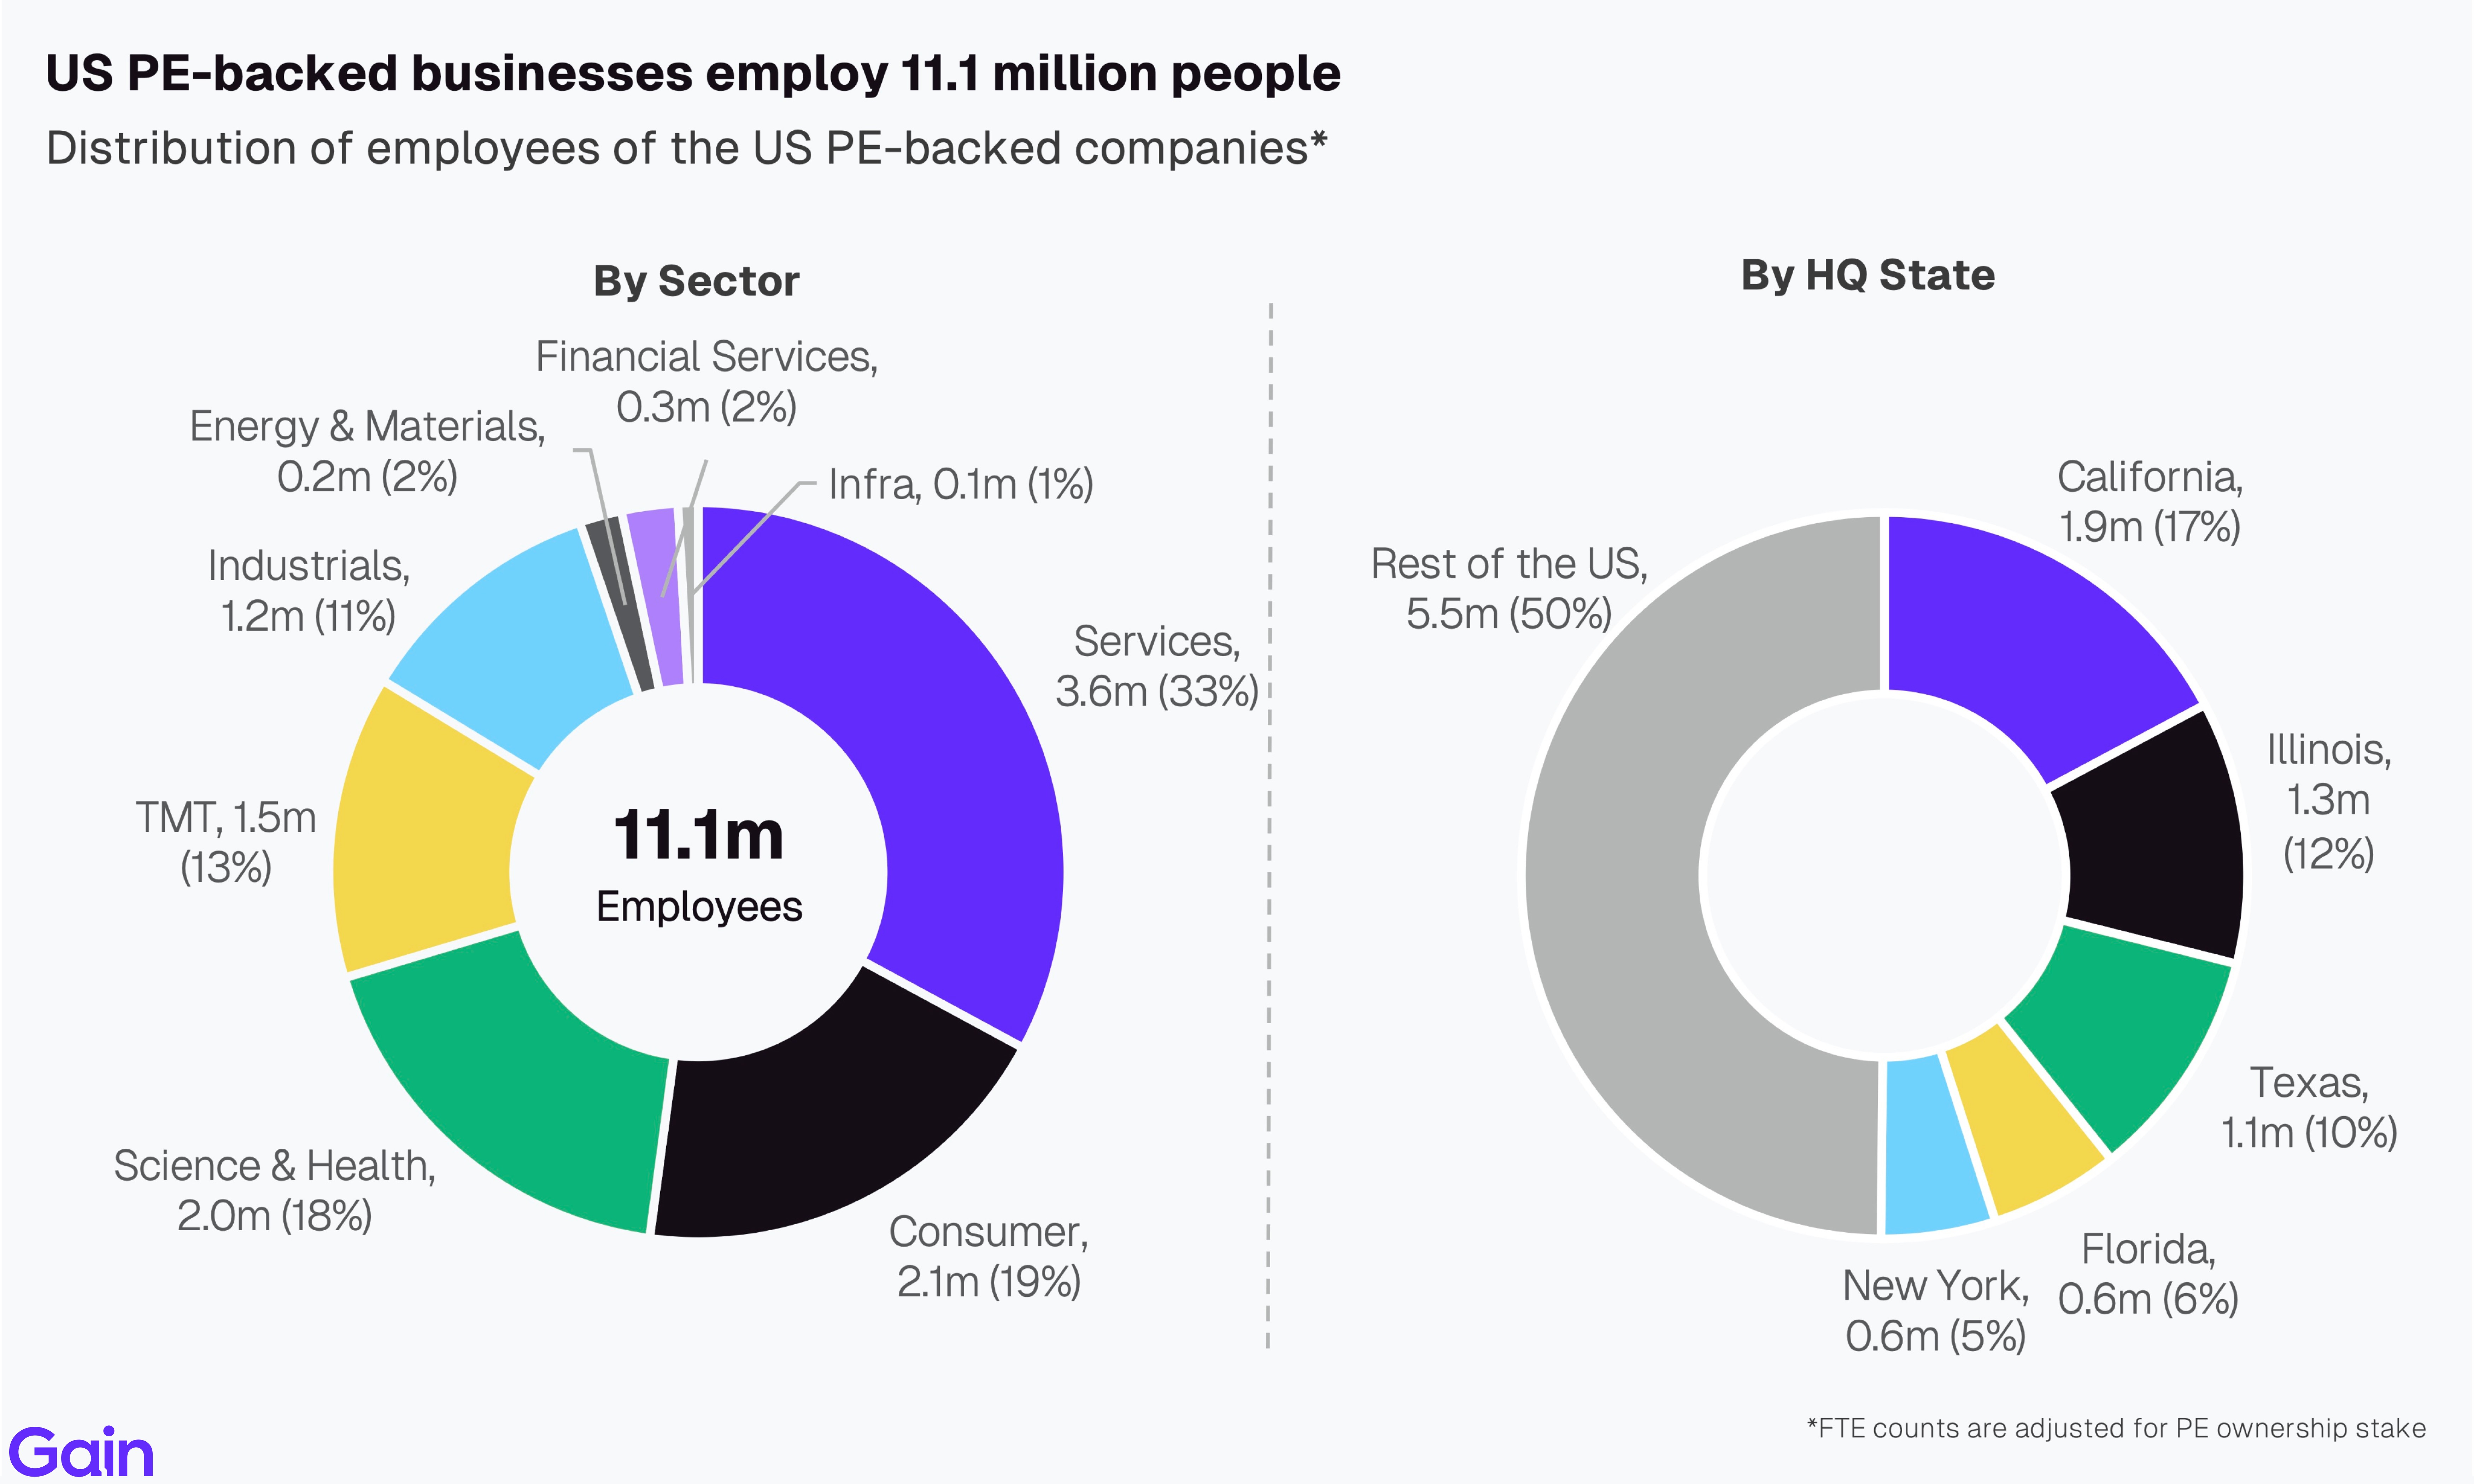
US PE-backed businesses employ 11.1 million people. By sector, Services (33%) and Consumer (19%) are the largest employers, followed by Science & Health (18%) and TMT (13%). By state, California leads with 1.9m employees (17%), followed by Illinois (1.3m), Texas (1.1m), Florida (0.6m) and New York (0.6m).


Chapter 01: Entries
Overall Trend
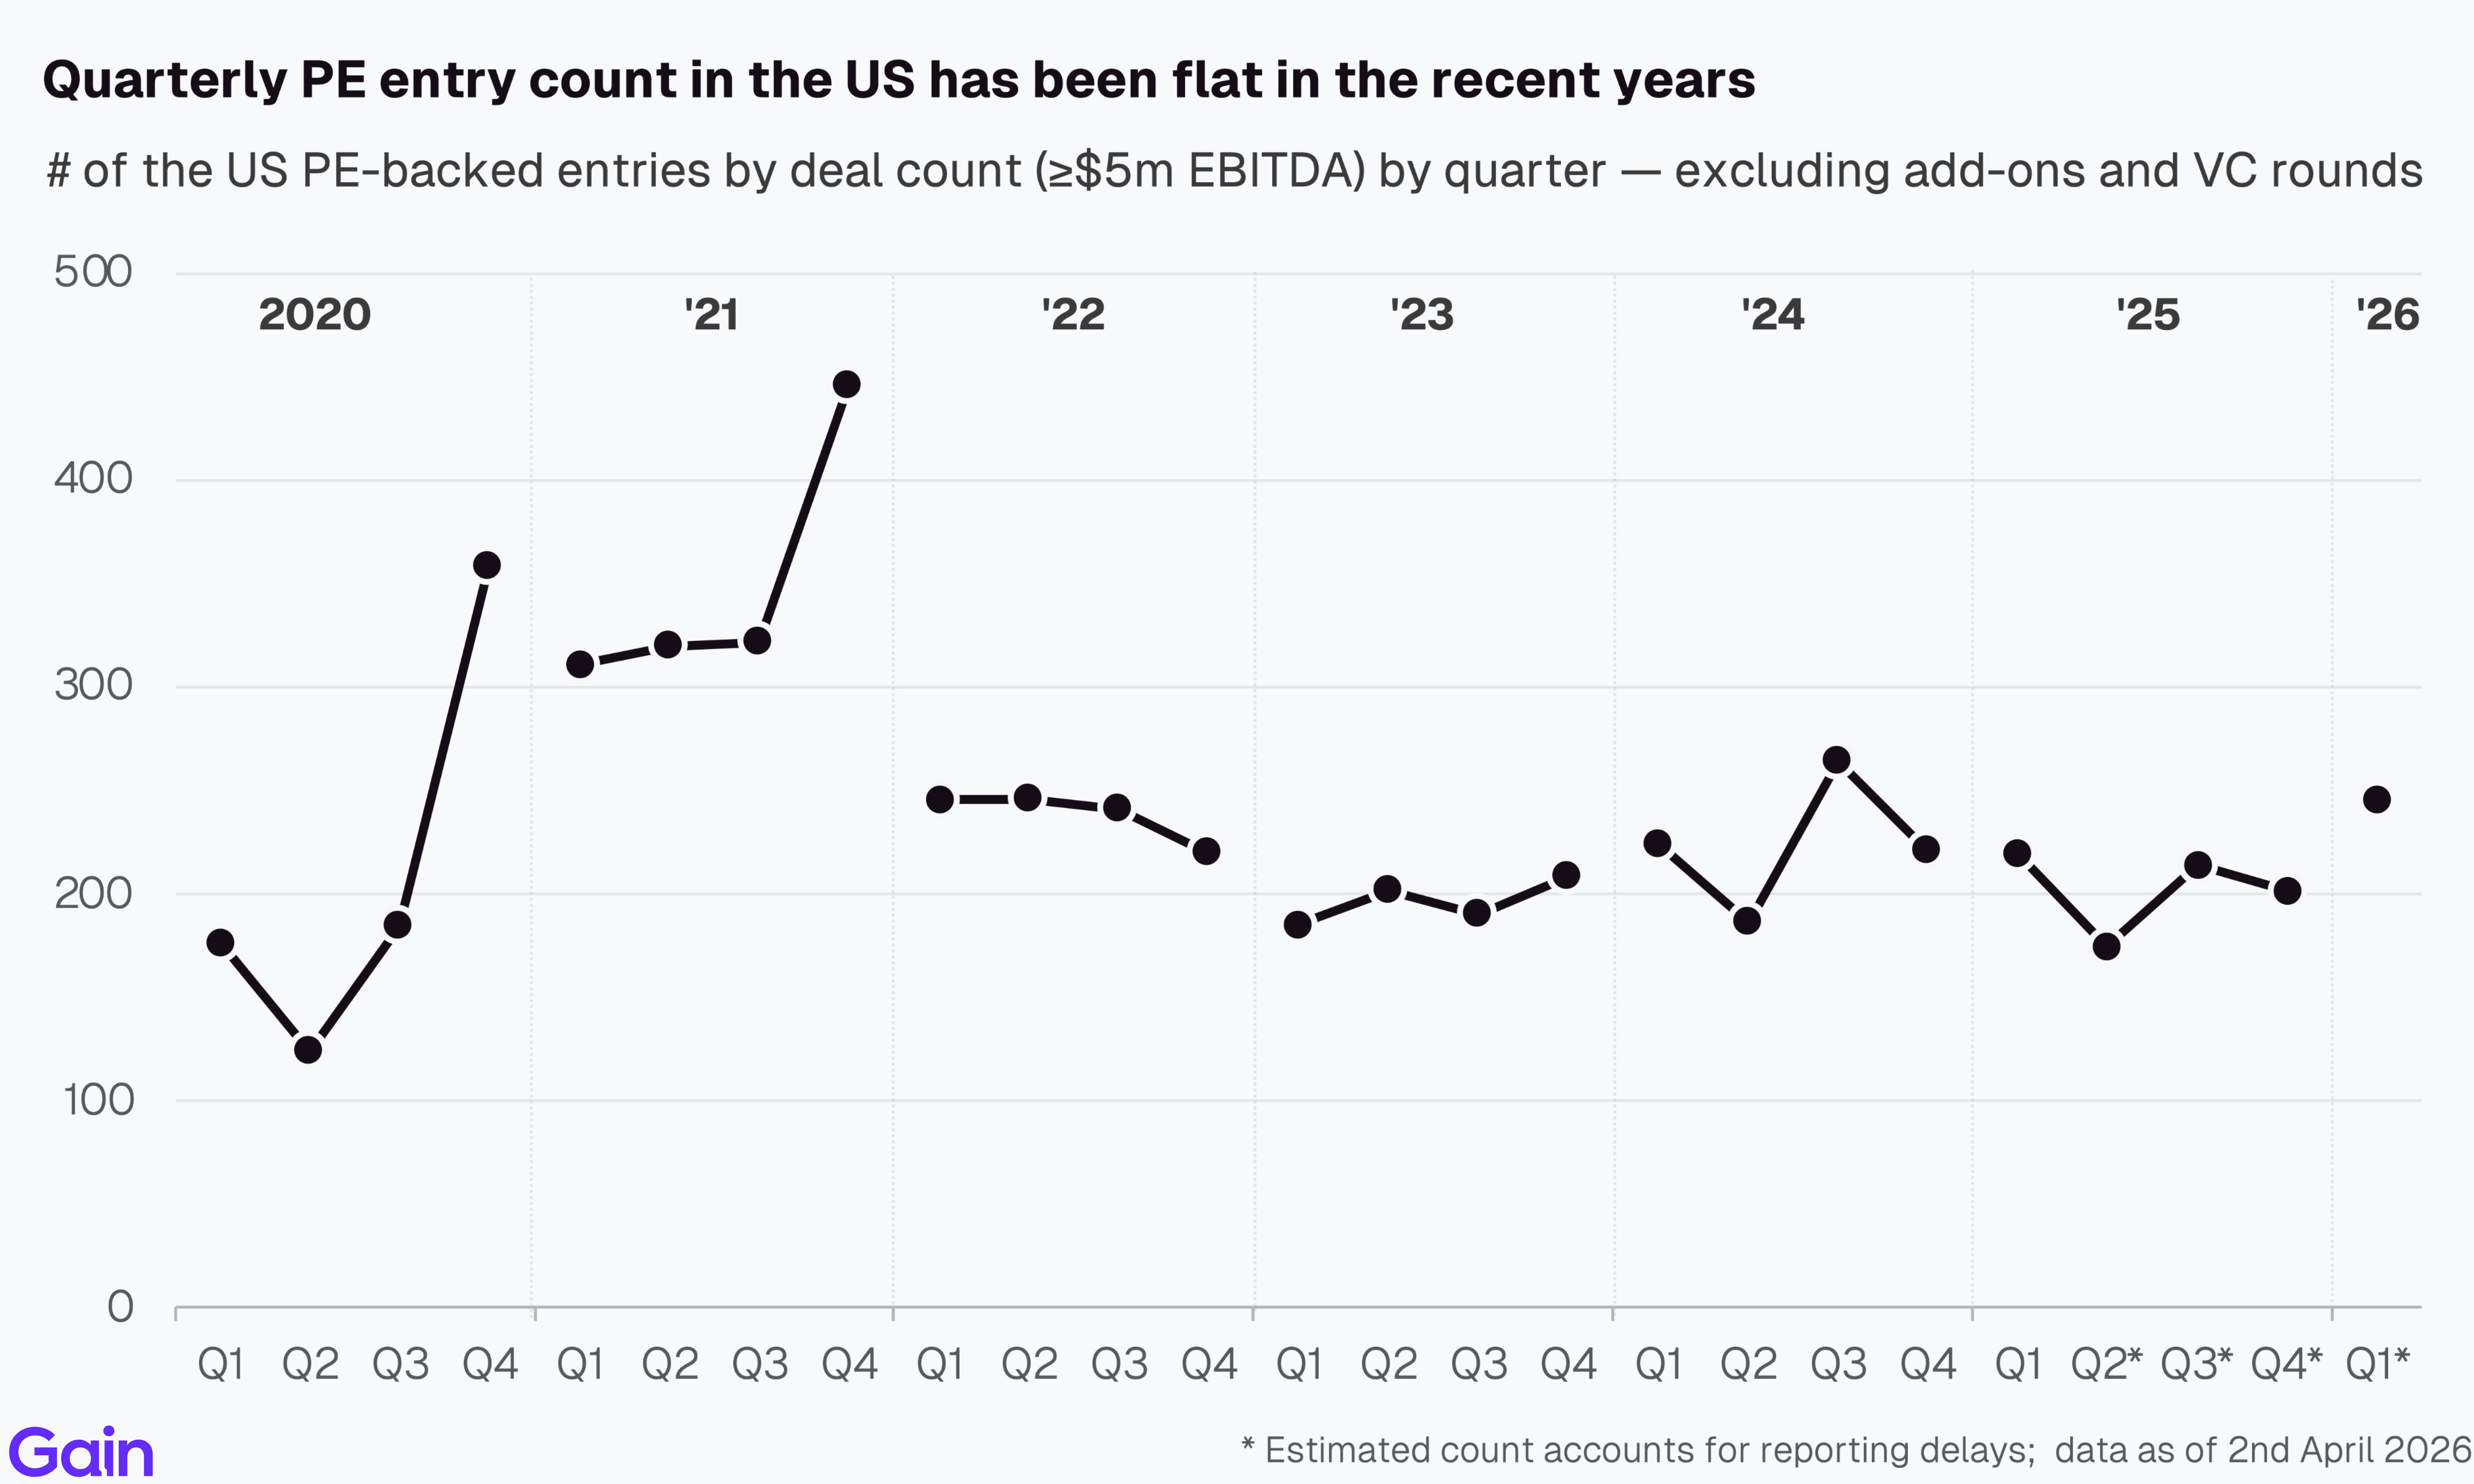
US PE entry count (>$5m EBITDA) declined marginally in 2025, down 10% yoy. Early 2026 activity, in contrast, points to a stronger start, though it's still early to call the full year given the current macro and geopolitical environment. Monthly data remains resilient so far.

In contrast to deal count, US PE deal value was up 30% year-over-year, reaching its second-highest level on record, just below the 2021 peak. This was driven by a higher concentration of large-deals (>$1bn EV), which account for 81% of total value, up from 70–75% in prior years. Year-to-date, however, dealmaking by value has been slow, particularly in the large-cap segment, with public-to-private transactions almost non-existent.

Quarterly PE entry count in the US has been flat in recent years. This is in sharp contrast to Europe, which saw a notable recovery in Q4 2025, which was Europe’s strongest quarter in 3.5 years.
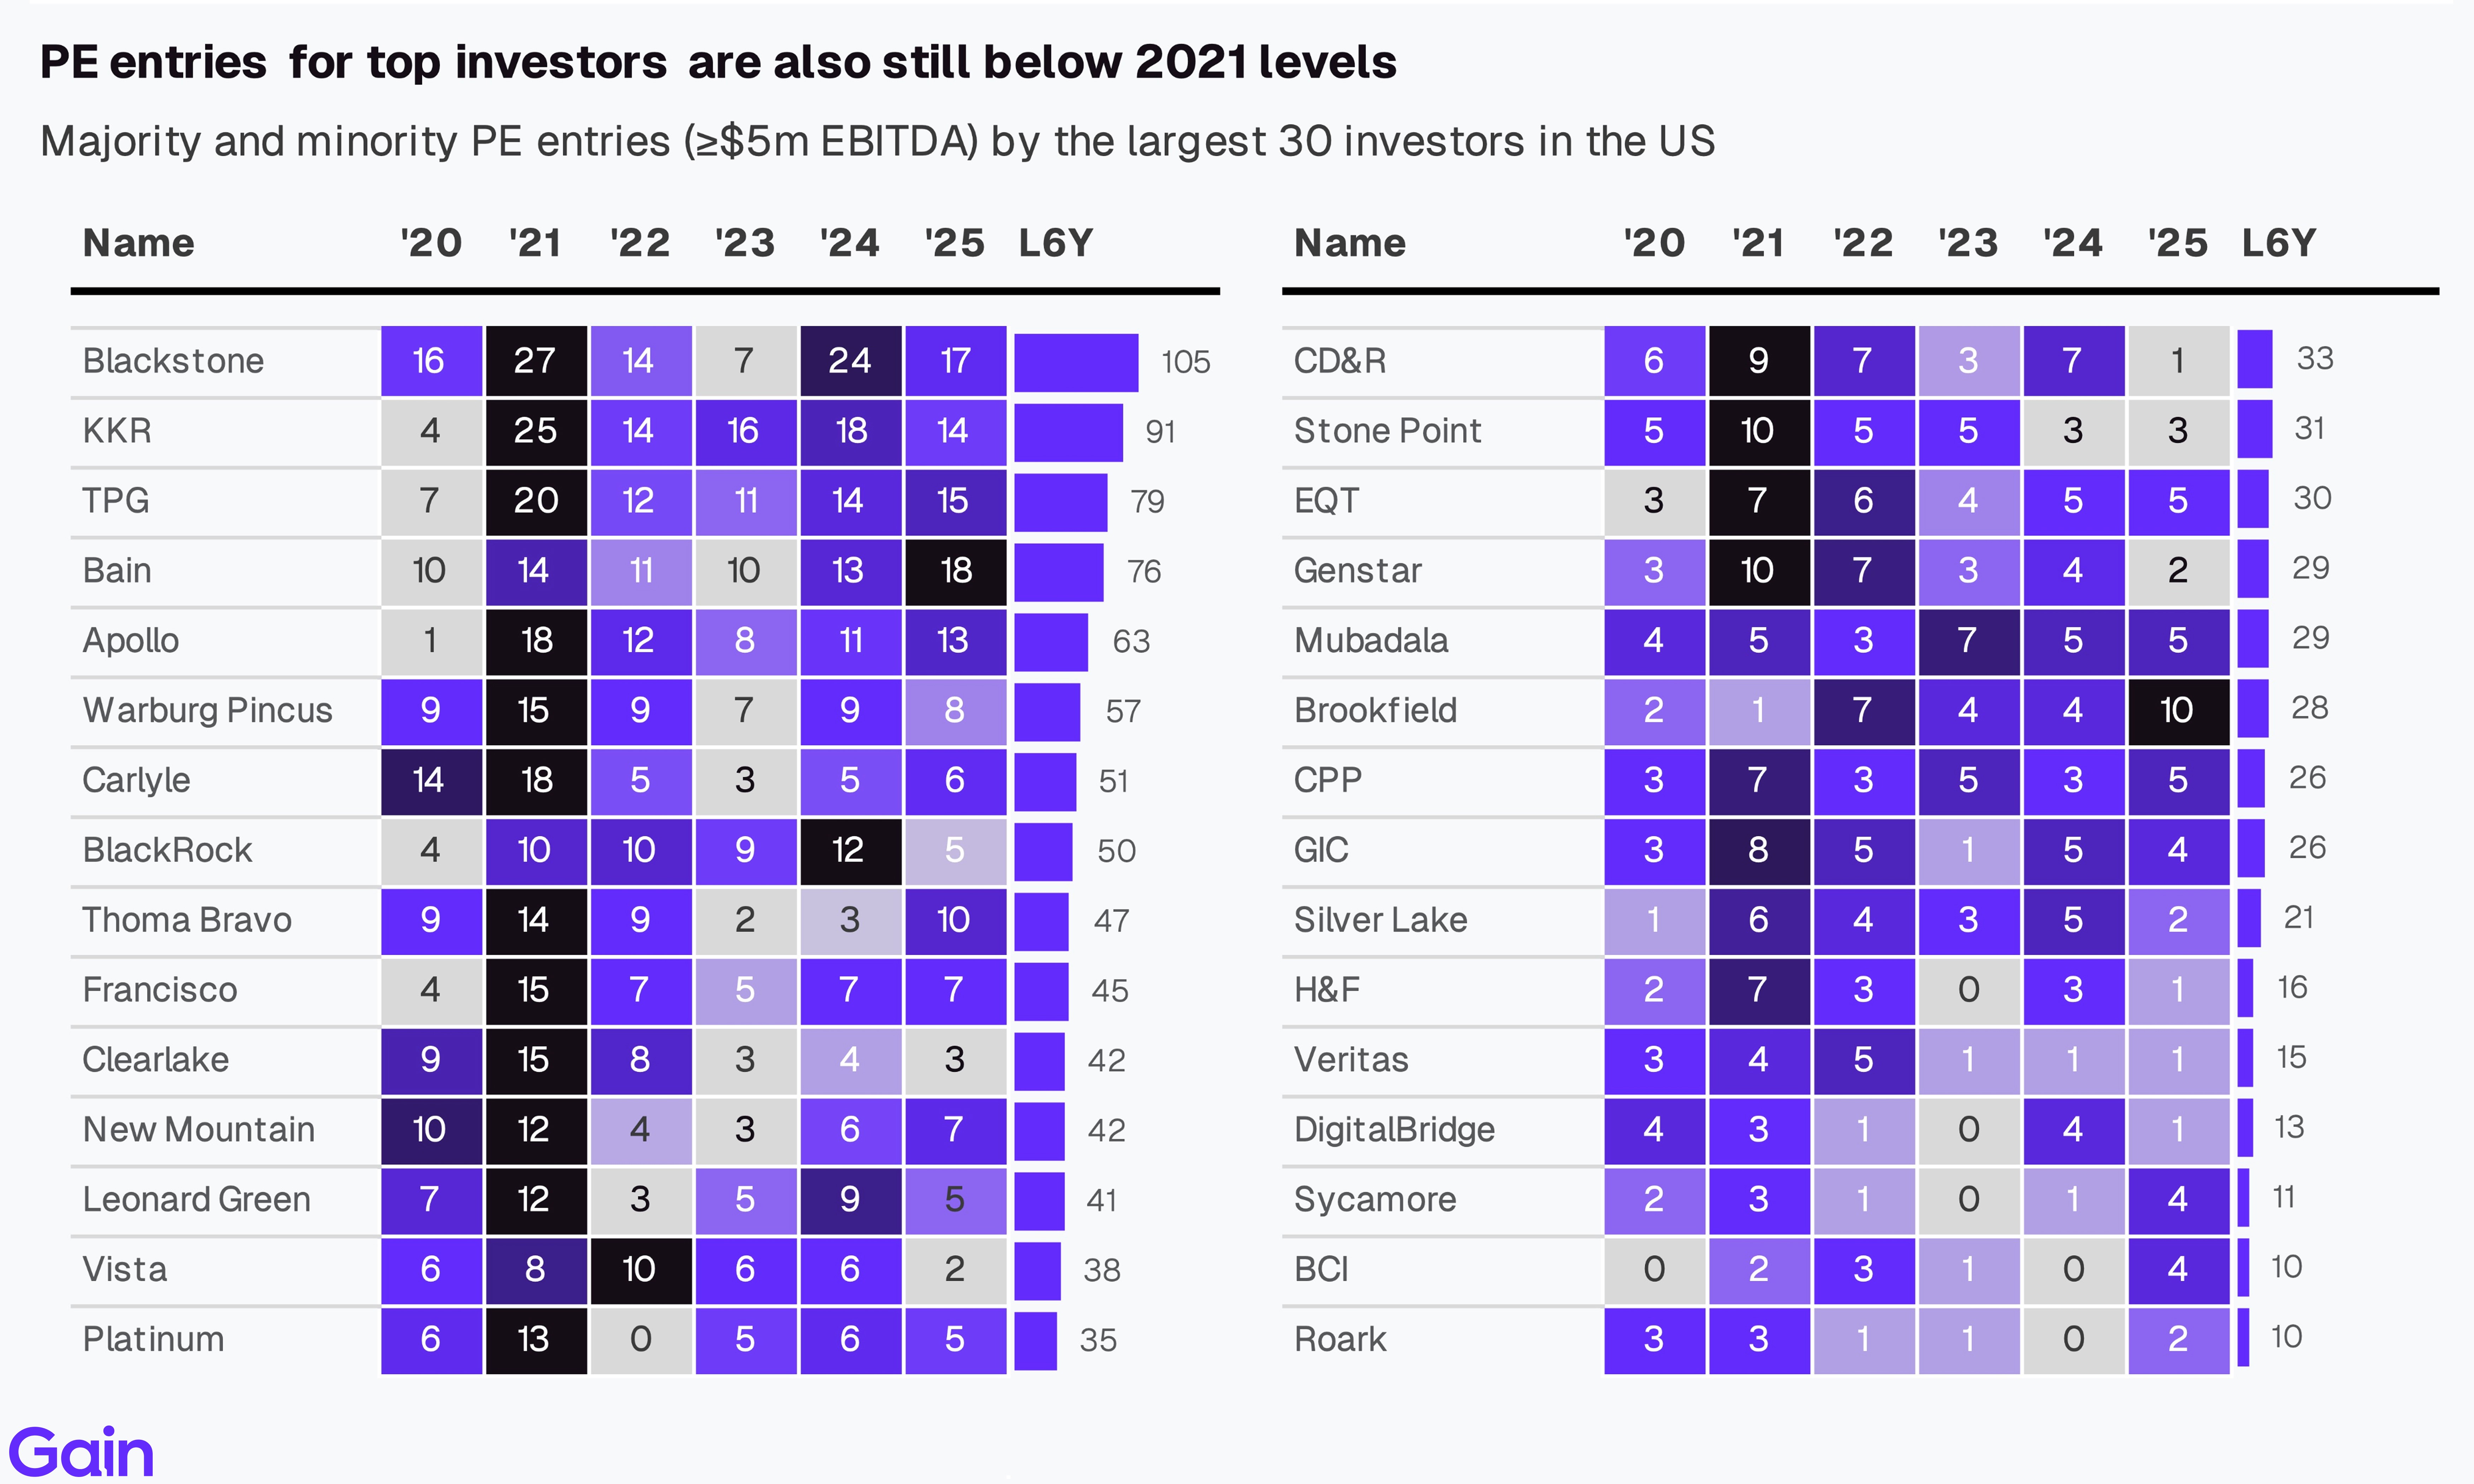
PE entries for the largest 30 investors picked up in 2024 and 2025, but remain well below 2021 levels. Higher interest rates and valuation gaps continue to constrain deal activity.
Entries by Deal Type
By deal type, sponsor-to-sponsor deals gained share. They accounted for 59% of PE entries over $5m in EBITDA, up from 53% in 2022. Family-to-sponsor deals remain more common in lower EBITDA ranges, while sponsor-to-sponsor deals, carve-outs and take-privates become more common as deal size increased. By deal value, public-to-private transactions surged in 2025, driving a significant uptick in overall deal value.

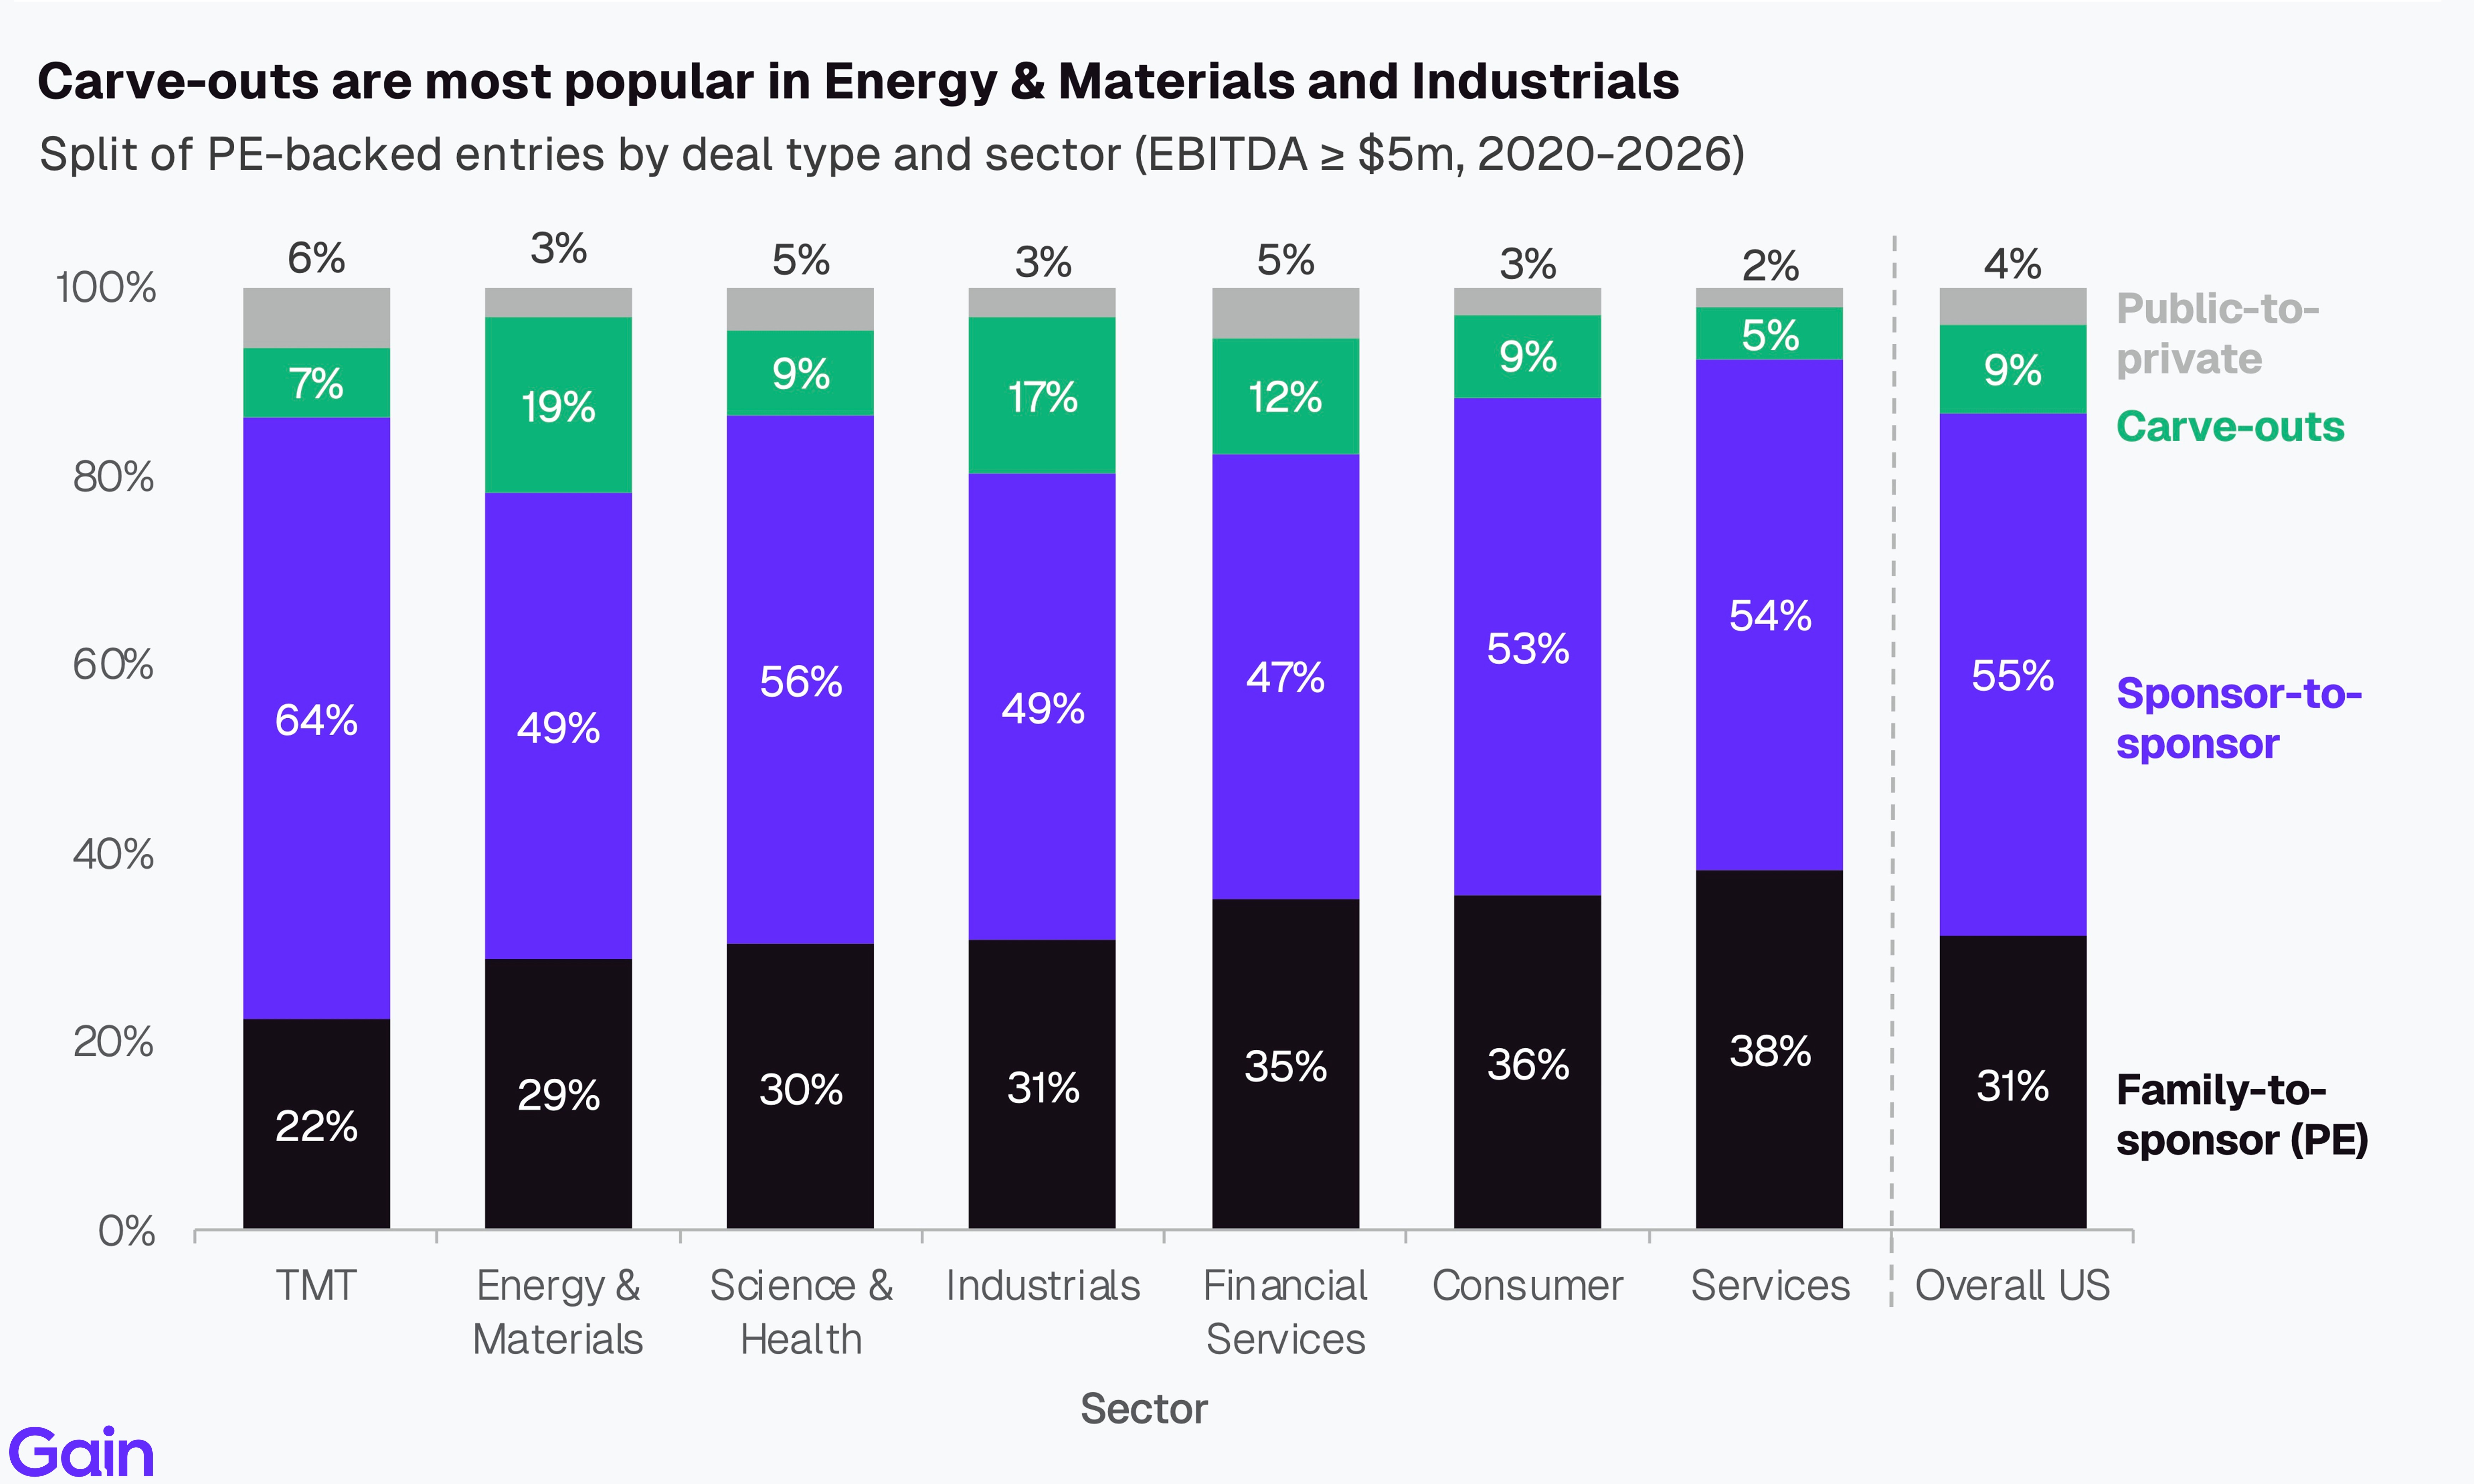
Sponsor-to-sponsor deals remain the dominant entry type across most sectors (~55% of deals). Carve-outs are more popular in Energy & Materials (19%) and Industrials (17%). Family-to-sponsor deals, on the other hand, are more common in Services (38%) and Consumer (36%). TMT has seen the sharpest rise in sponsor-to-sponsor deals over the past decade, reflecting the sector's evolution from a nascent PE presence to a mature, PE-backed sector.
Entries by Size
PE firms are moving upmarket. The share of large deals (>$1bn EV) has increased from 64% of total value in 2020 to 81% in 2025. This shift is driven by larger fund sizes deploying larger checks and a more favorable financing environment that has also helped support large public-to-private transactions.
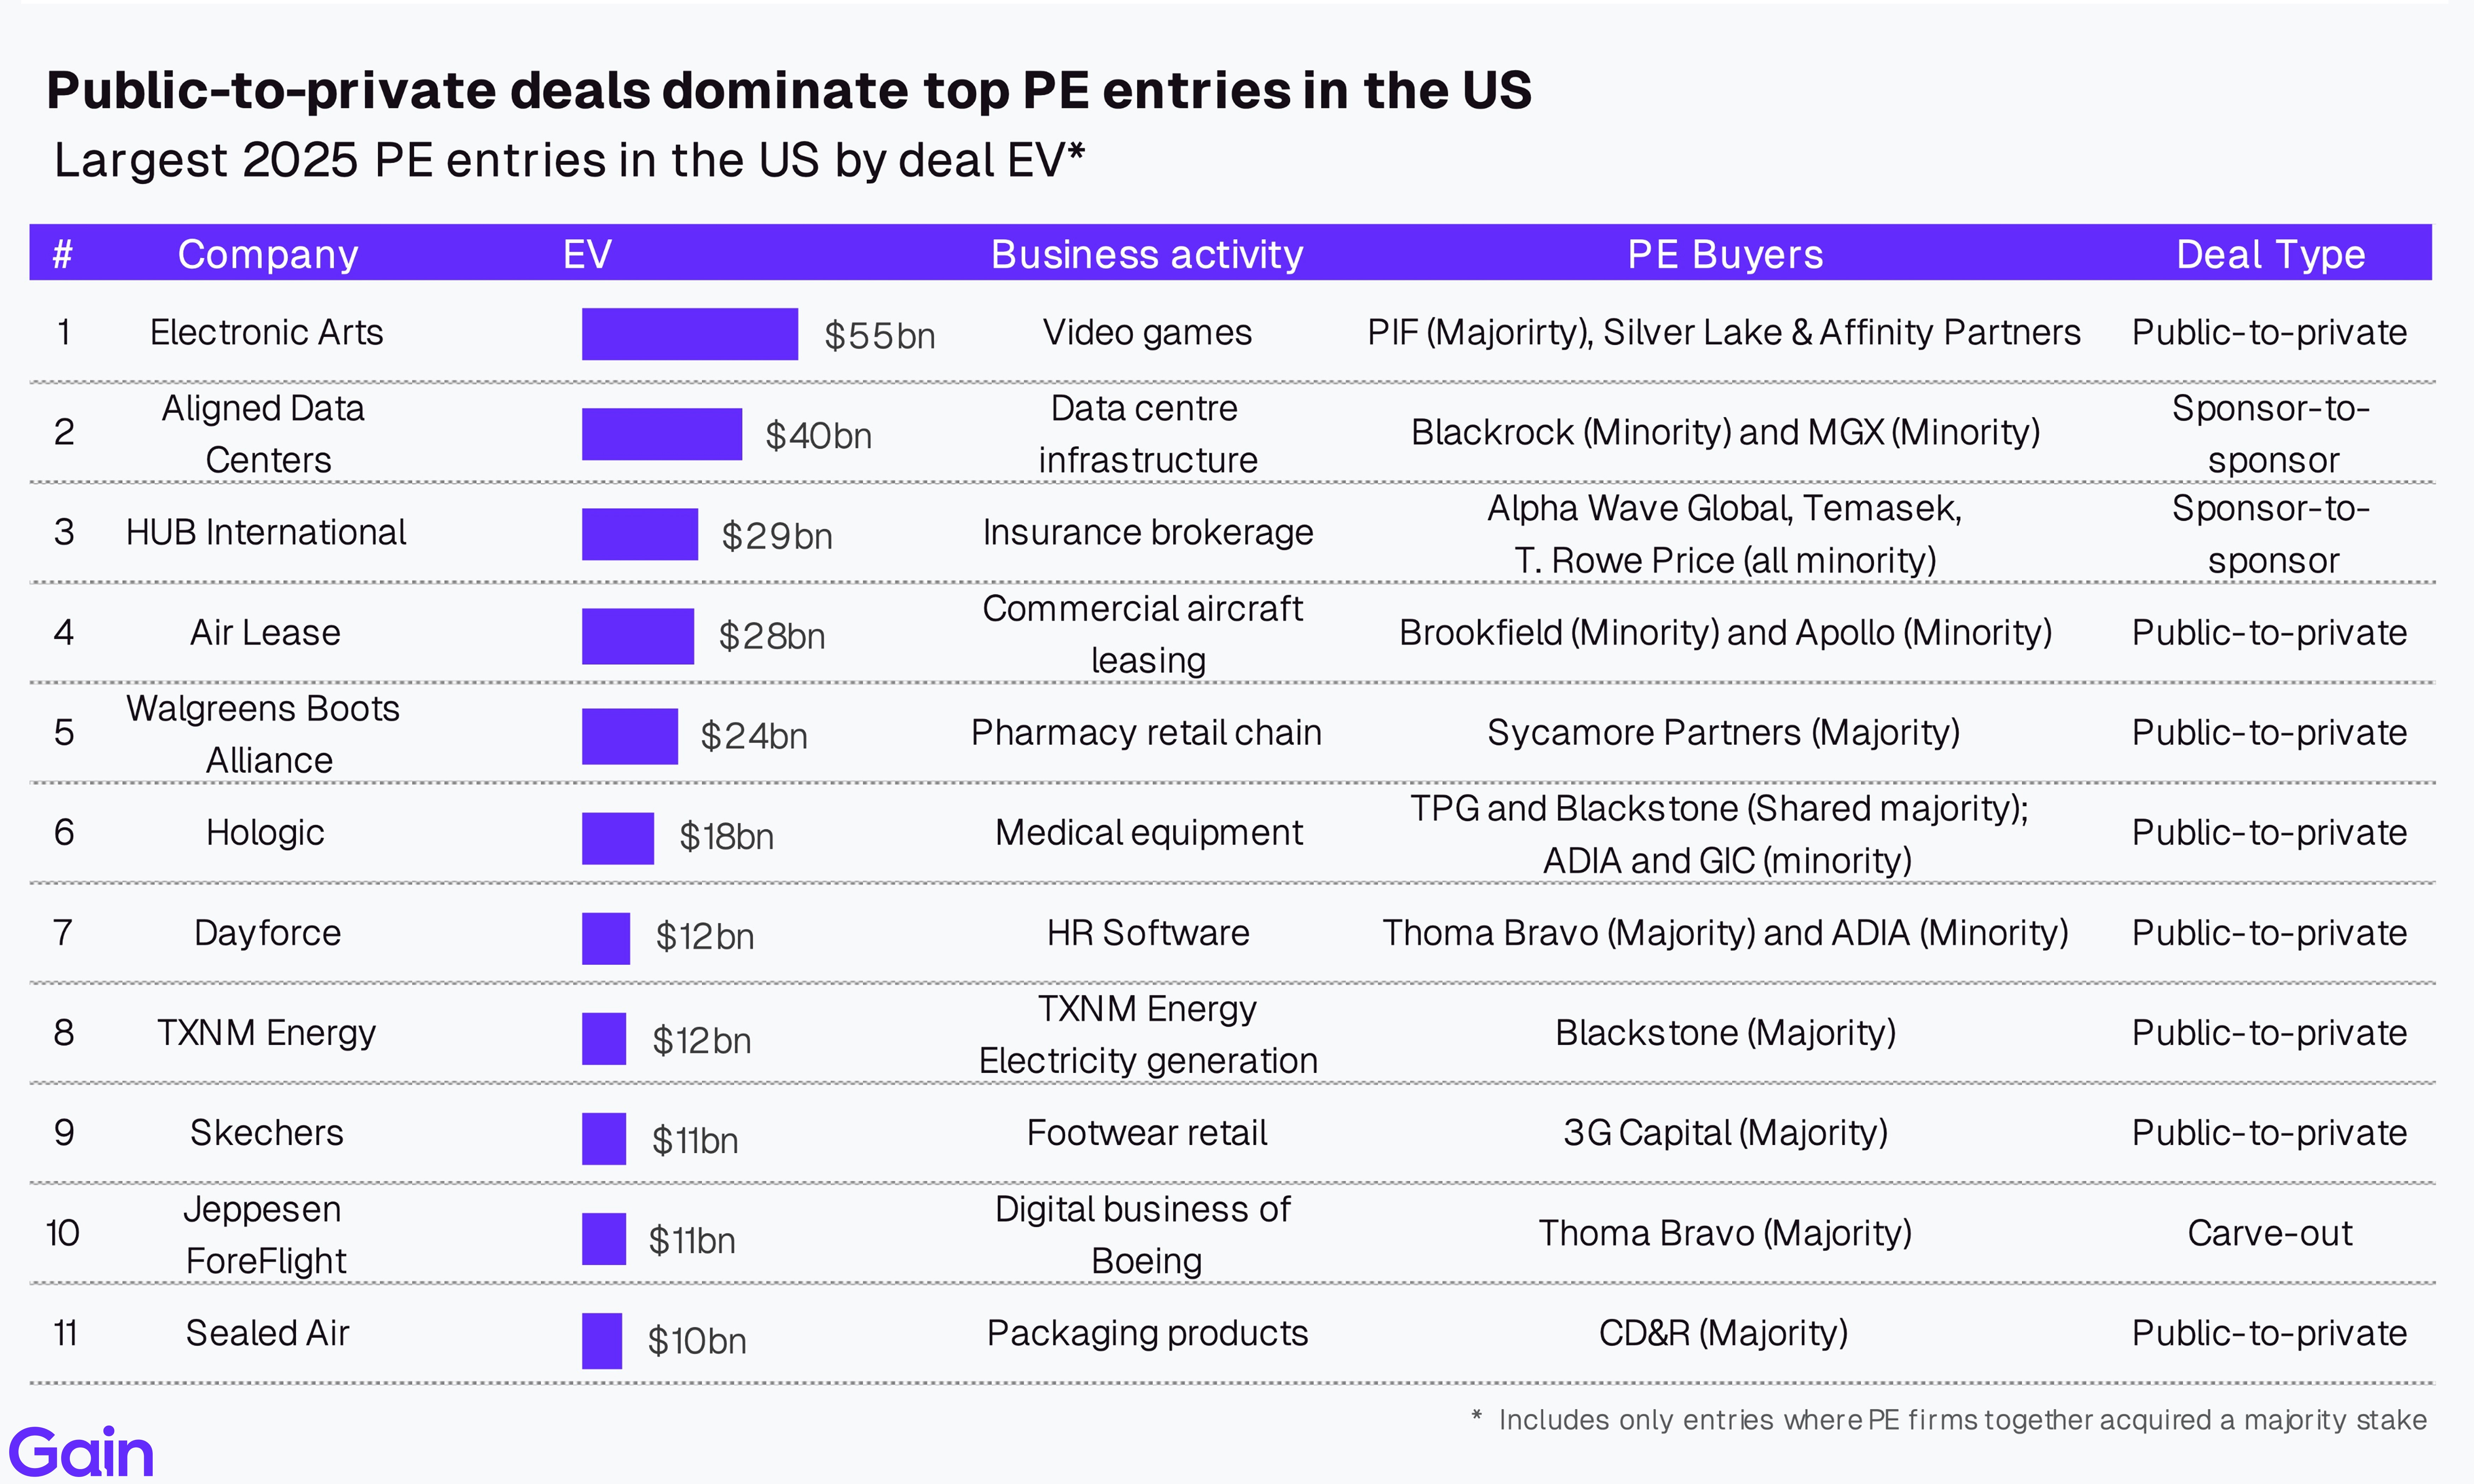
Electronic Arts ($55bn) was the largest US PE entry of 2025, followed by Aligned Data Centers ($40bn), HUB International ($29bn), and Air Lease ($28bn). Public-to-private transactions accounted for 8 of the top 11 entries, with sponsor-to-sponsor representing 2 and carve-outs 1.
Cross-Border Activity
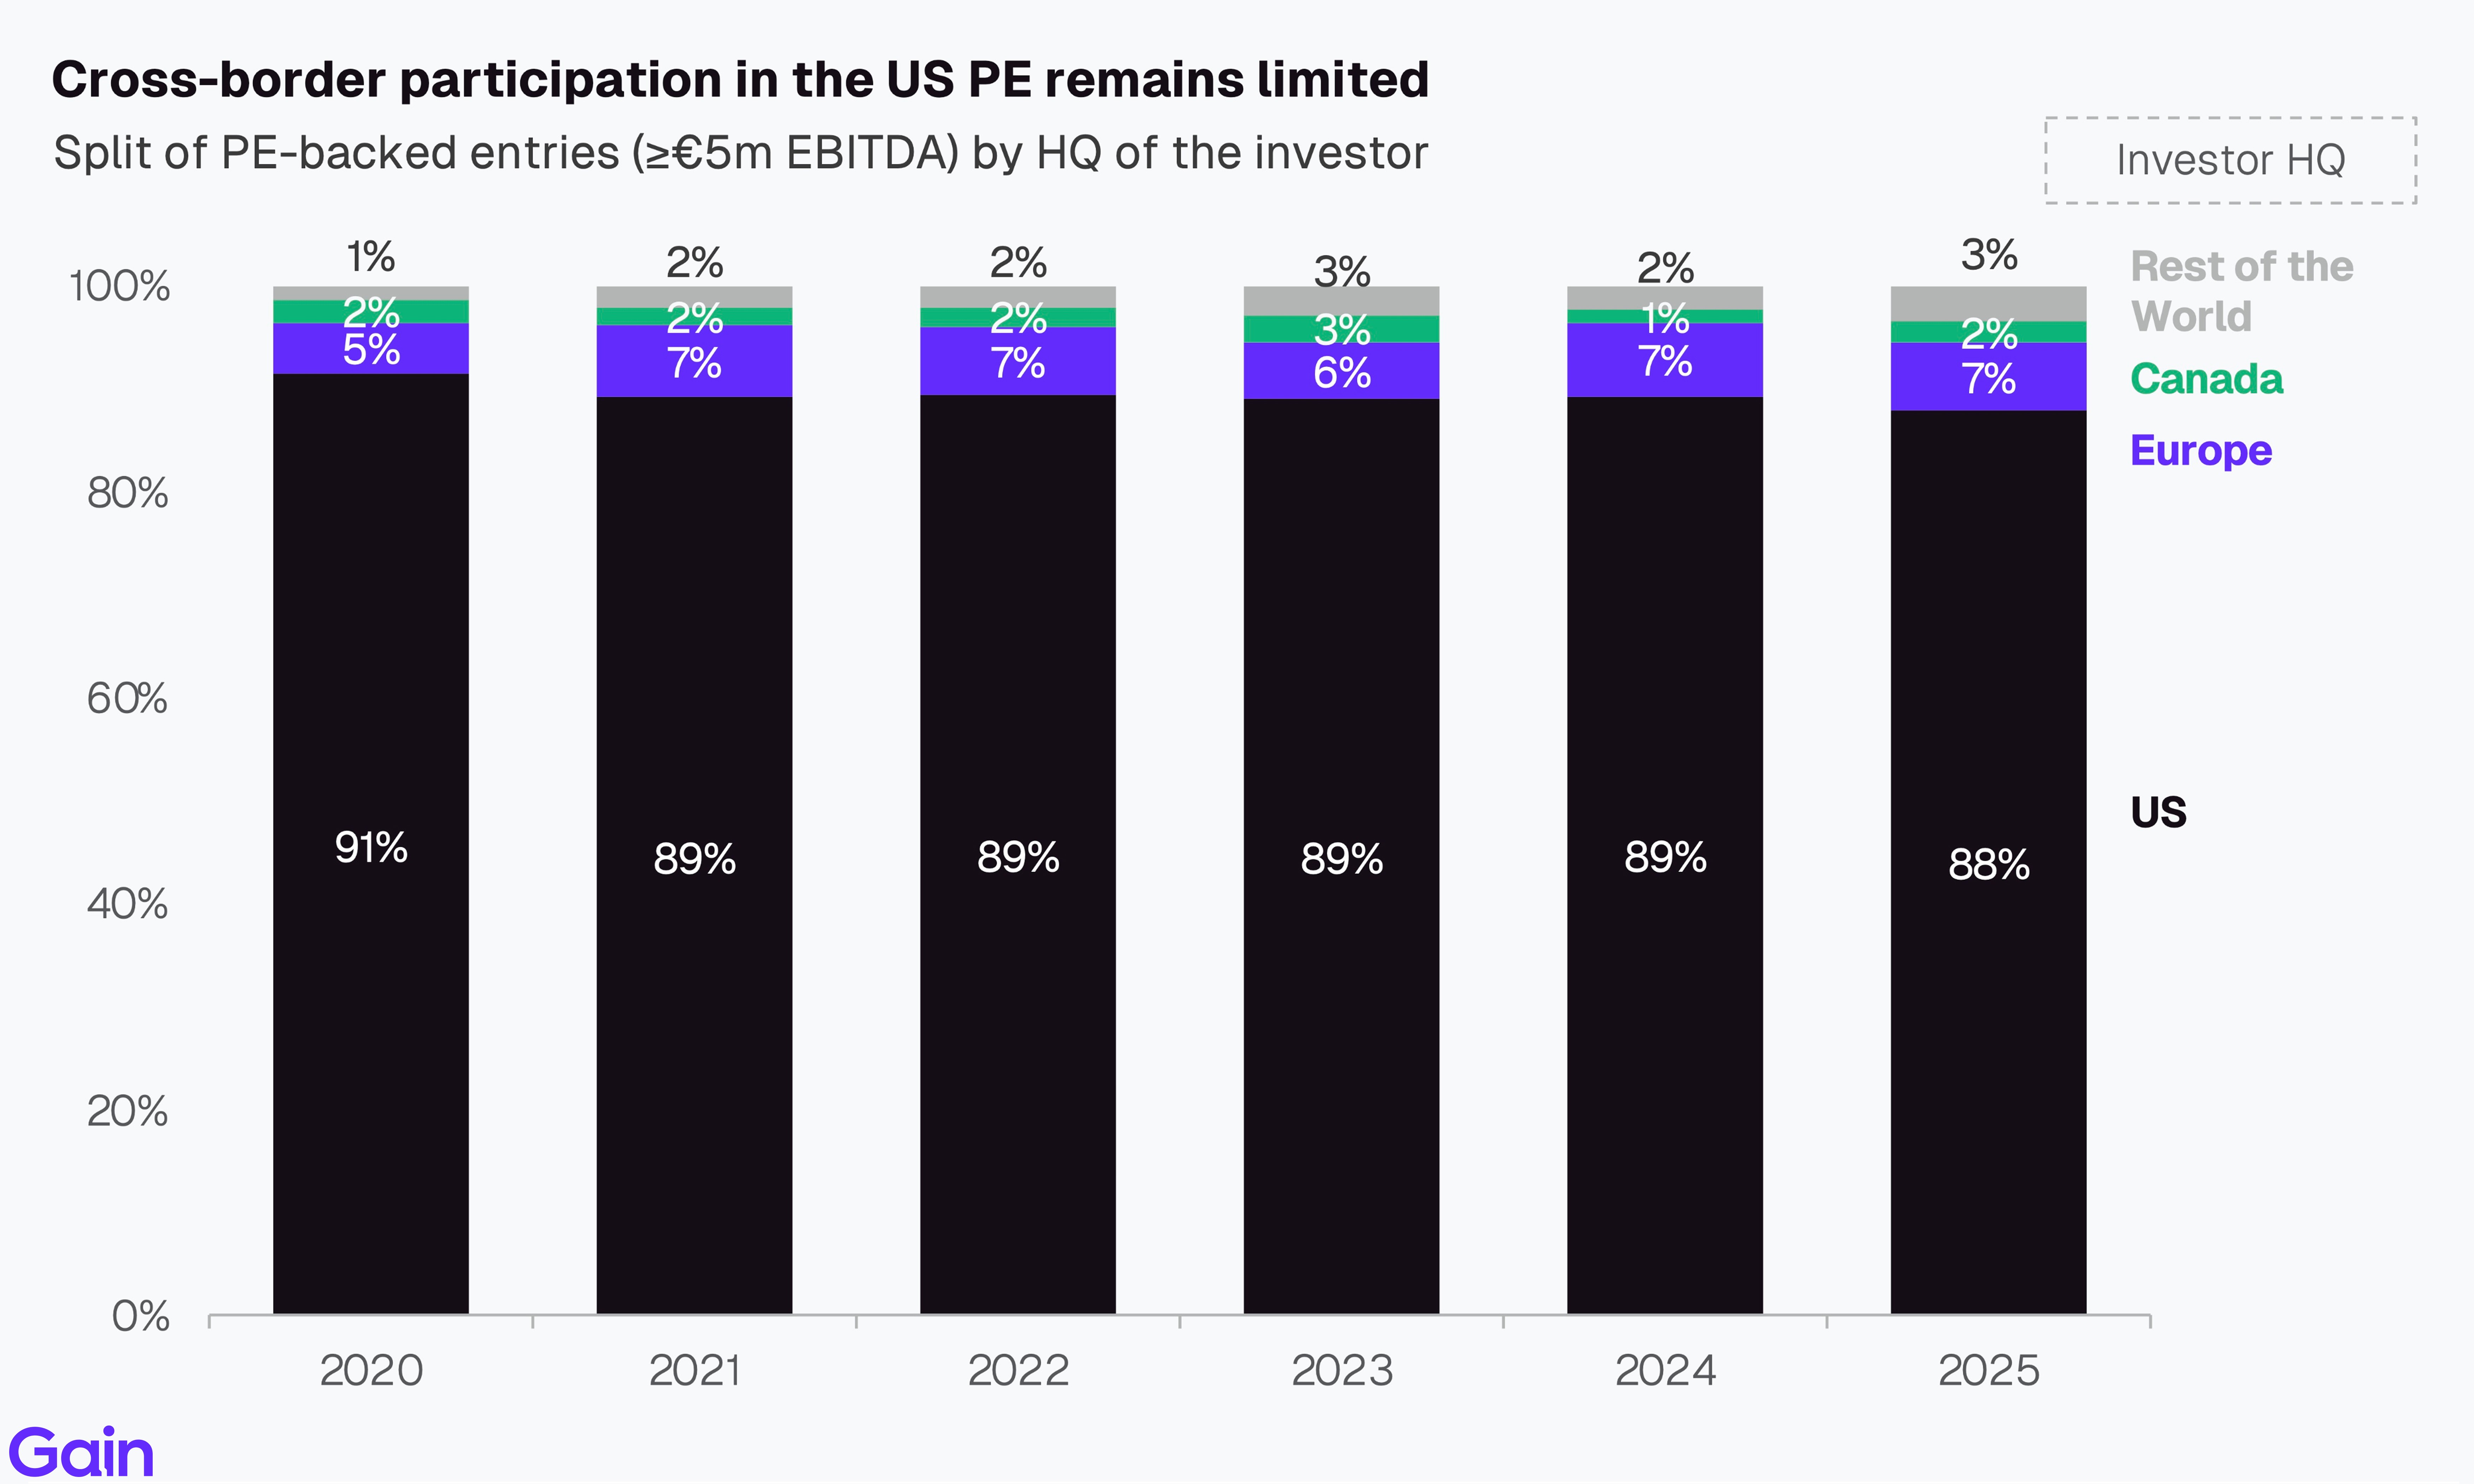
Cross-border investor participation in US PE remains limited, with the market overwhelmingly local. US domestic investors account for ~88% of activity. European investors (7%) represent the largest international investor base, followed by the rest of the world (3%) and Canadian investors (2%), a composition that has shown no meaningful change since 2020.
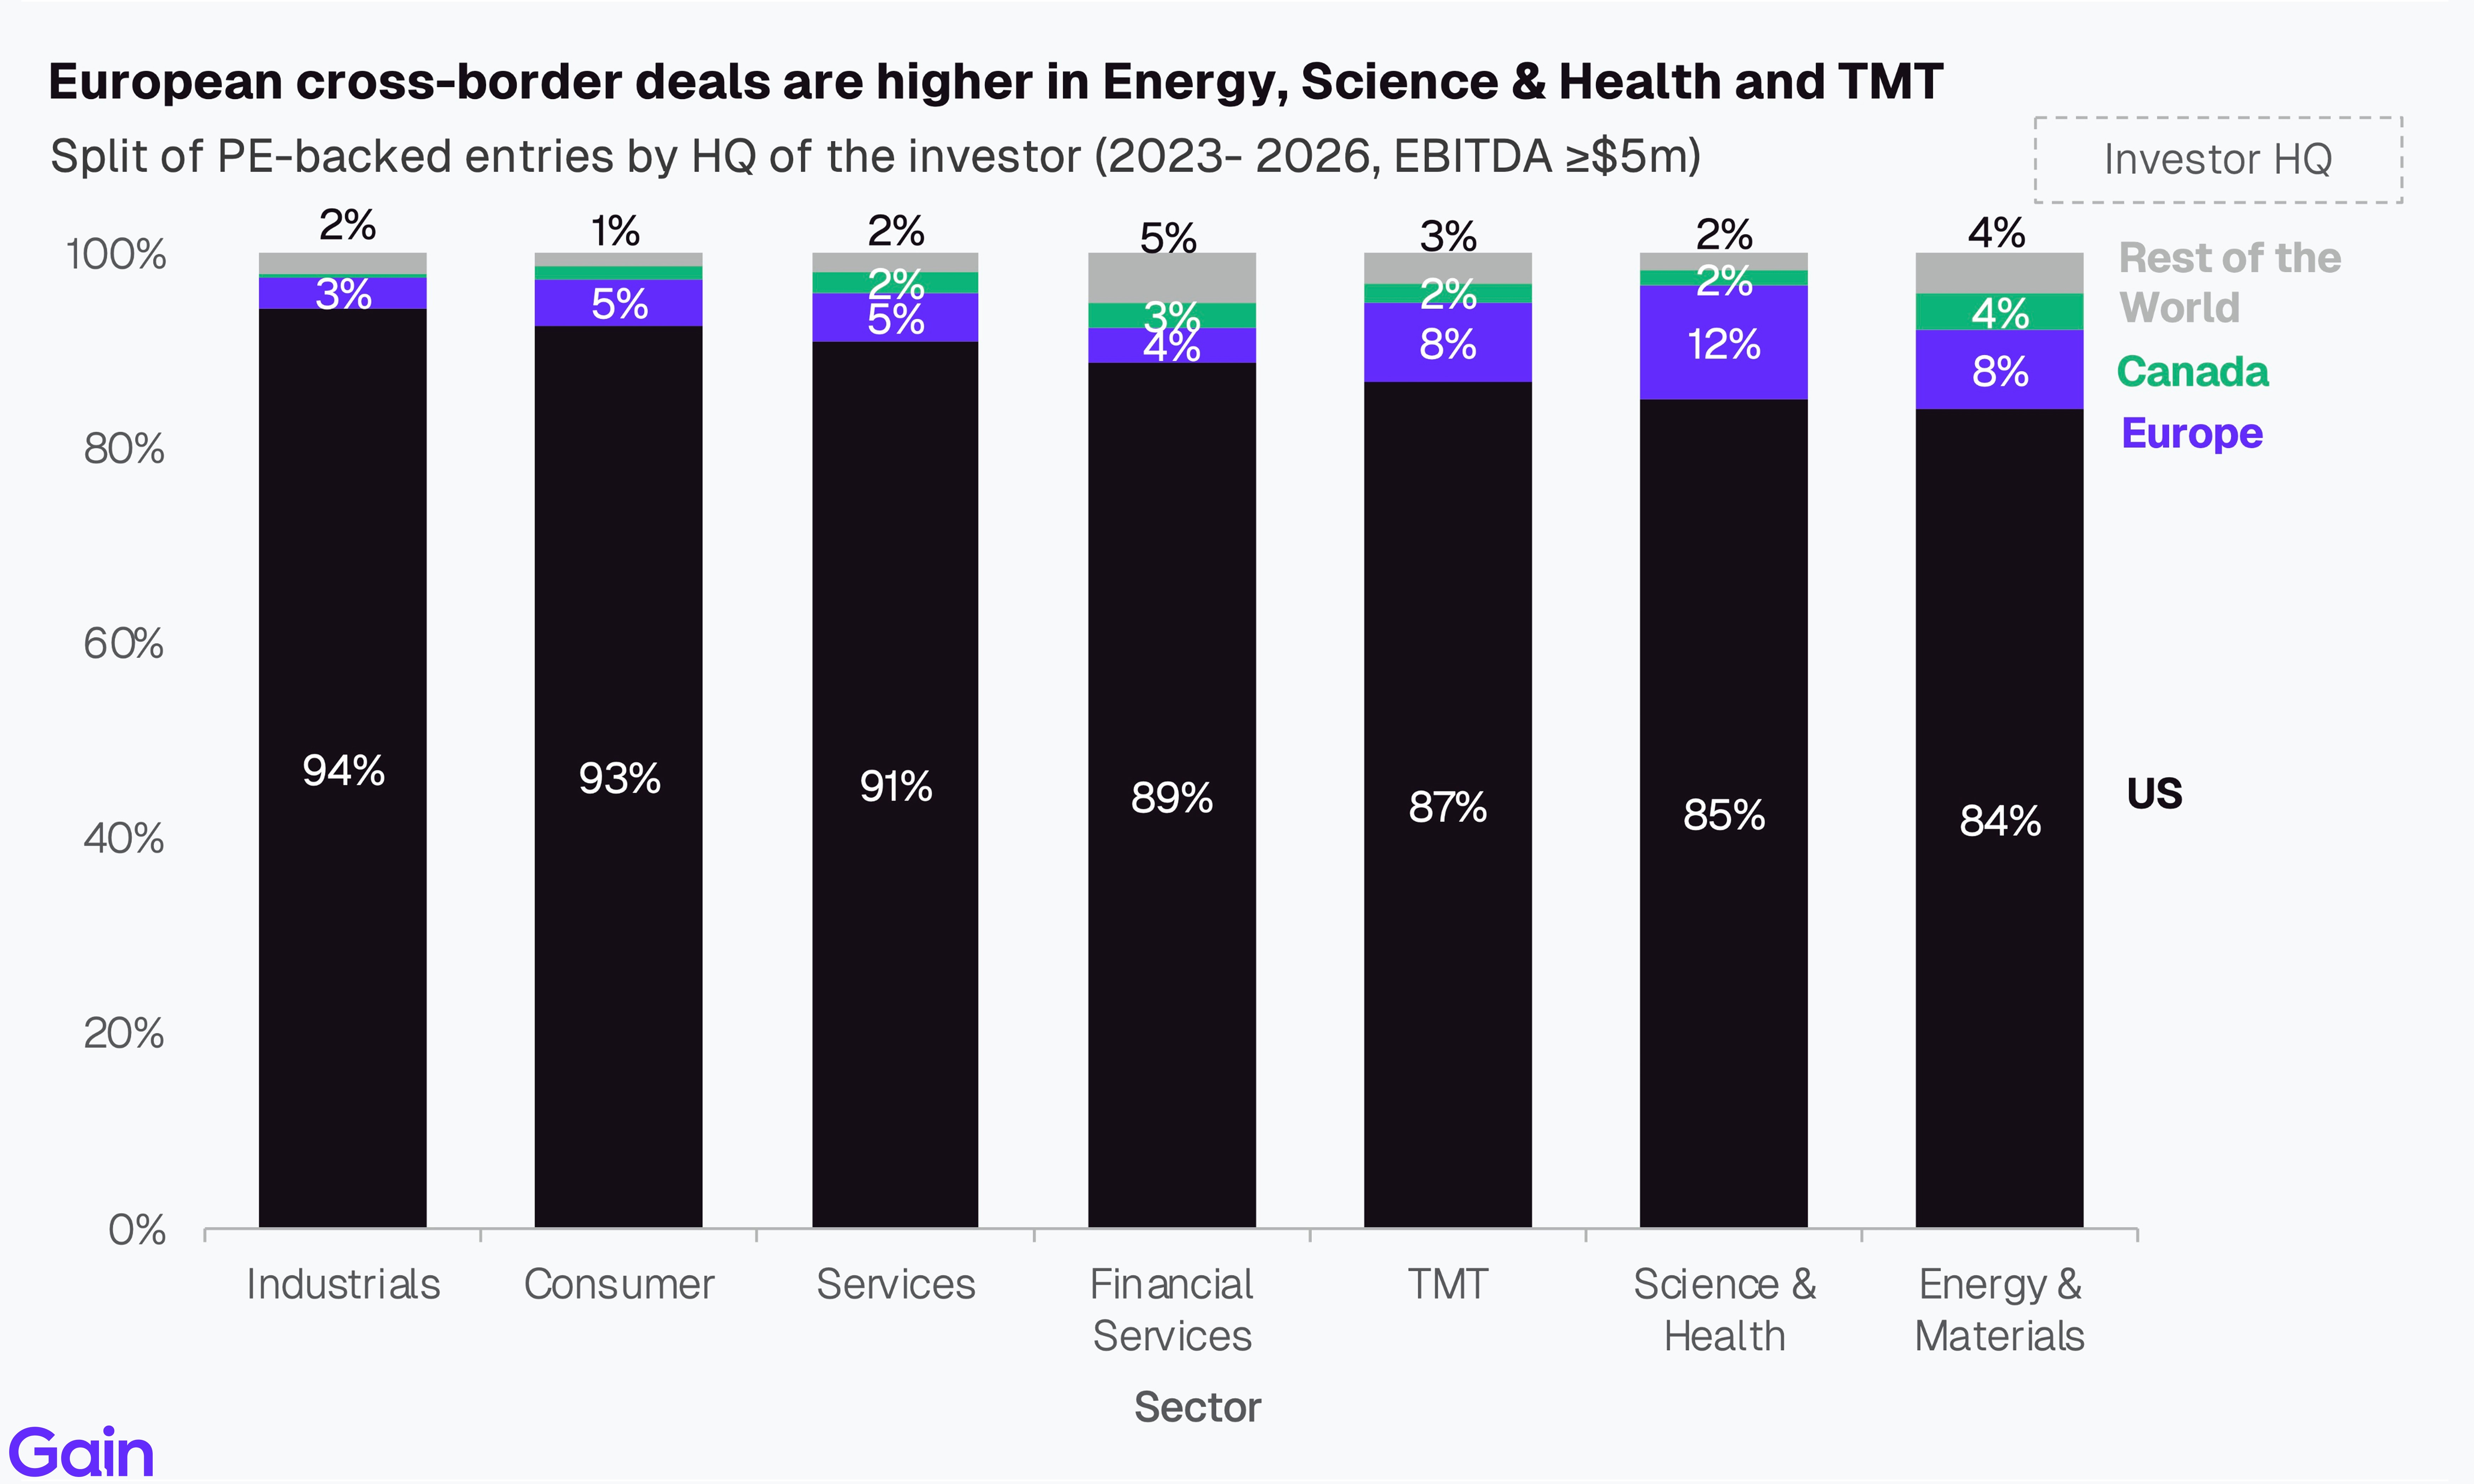
European cross-border deals are higher in Science & Health (12%), Energy & Materials (8%), and TMT (8%). This reflects established expertise in life sciences and energy transition, as well as strong appetite for exposure to the US TMT market.
Entries by Sector
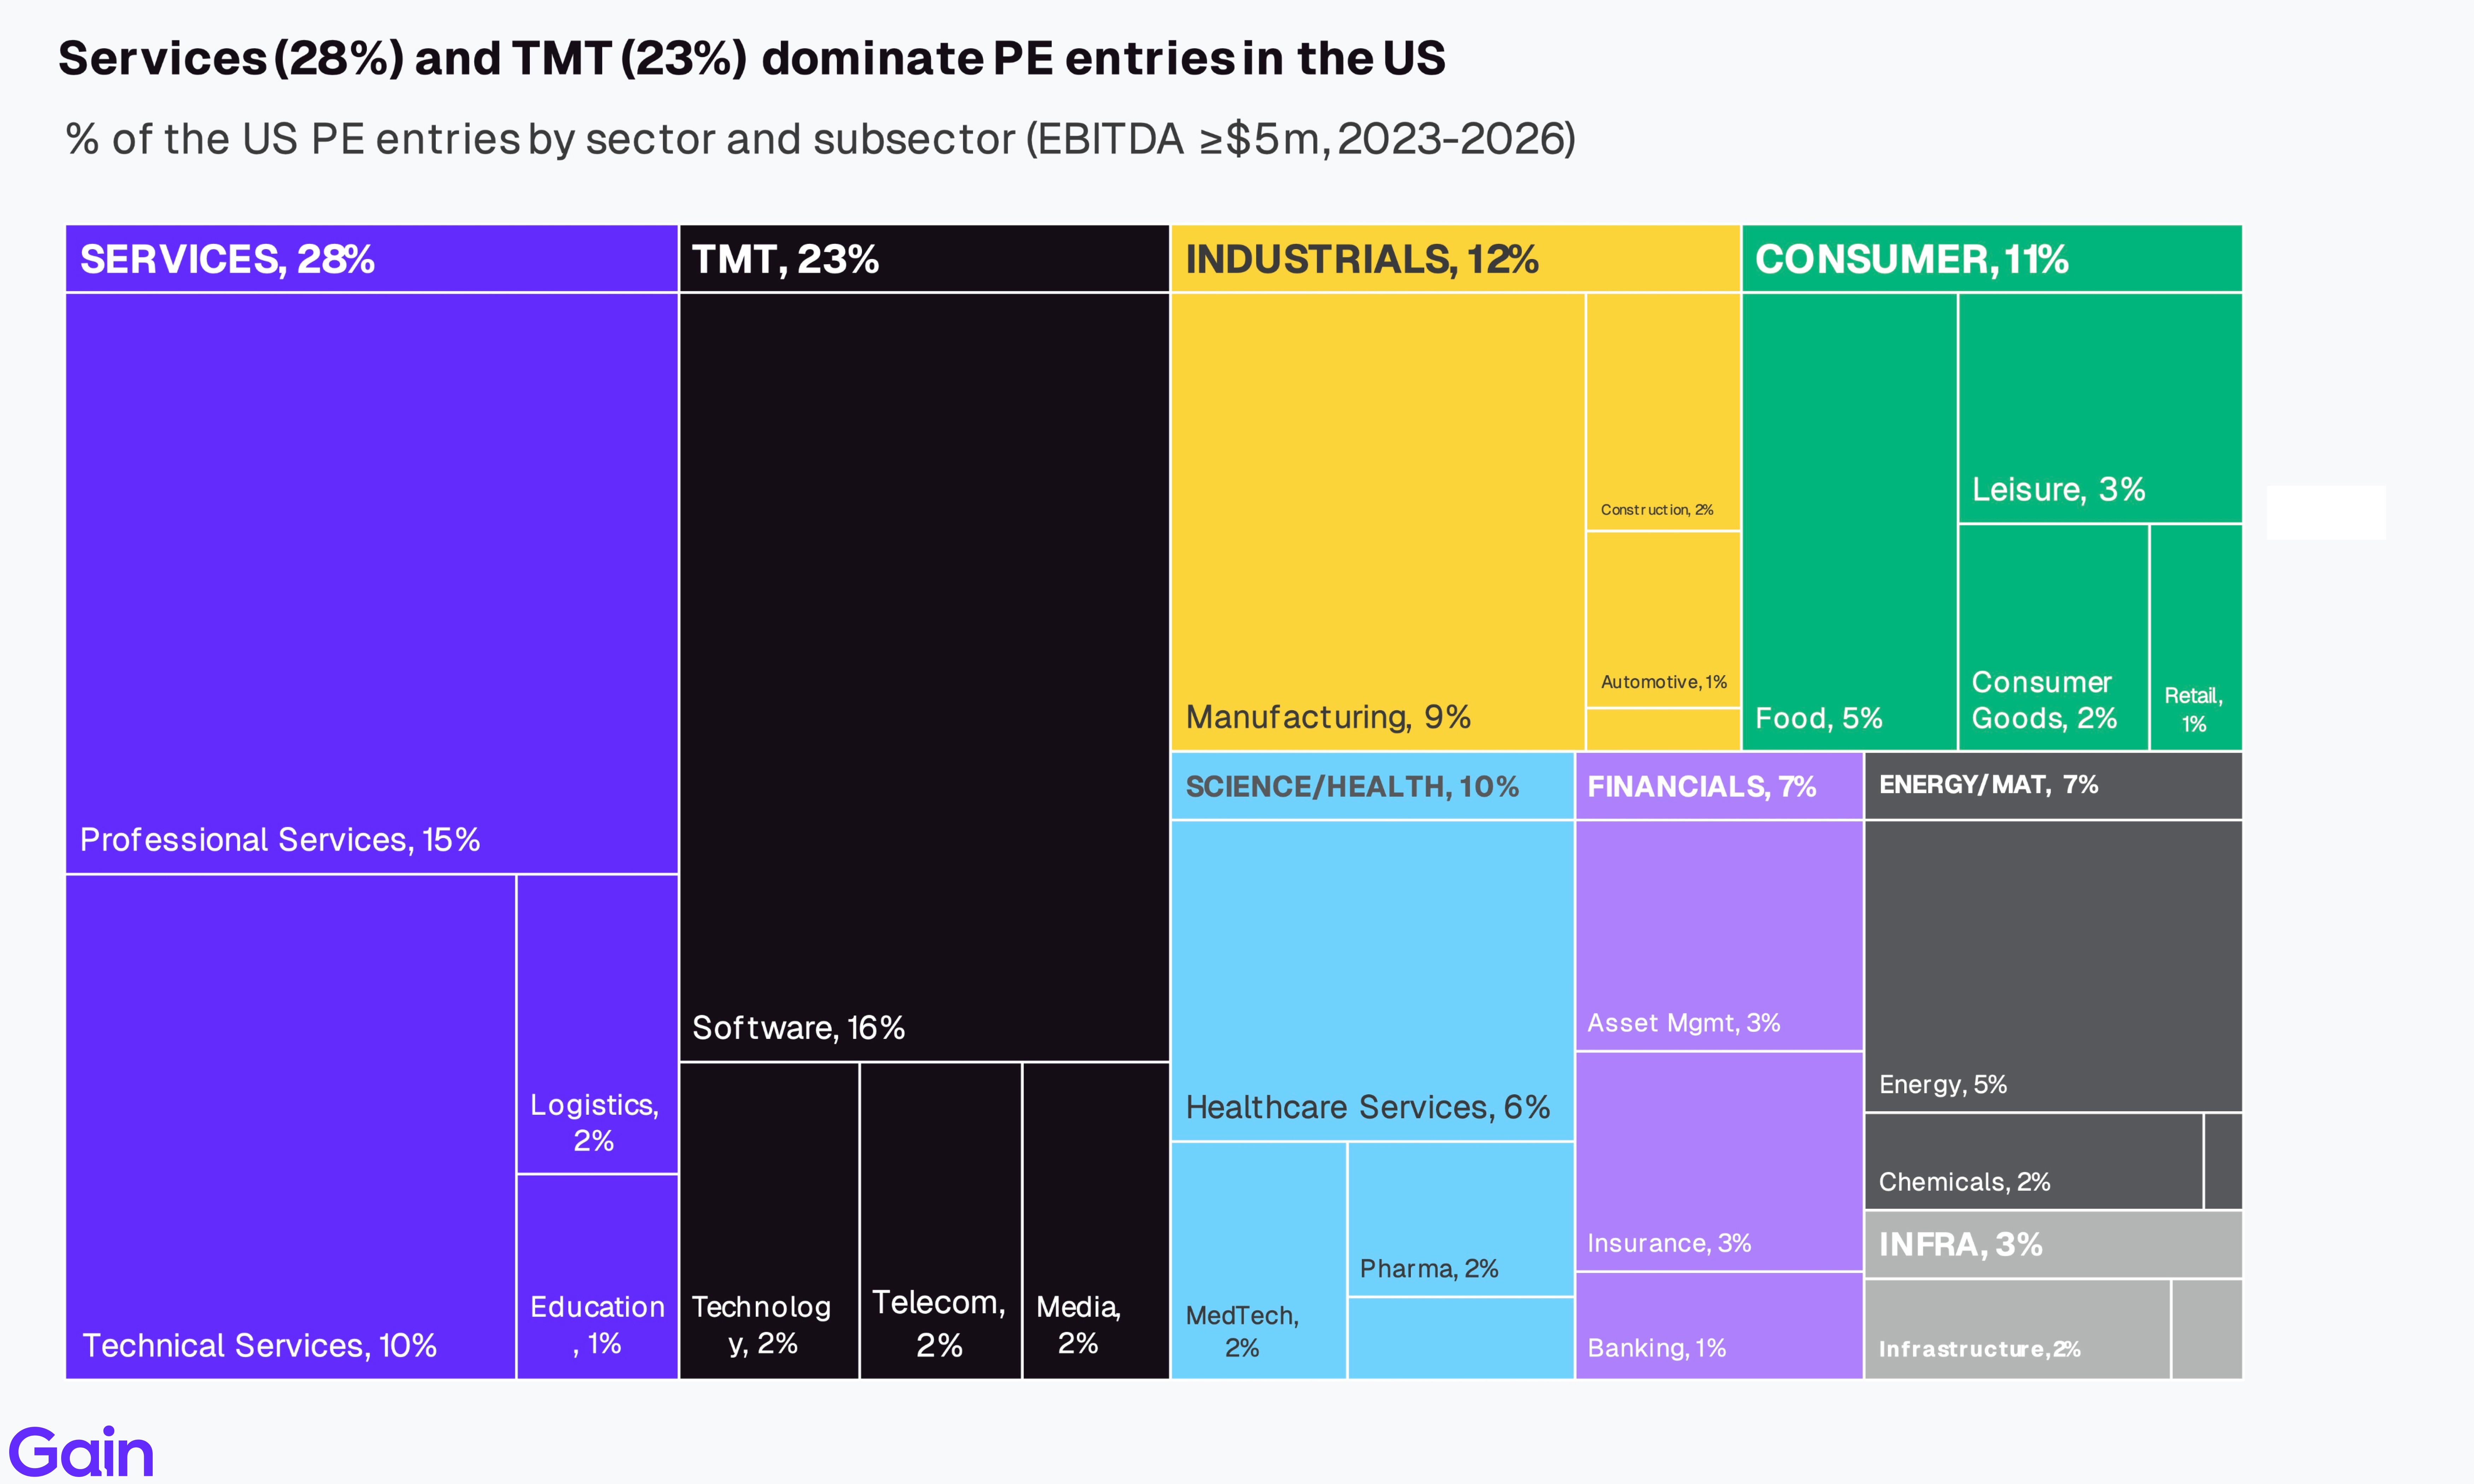
By sector, Services (28%) and TMT (23%) together account for the majority of PE entries in the US by deal count. At the subsector level, Software (16%), Professional Services (15%), and Technical Services (10%) lead activity.
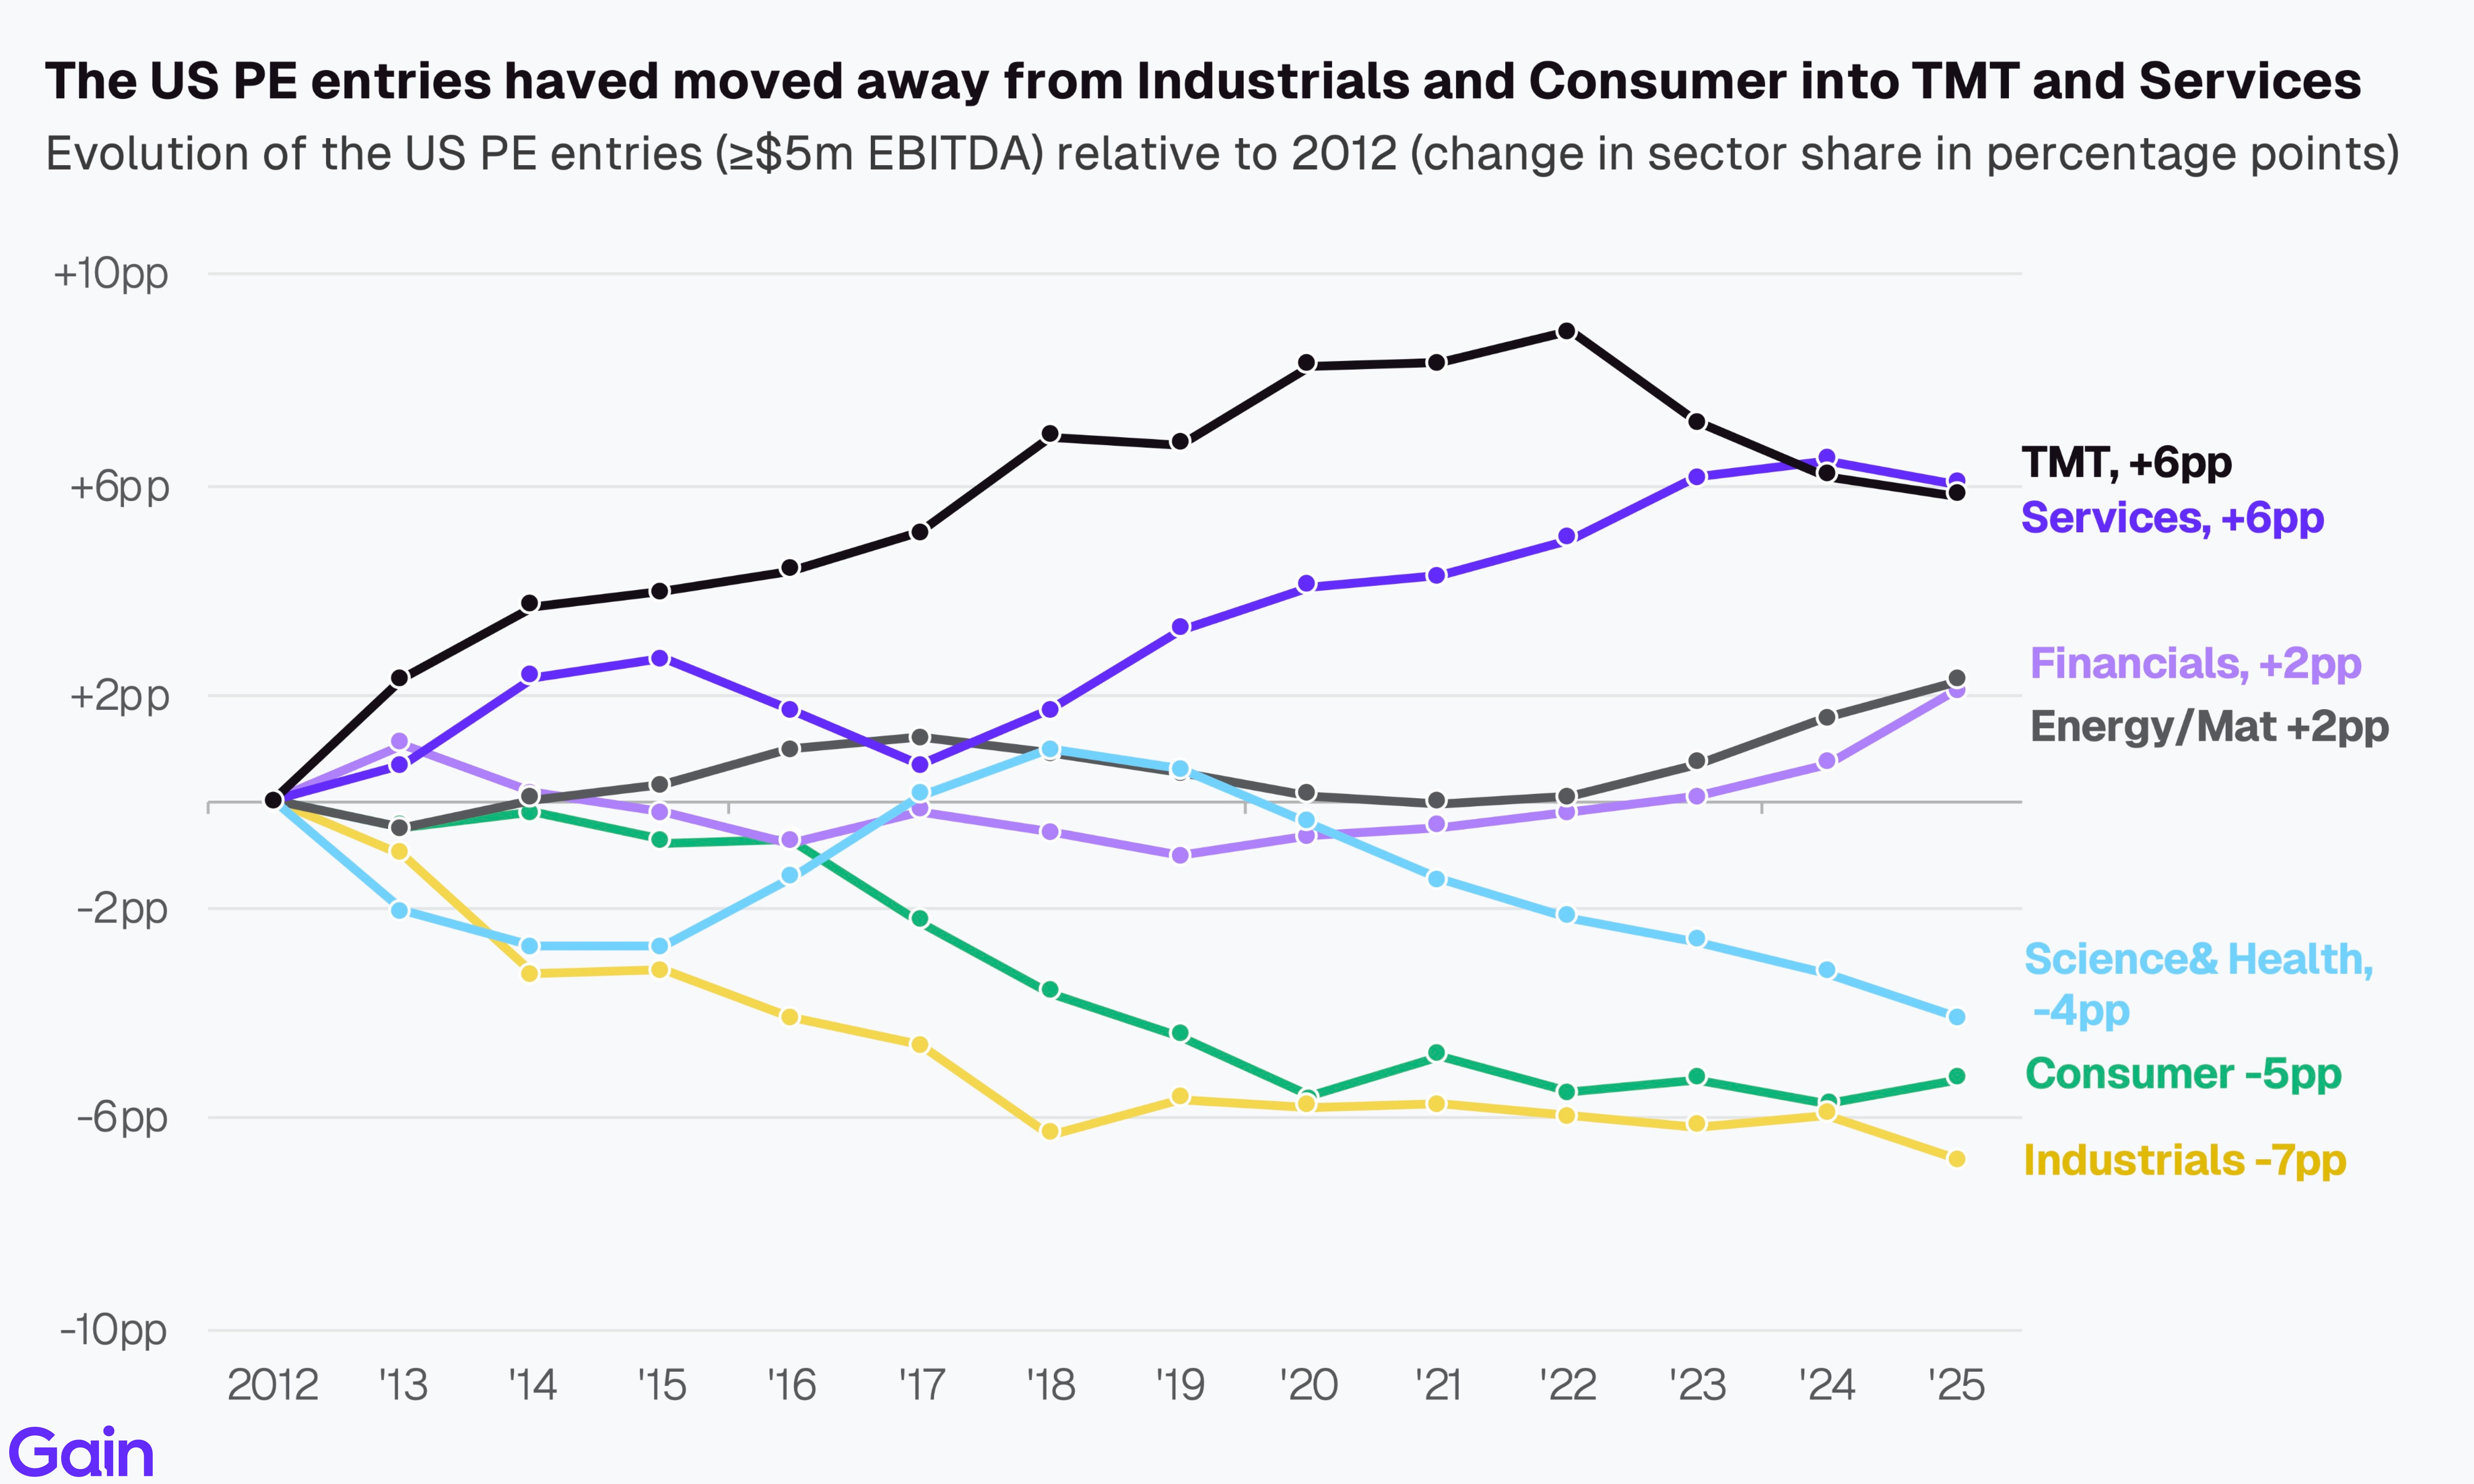
US PE entries have moved away from Industrials (-7pp) and Consumer (-5pp) into TMT (+6pp) and Services (+6pp). TMT has gained the most share since 2012, driven by the secular growth of software. Services, meanwhile, has benefited from investor preference for asset-light businesses and roll-ups. Industrials and Consumer, in contrast, have lost the most share, weighed down by slower growth and a tougher exit environment. The share of Science & Health has also declined on the back of increased regulatory scrutinty and legislative changes.
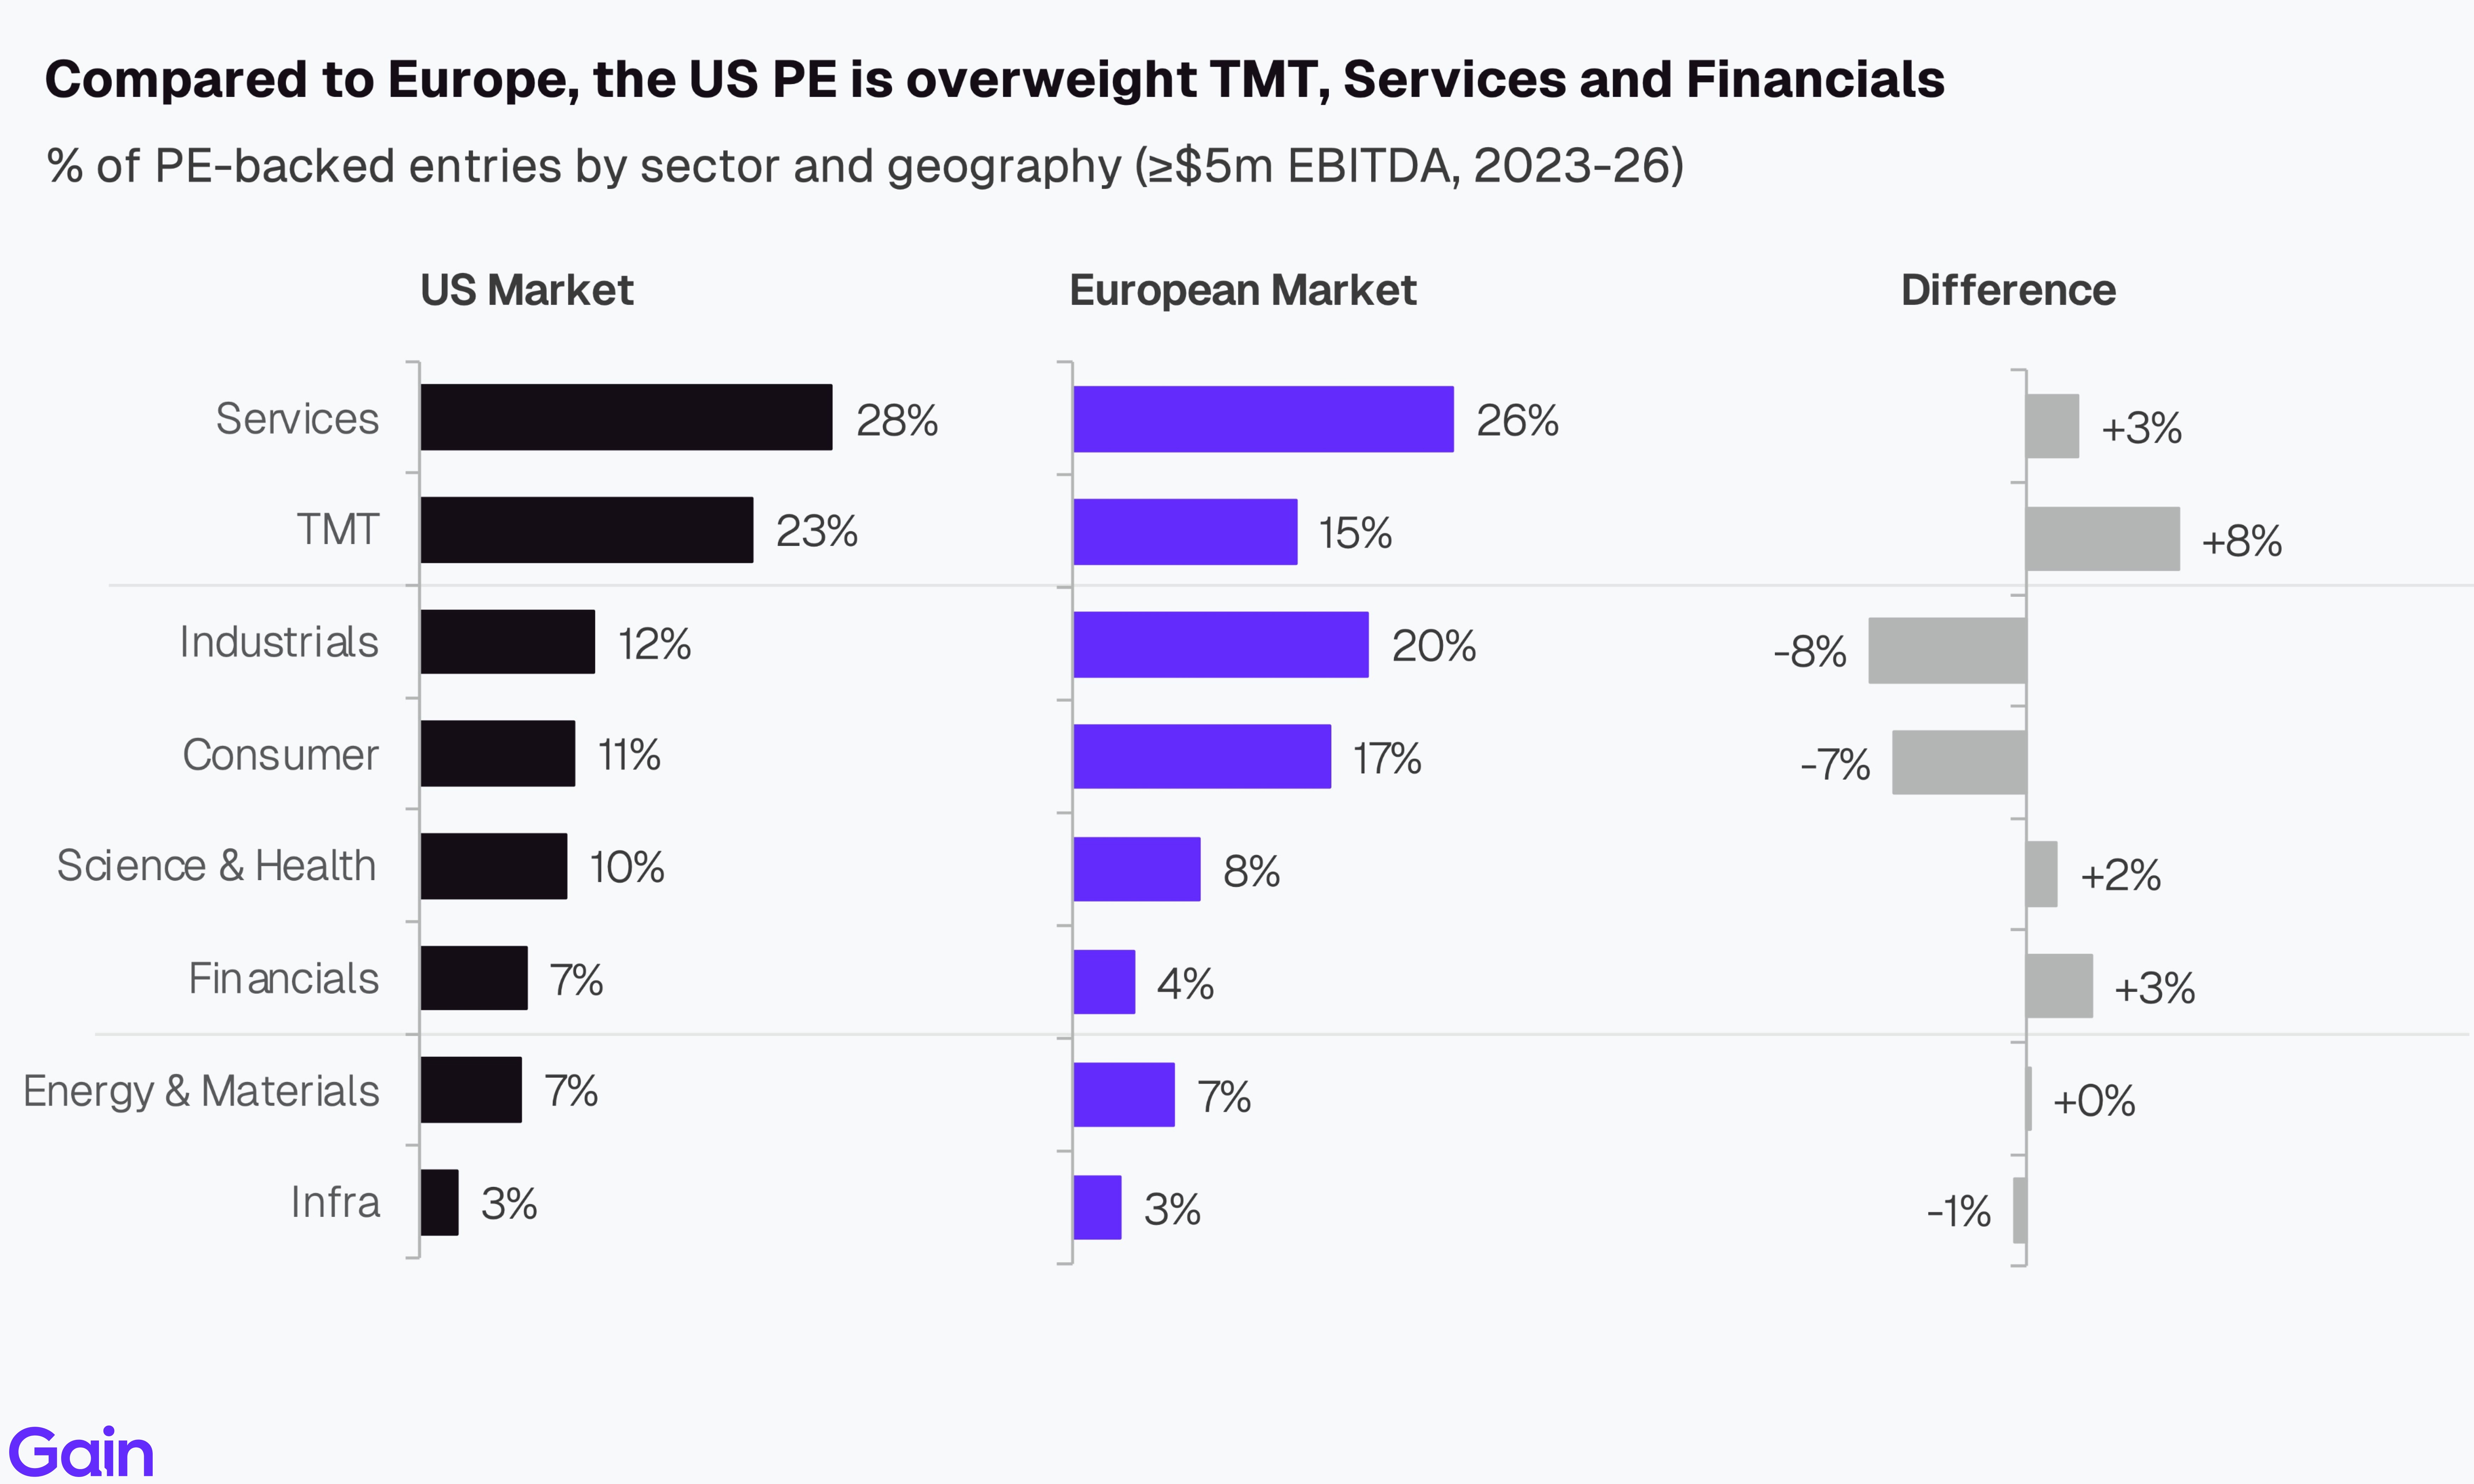
Compared to Europe, US PE is overweight TMT (+8pp), Services (+3pp) and Financials (+3pp). The TMT overweight in particular reflects the greater availability of sizable technology assets for investment and a more developed venture-to-buyout ecosystem. In contrast, the US PE market remains underweight Industrials (-8pp) and Consumer (-7pp), sectors where Europe benefits from a larger base of family-owned businesses and industrial conglomerates as potential targets.
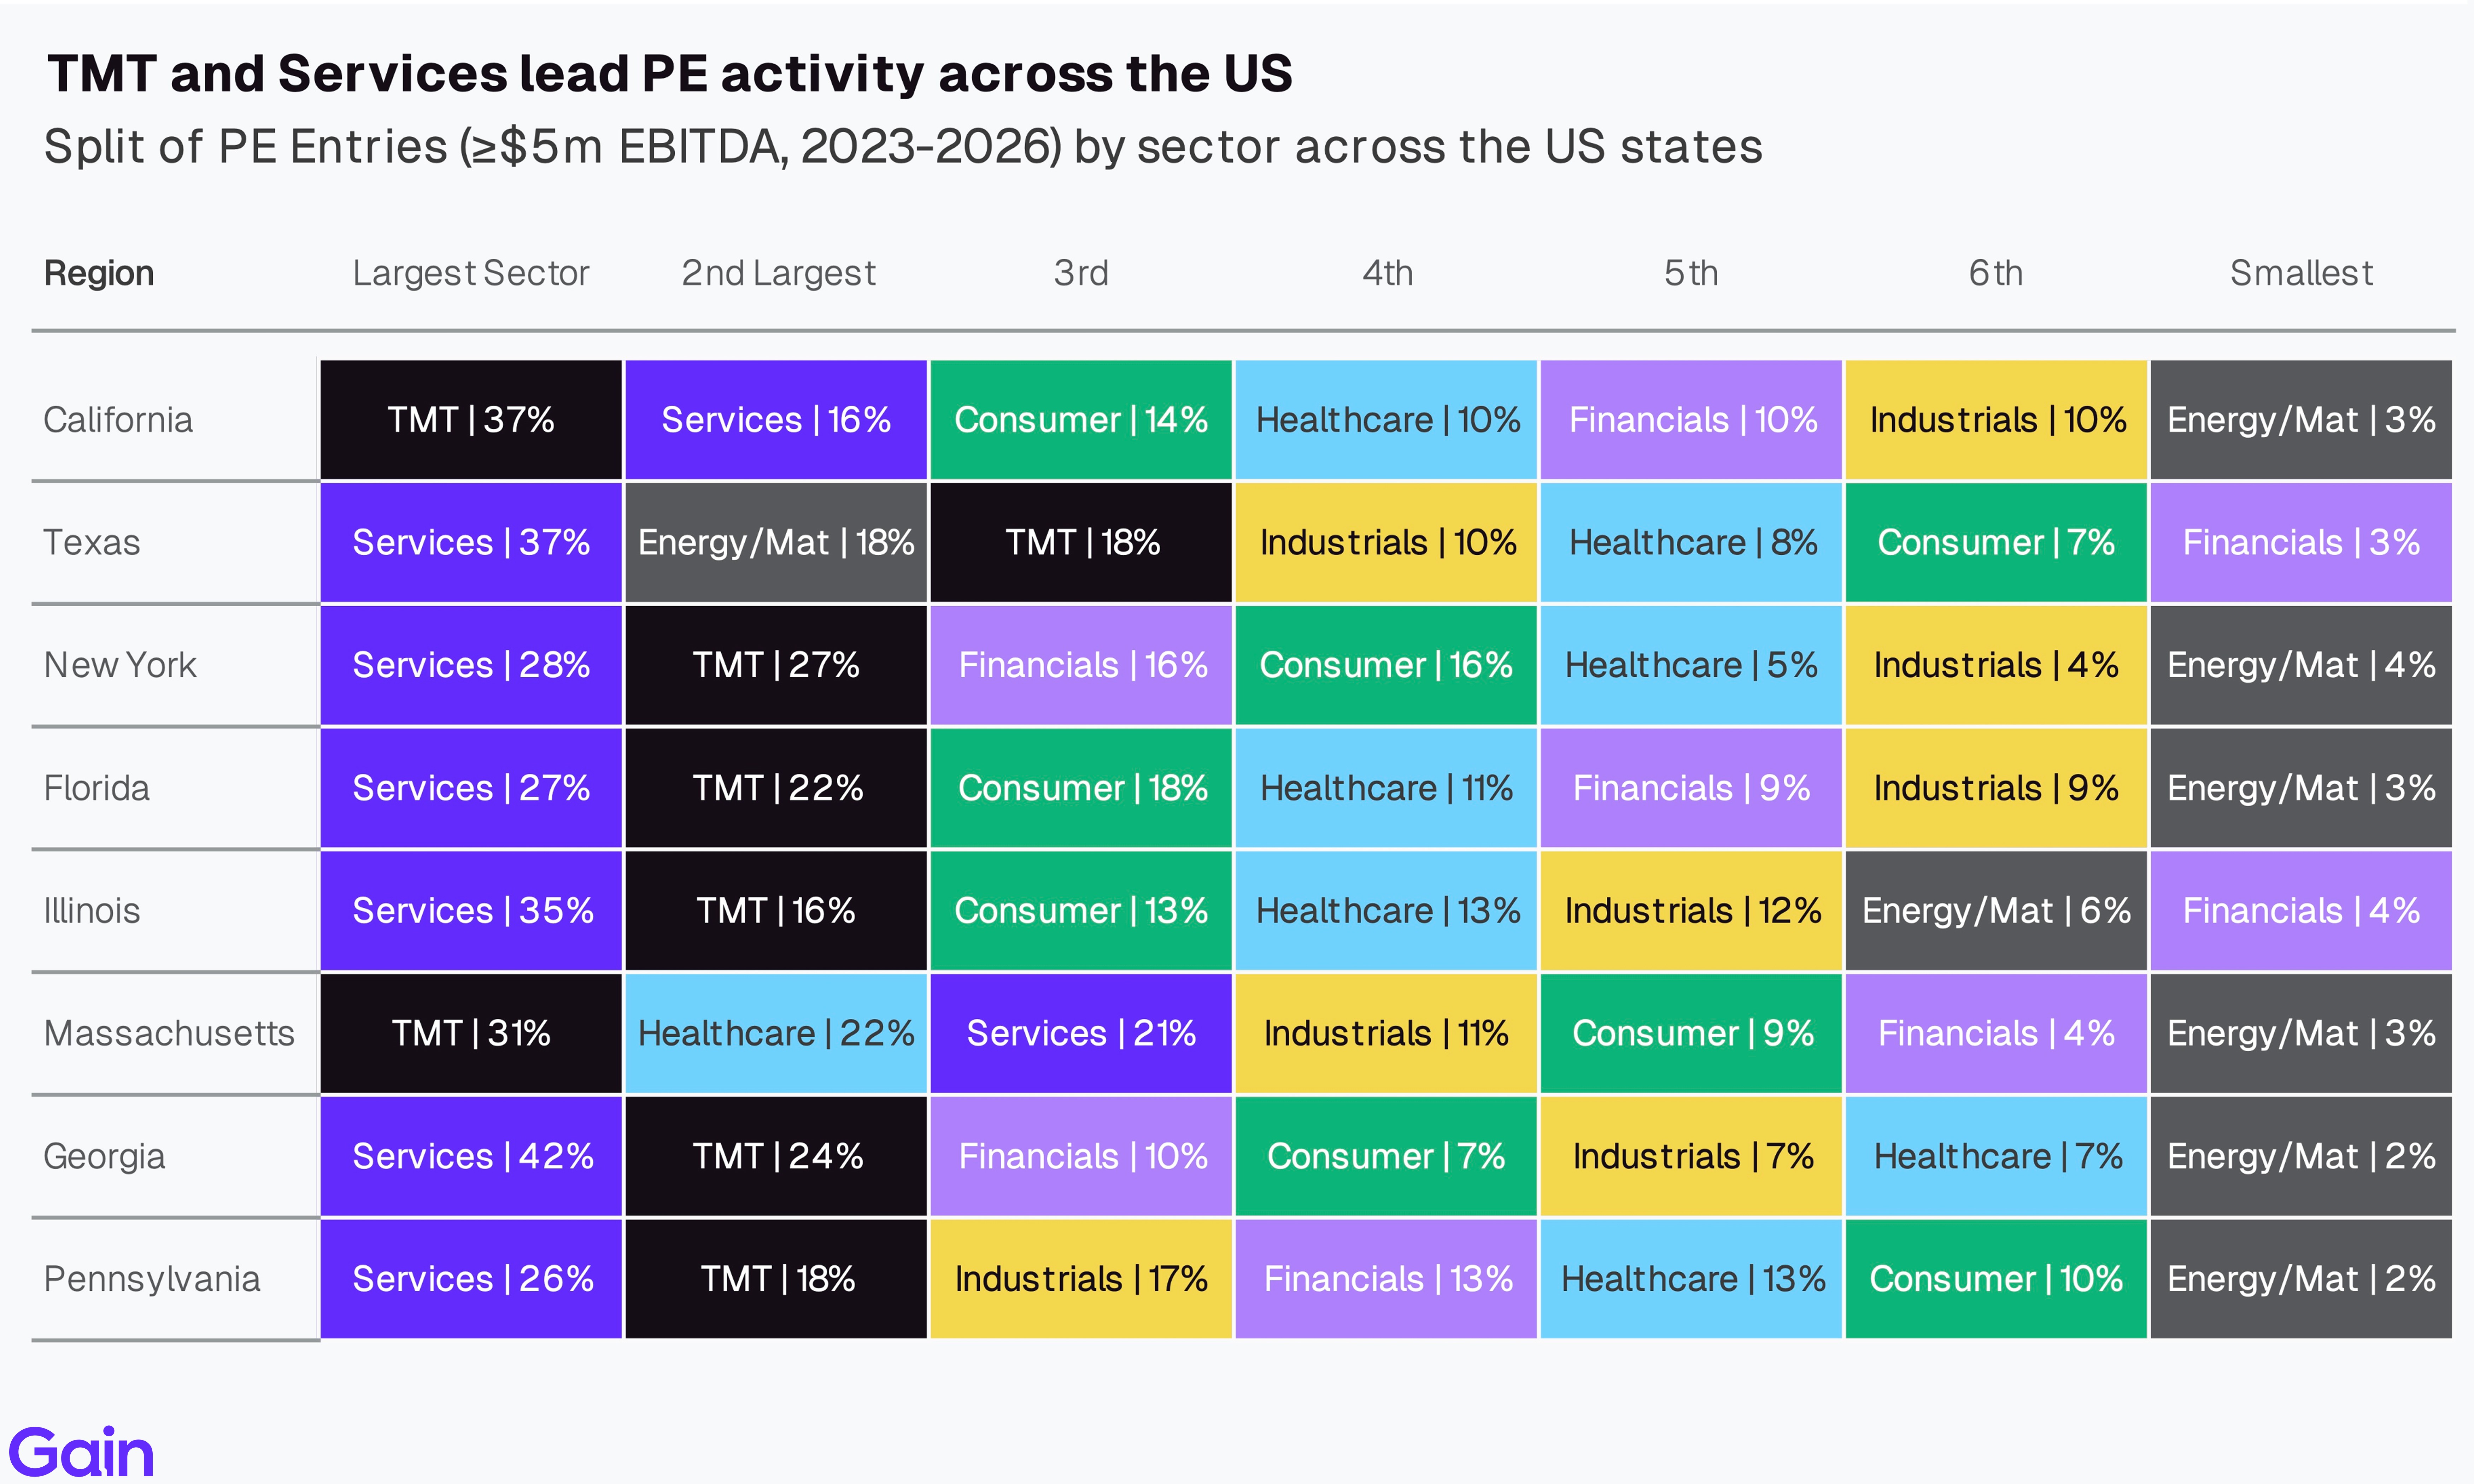
TMT and Services lead PE activity across the US states. TMT is the largest sector in California (37%) and Massachusetts (31%), while Services leads in Georgia (42%), Texas (37%), Illinois (35%), Florida (27%), New York (27%), and Pennsylvania (26%). Texas, meanwhile, stands out as the only state where Energy & Materials ranks in the top two (18%).
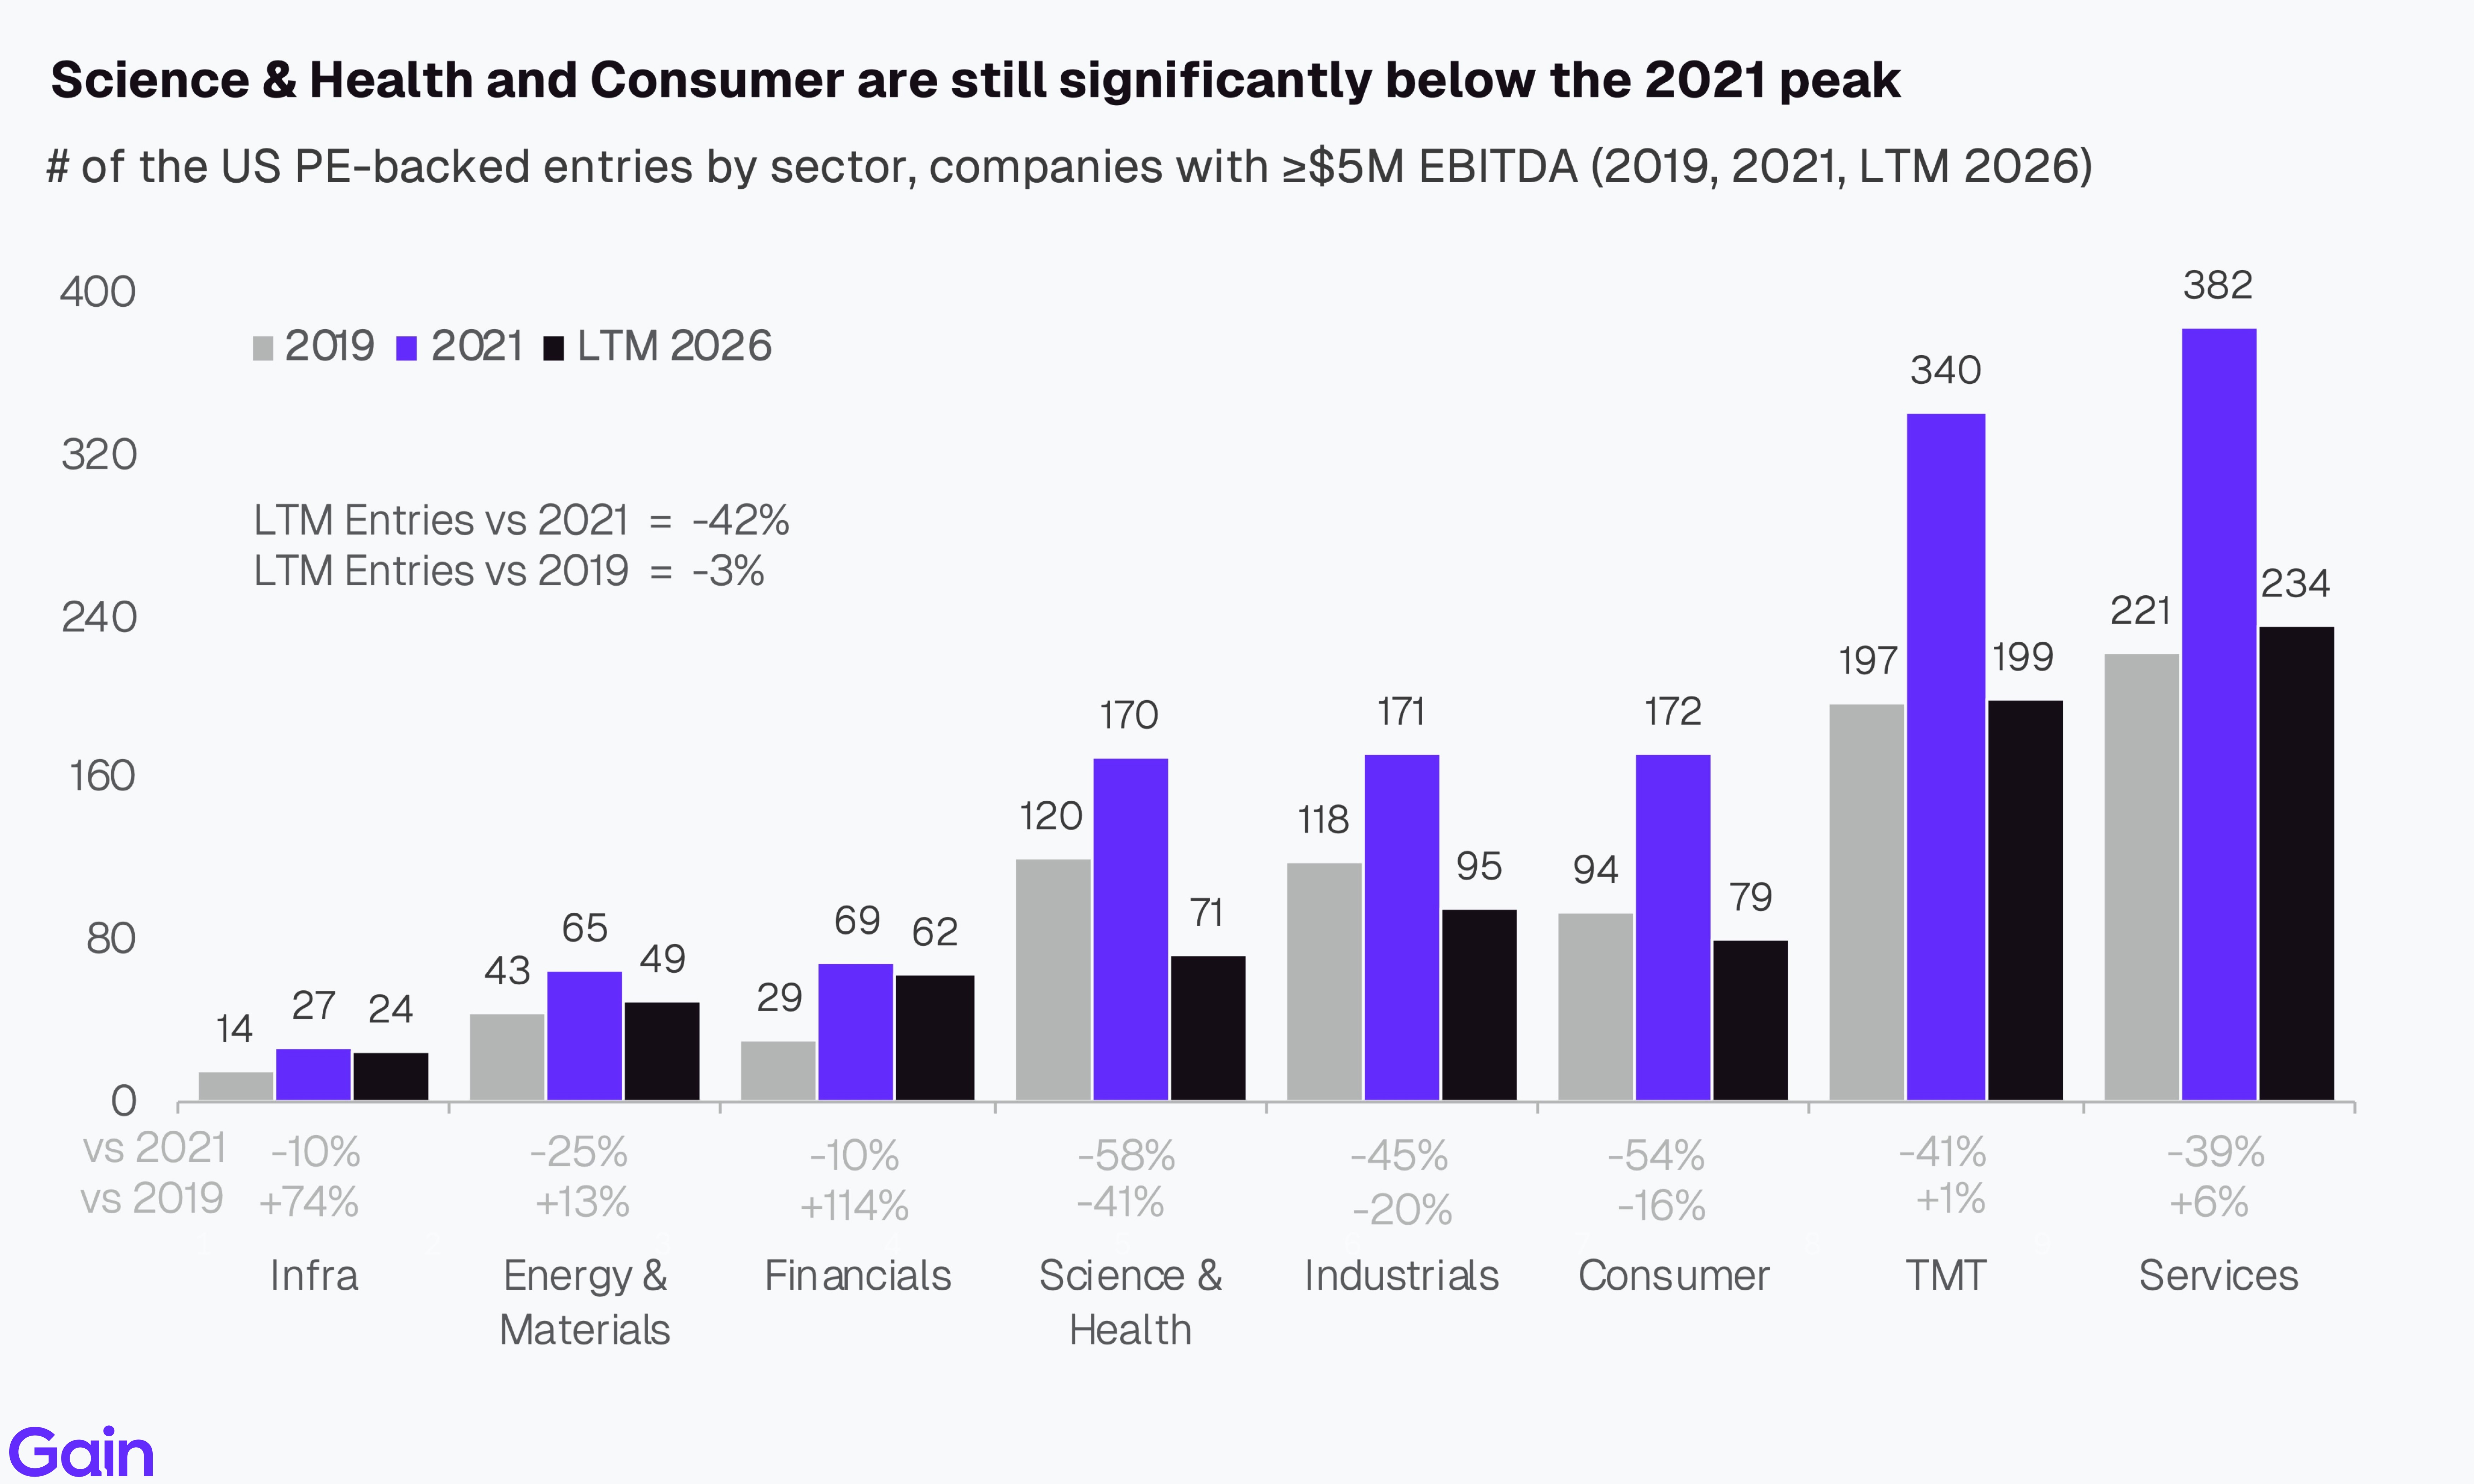
Science & Health (-58%) and Consumer (-54%) remain significantly below the 2021 peak. Consumer faces secular headwinds from slower growth and margin pressure, while Science & Health has been pressured by recent legislative changes, including expired Affordable Care Act (Obamacare) subsidies, Medicaid cuts, and stricter enrollment rules. Additionally, the sector faces intensified federal and state antitrust scrutiny of healthcare M&A, particularly roll-ups. In contrast, TMT (-41%) and Services (-39%) have fared better, with Services +6% above 2019 levels and TMT broadly flat (+1%).
Entries by Region
The South and West dominate PE entries in the US, accounting for 58% of activity. The South leads at 36% of all entries, driven by Texas (12%), Florida (7%), and Georgia (4%), while the West accounts for 22%, with California (12%) being the largest single state. The Northeast and Midwest each account for roughly 20% of PE activity, with New York (7%) and Illinois (6%) the leading states in their respective regions.

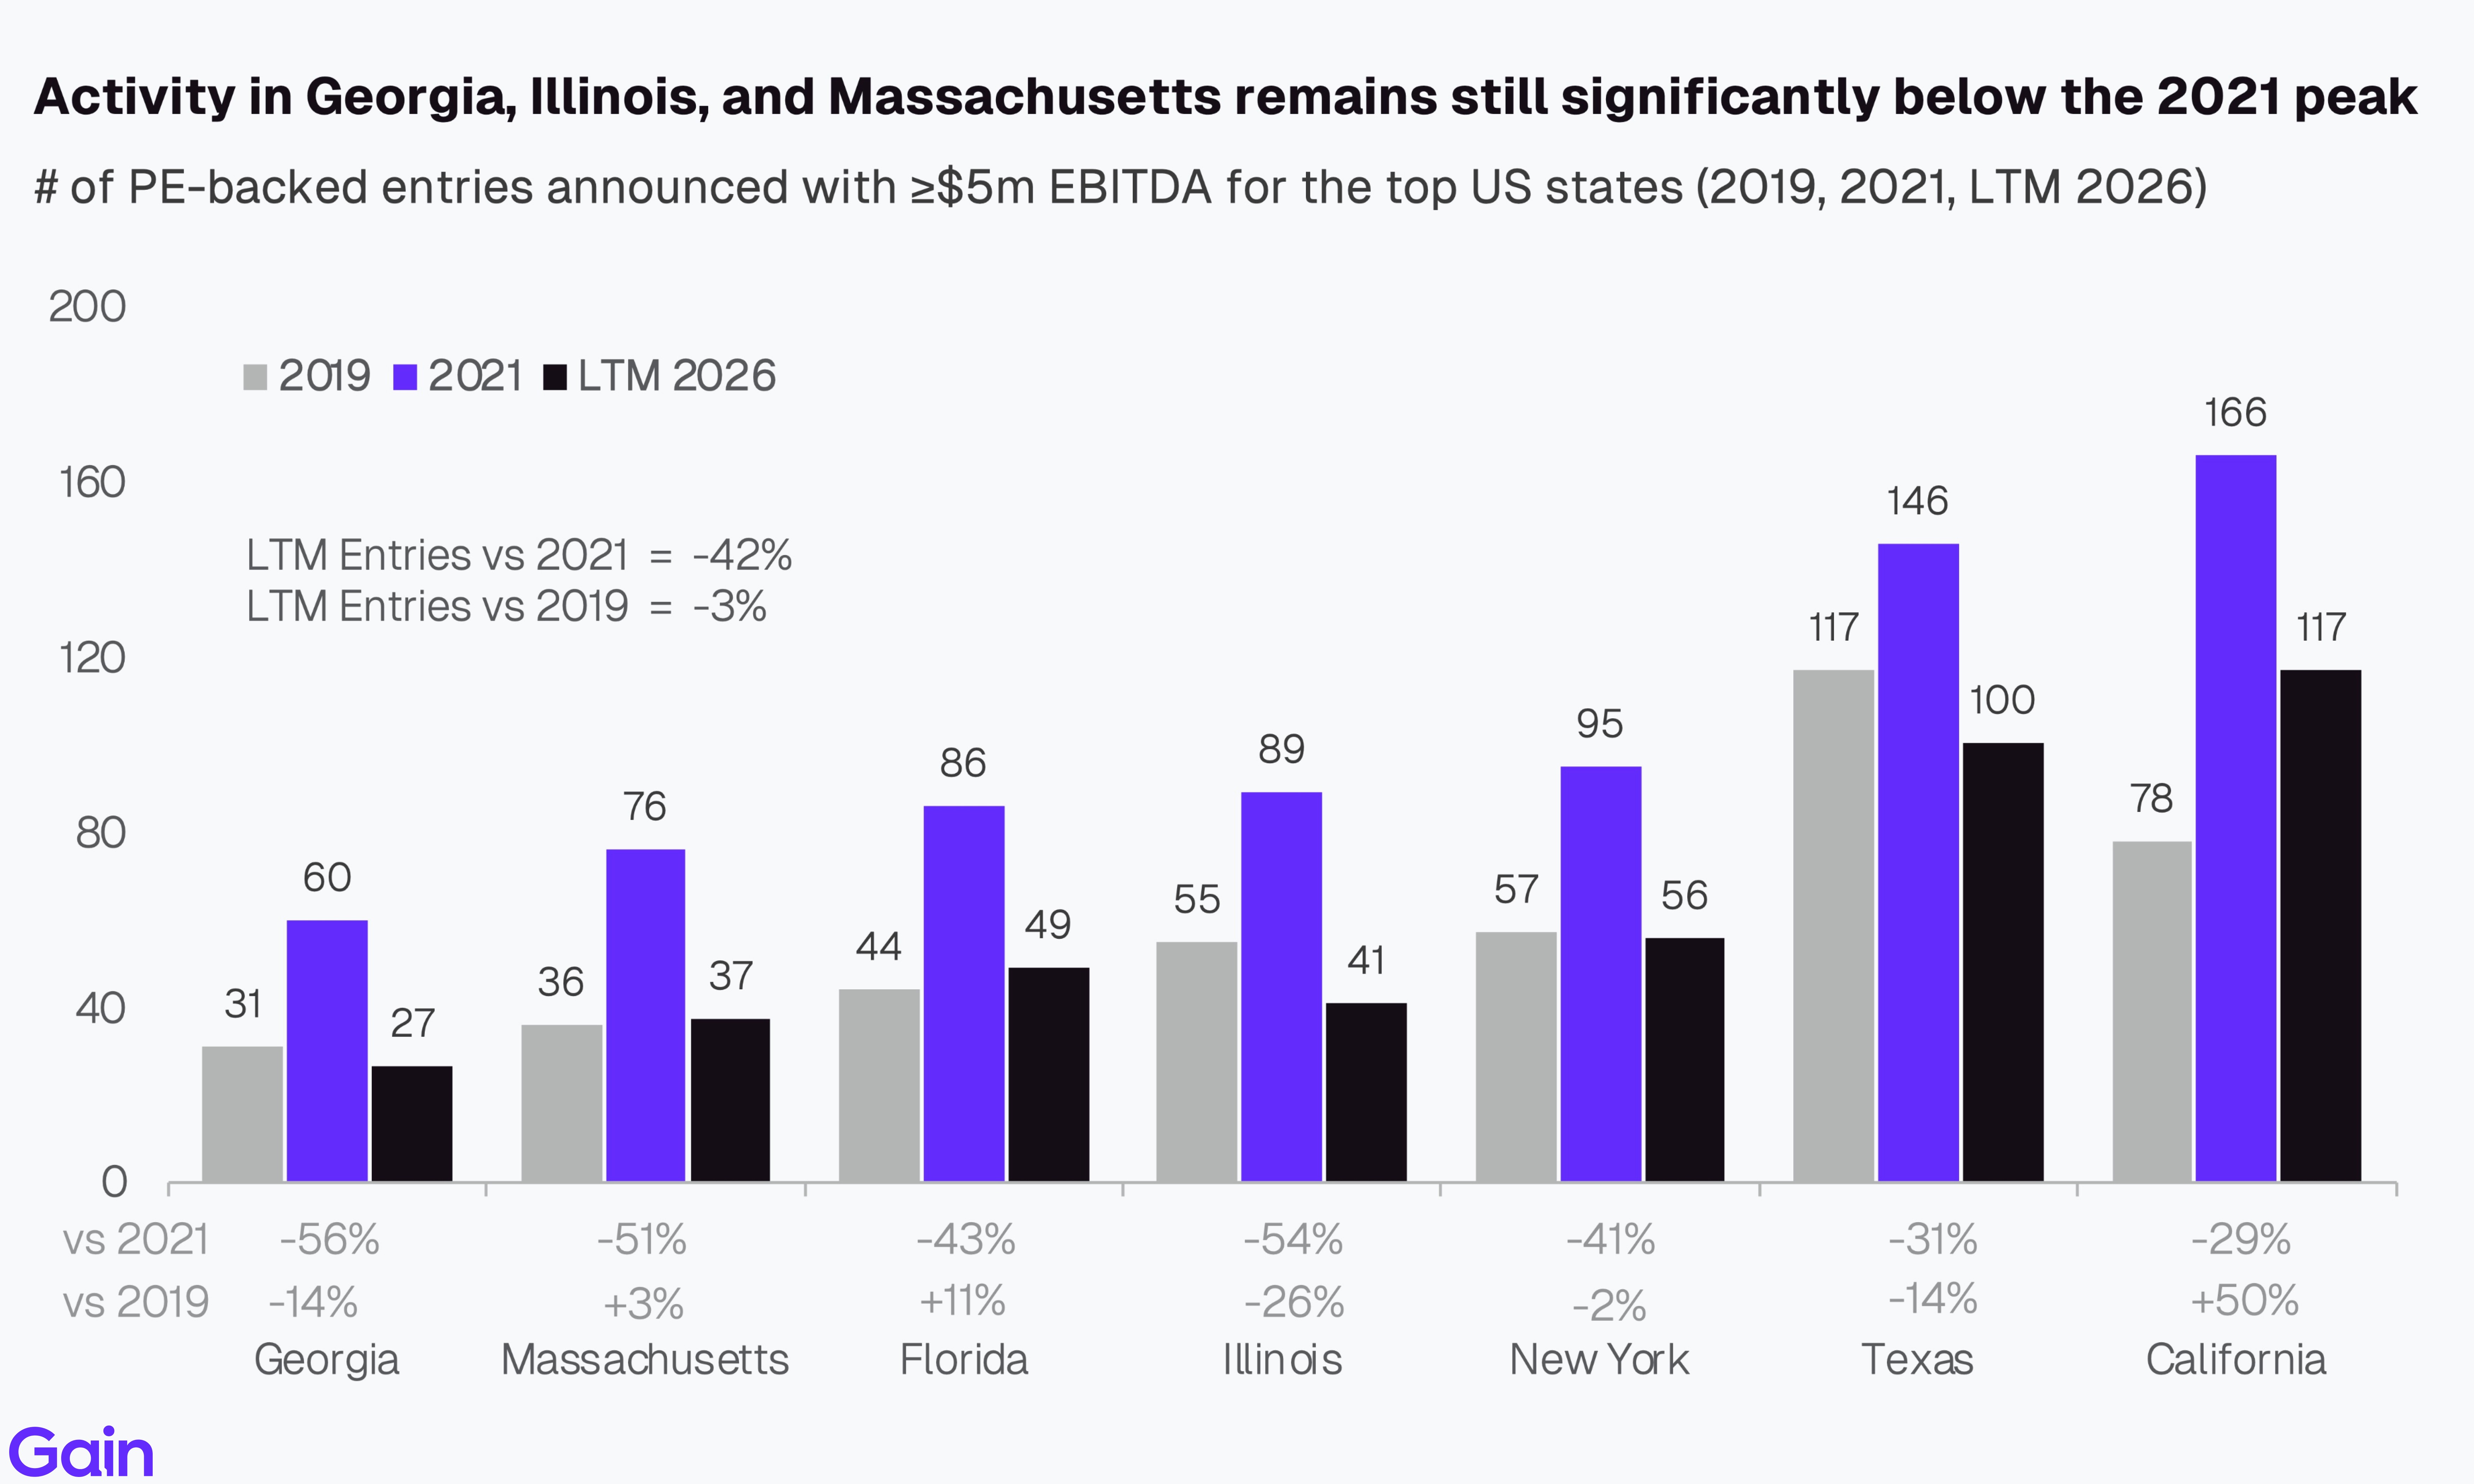
Activity in Georgia (-56%), Illinois (-54%), and Massachusetts (-51%) remains significantly below the 2021 peak. California (-29%) and Texas (-31%) have fared relatively better, with California notably ahead of 2019 levels (+50%). New York (-41%) and Florida (-43%) sit in the middle, down substantially from 2021 but largely unchanged from 2019 levels.
Co-investments
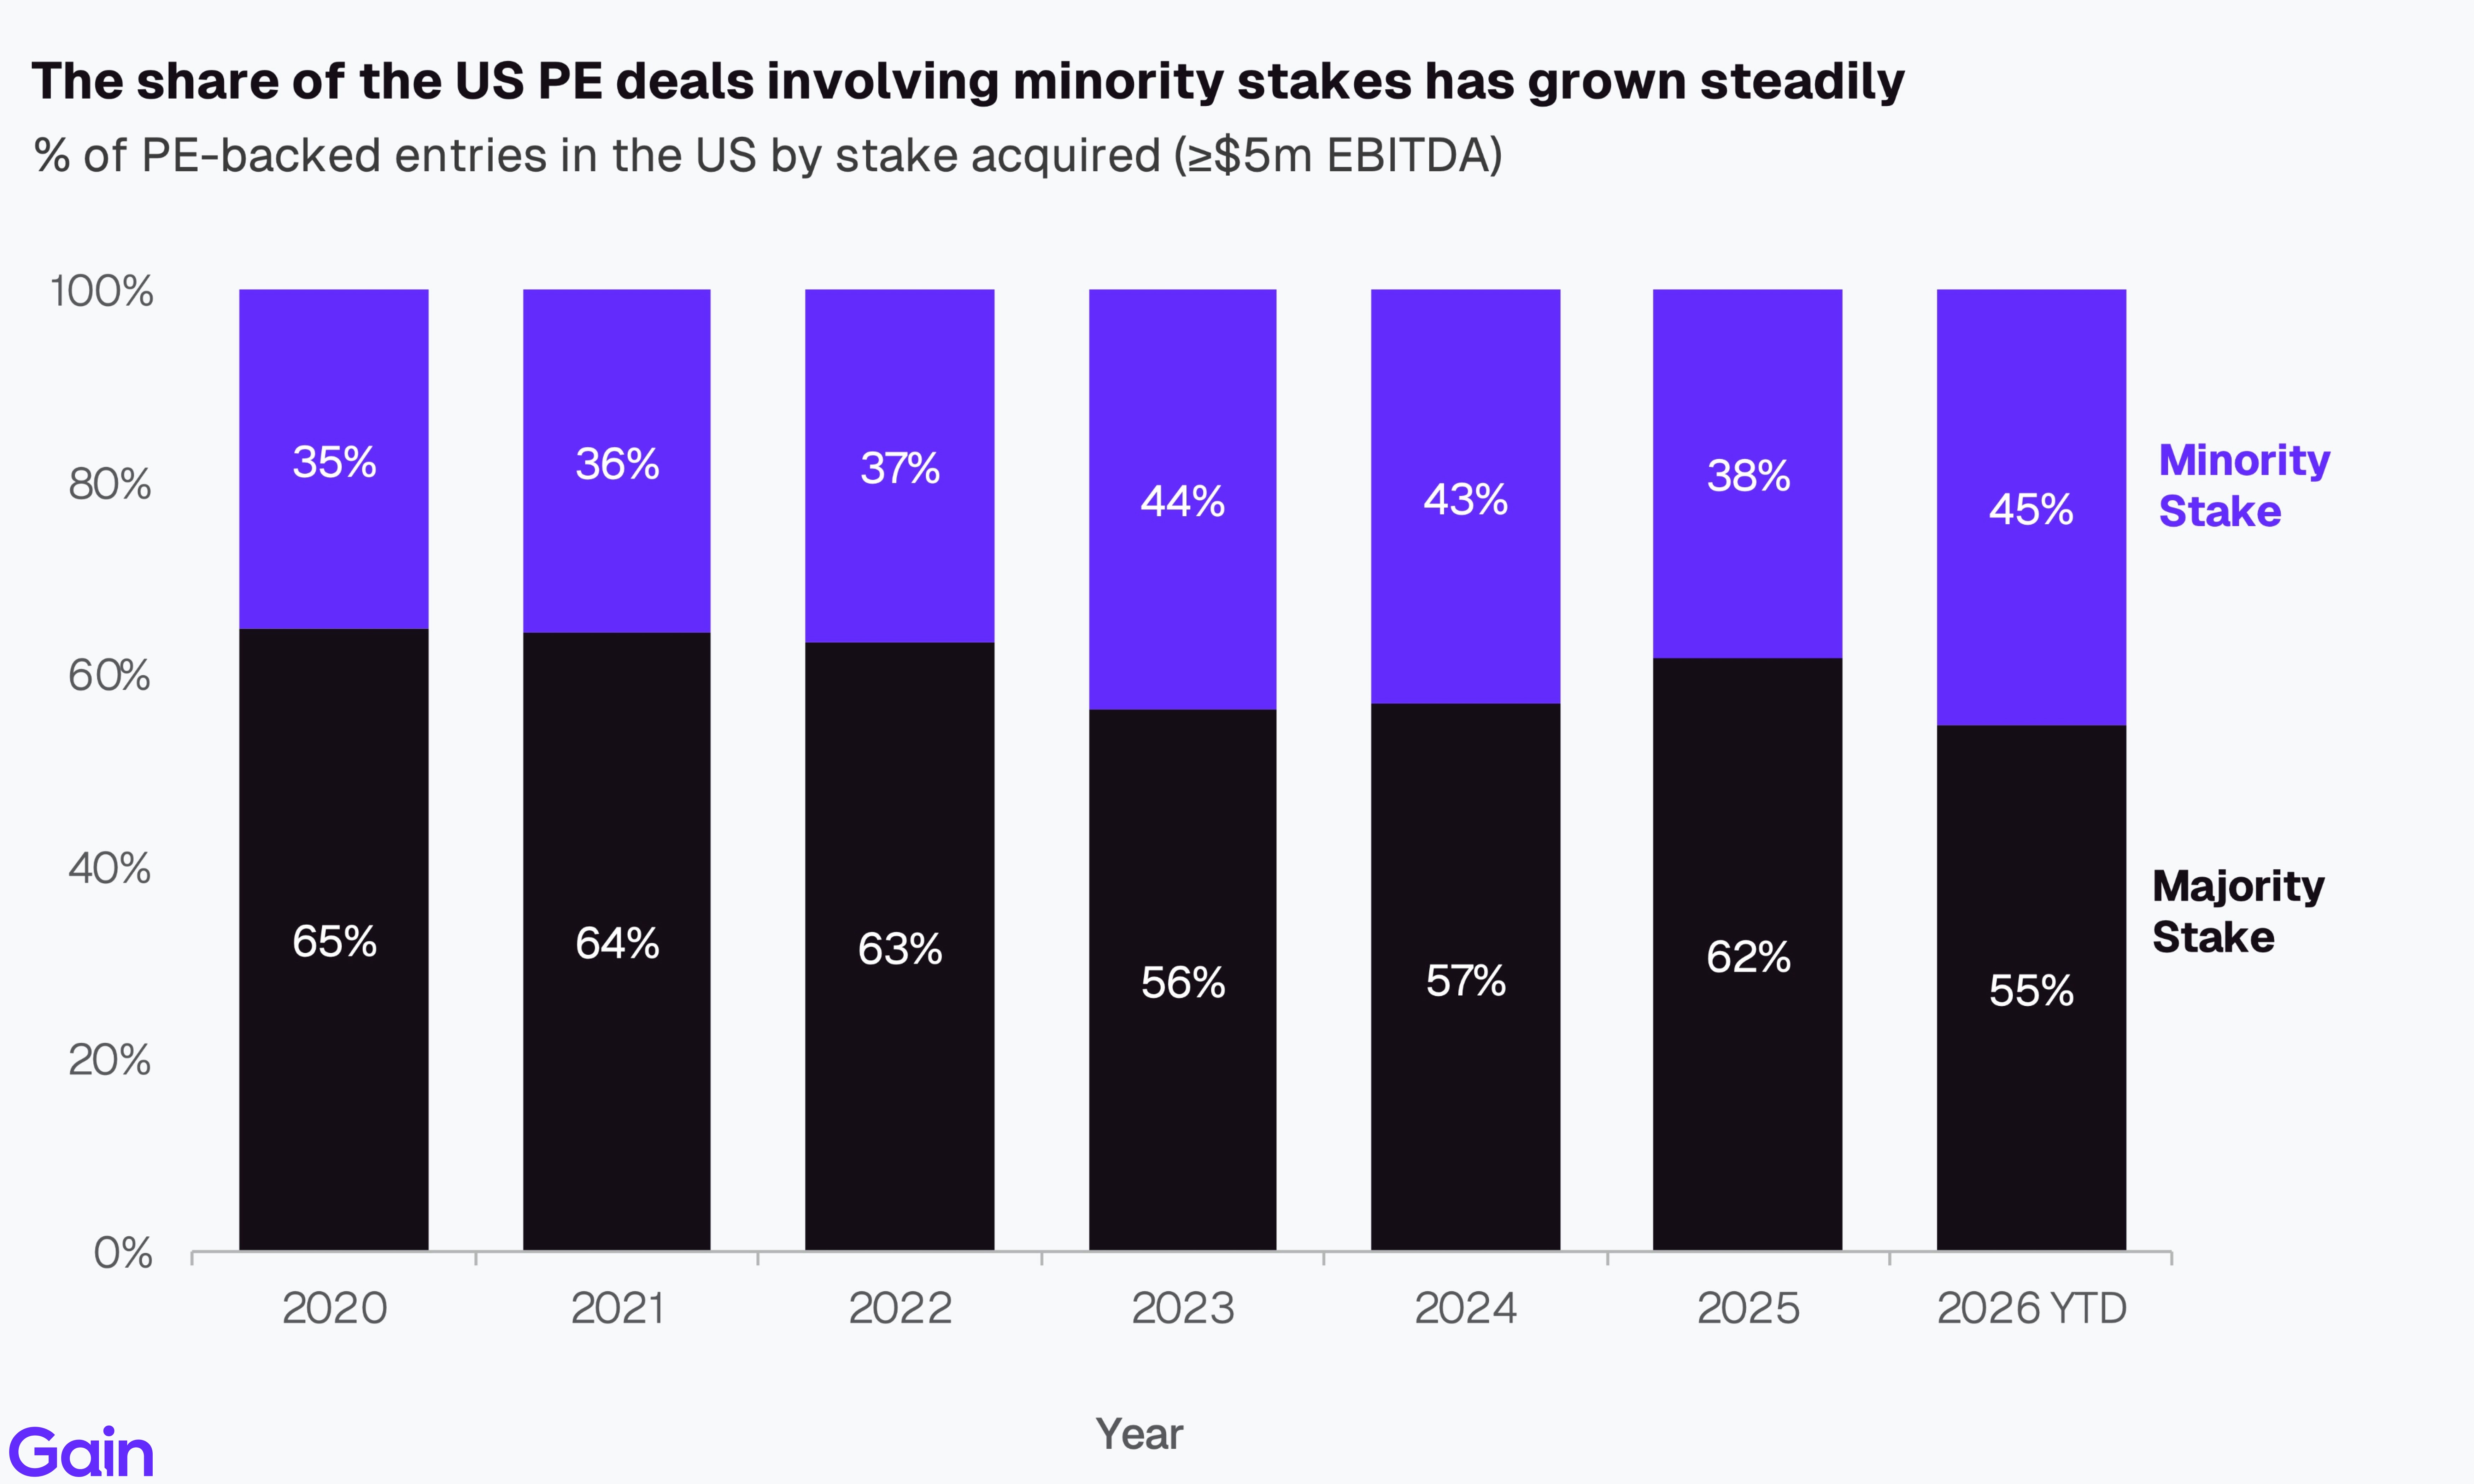
The share of US PE deals involving minority stakes has grown steadily, rising from 35% in 2020 to 45% in 2026 YTD. LPs, sovereign wealth funds, family offices, and other non-traditional investors are co-investing more frequently alongside their GPs, often taking minority positions directly in portfolio companies. Additionally, the growing share of growth equity investments, where minority stakes are the norm, is also contributing to this trend.
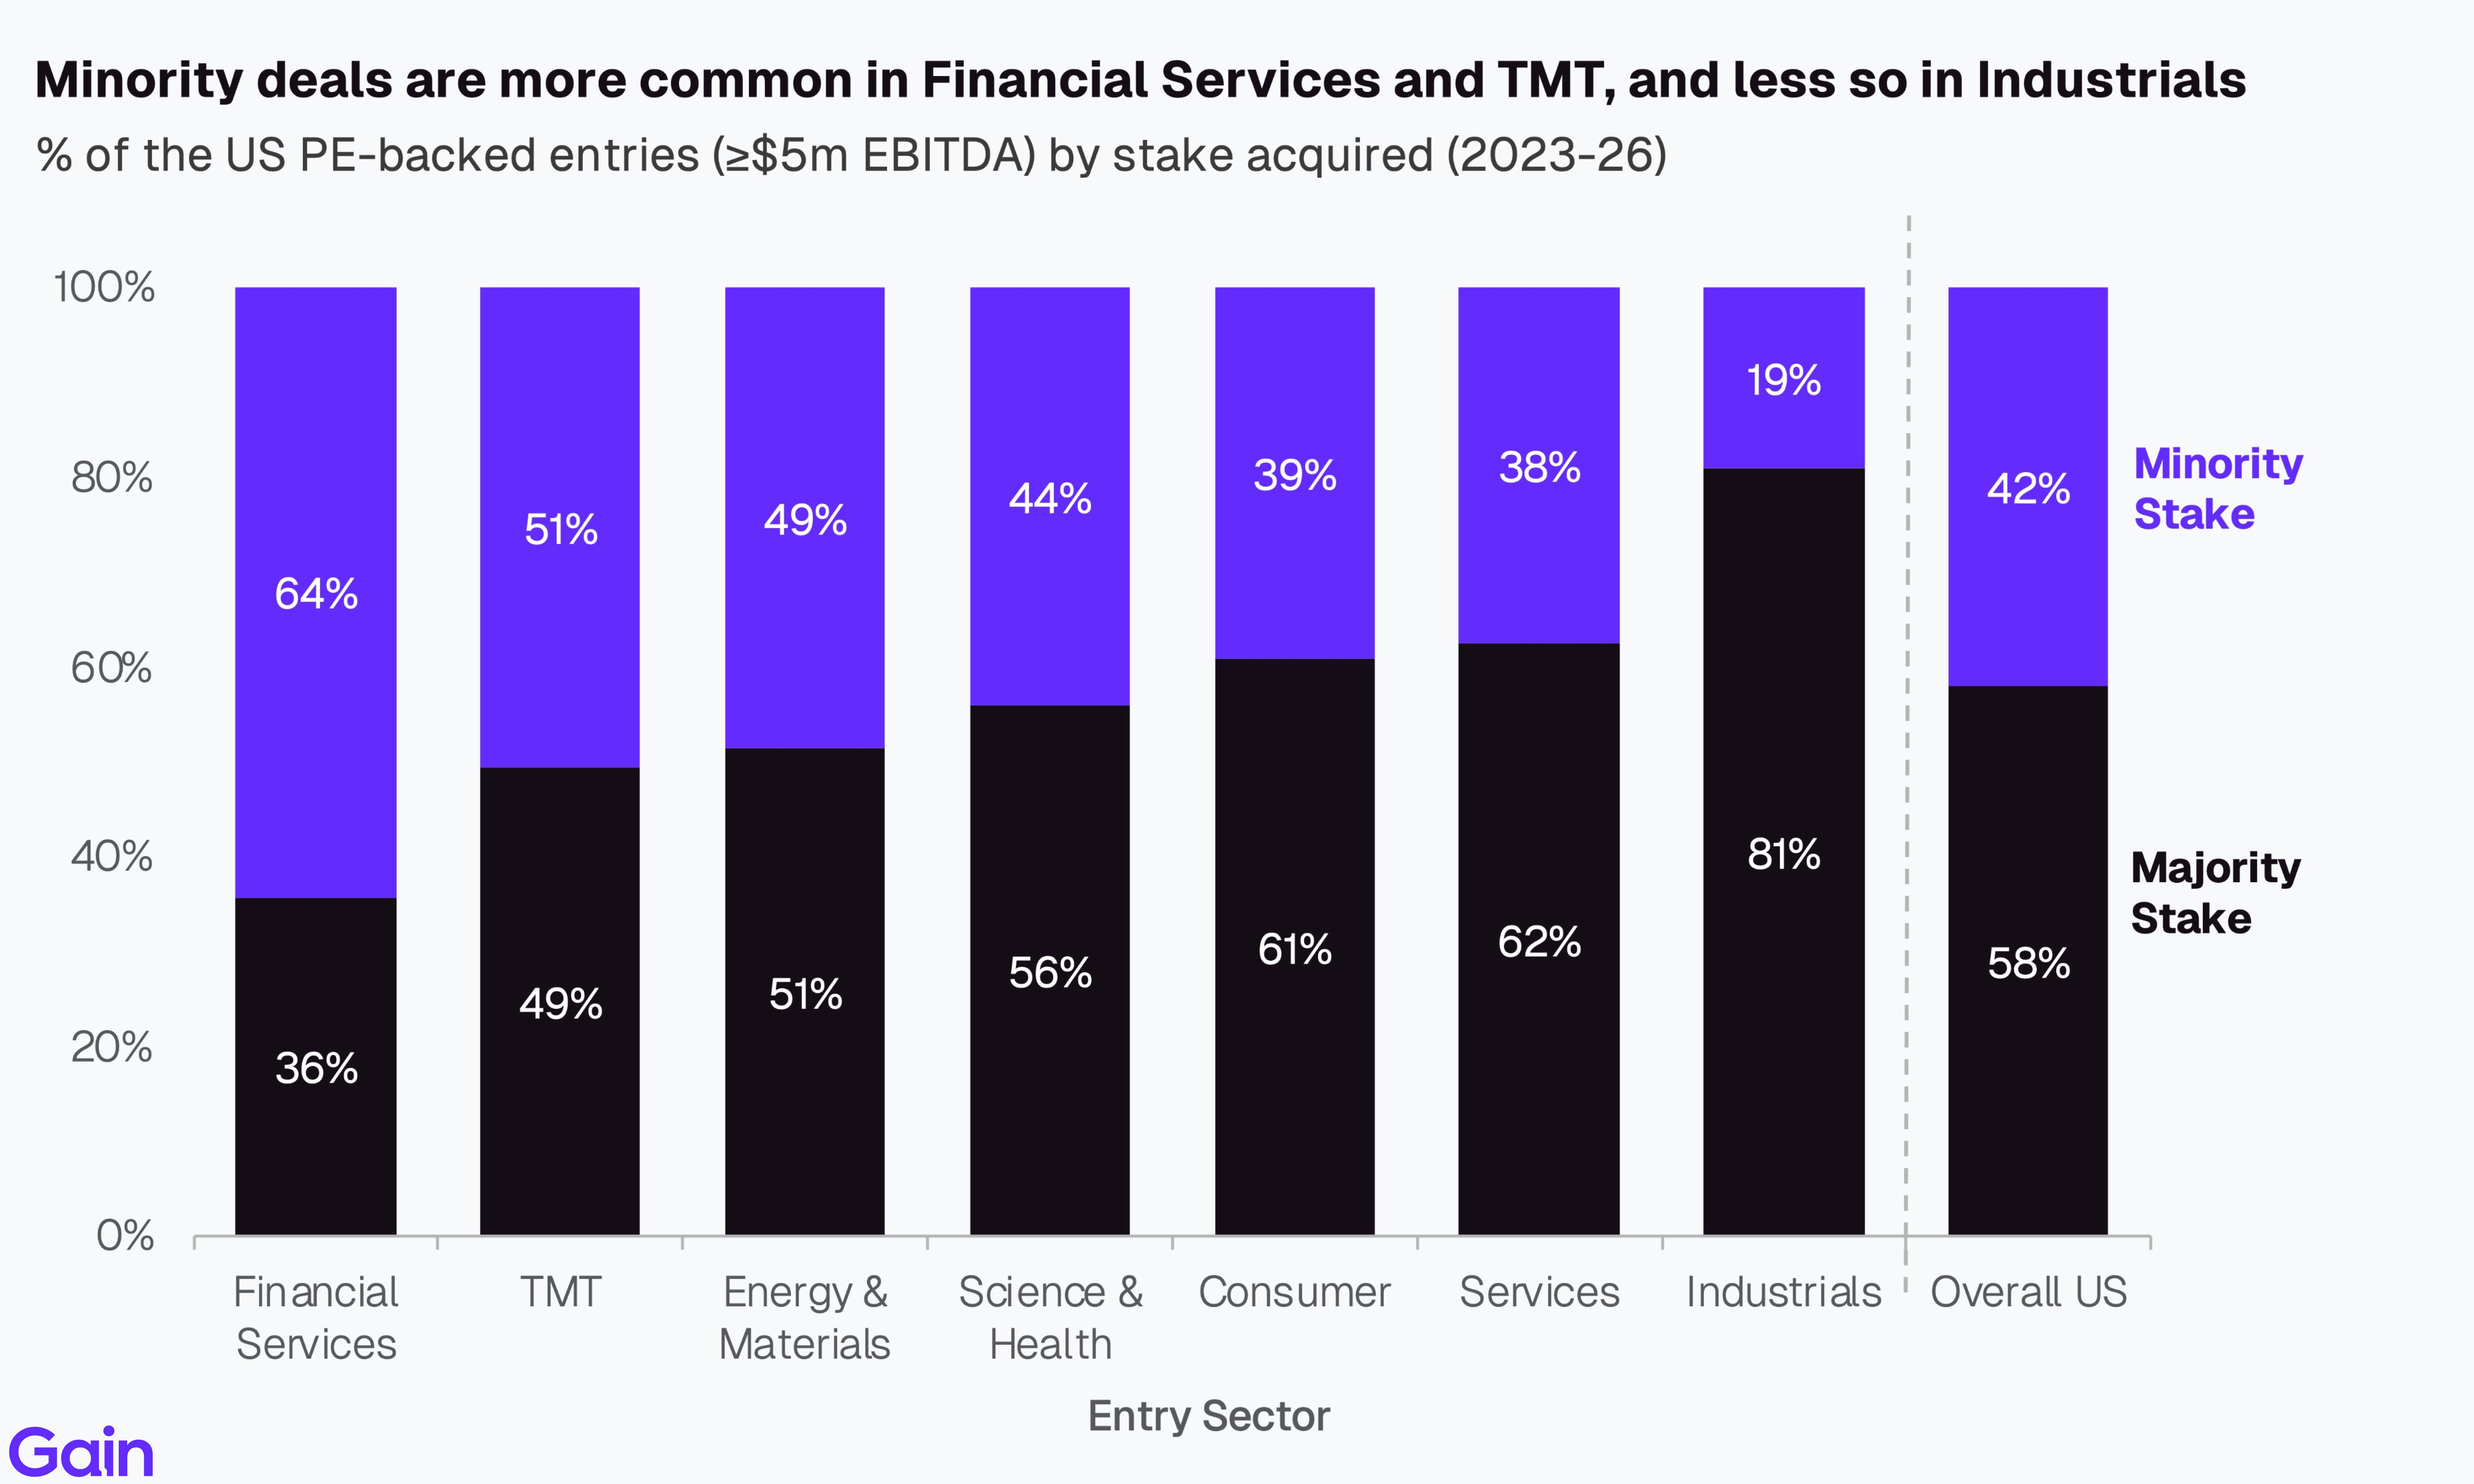
Minority deals are most common in Financial Services (64%) and TMT (51%). In Financial Services, this reflects regulatory constraints, capital intensity, and the presence of partnership-based firms where minority stakes allow PE to invest without triggering regulatory hurdles or disrupting existing structures. In TMT, the high share reflects the preference for growth equity investments in fast-scaling tech businesses. In contrast, Industrials (81%) have the highest share of majority stake acquisitions, where full buyouts remain the preferred structure.
Chapter 02: Exits
Overall Trend
US PE exits gained momentum in the last two years, with the exit count rising 12% in 2025 compared to 2024. Despite a challenging macro environment, improving debt markets and mounting LP pressure to return capital brought a backlog of delayed exits to market. Early 2026 activity is off to a good start, but the outlook is clouded by current macro and geopolitical uncertainties.

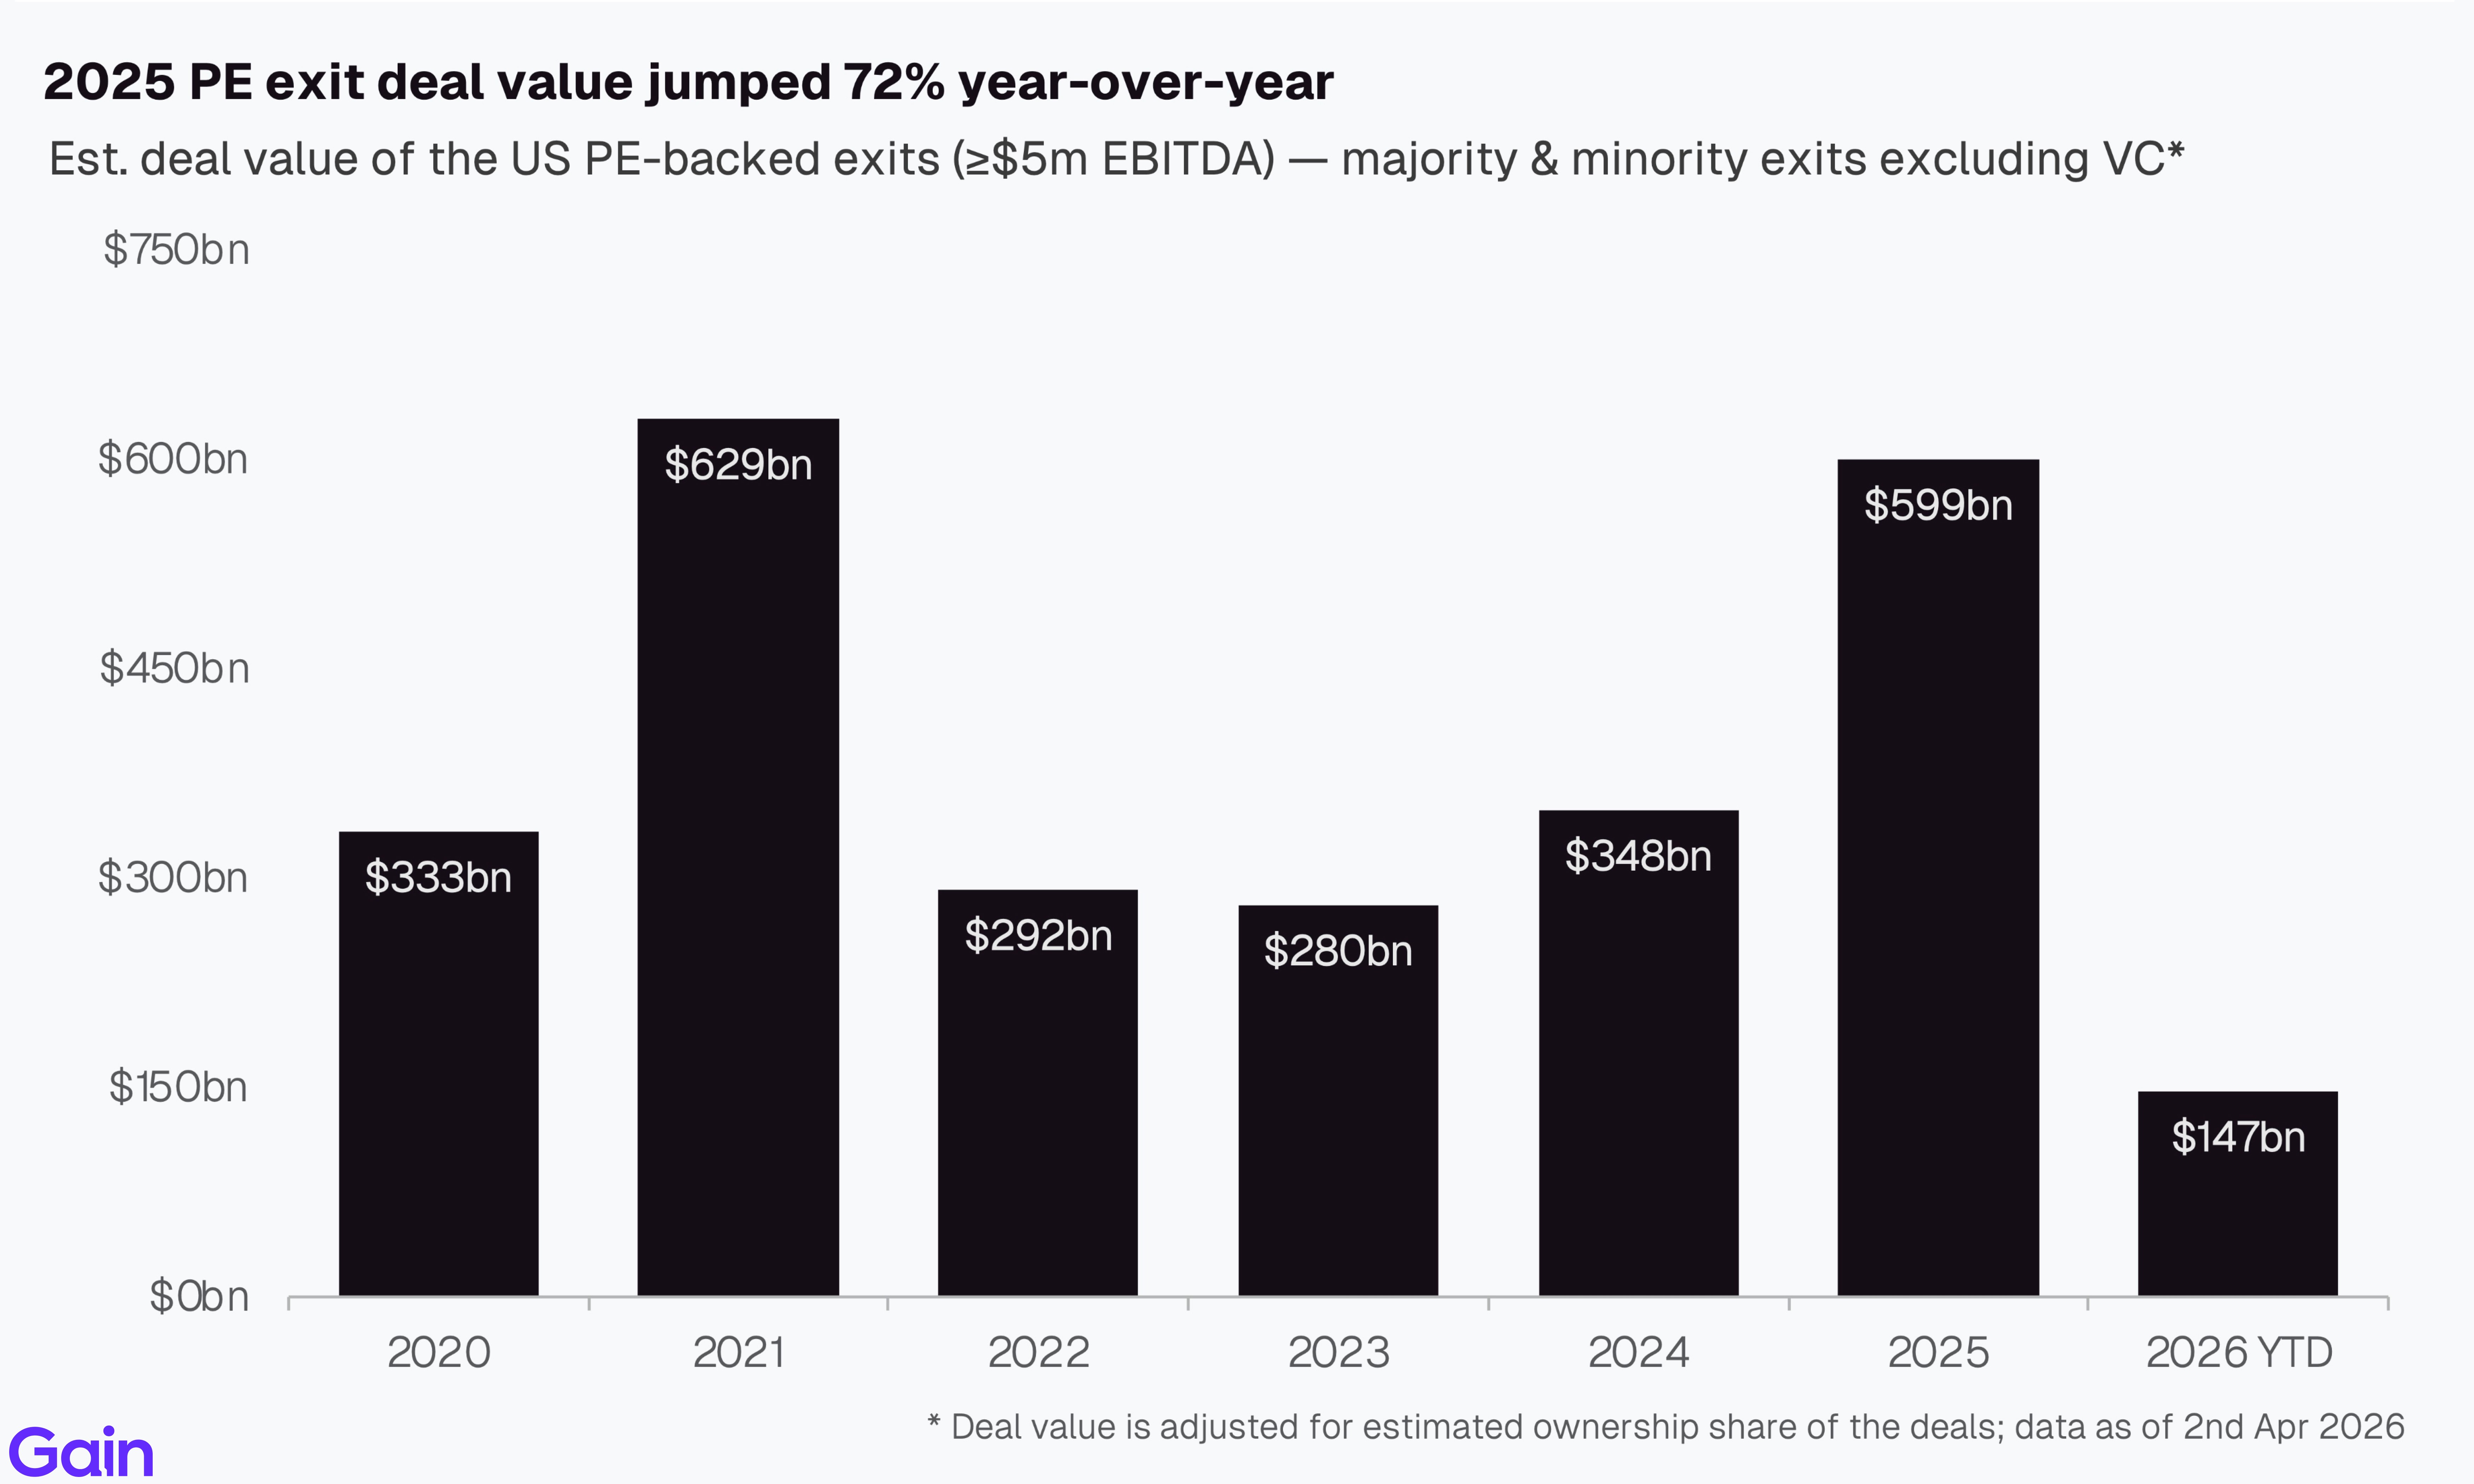
While deal count increased only modestly, 2025 PE exit deal value jumped 72% year-over-year. At $599bn, it is within 5% of the 2021 peak. The recovery reflects a shift toward larger exits, with IPO markets also reopening.
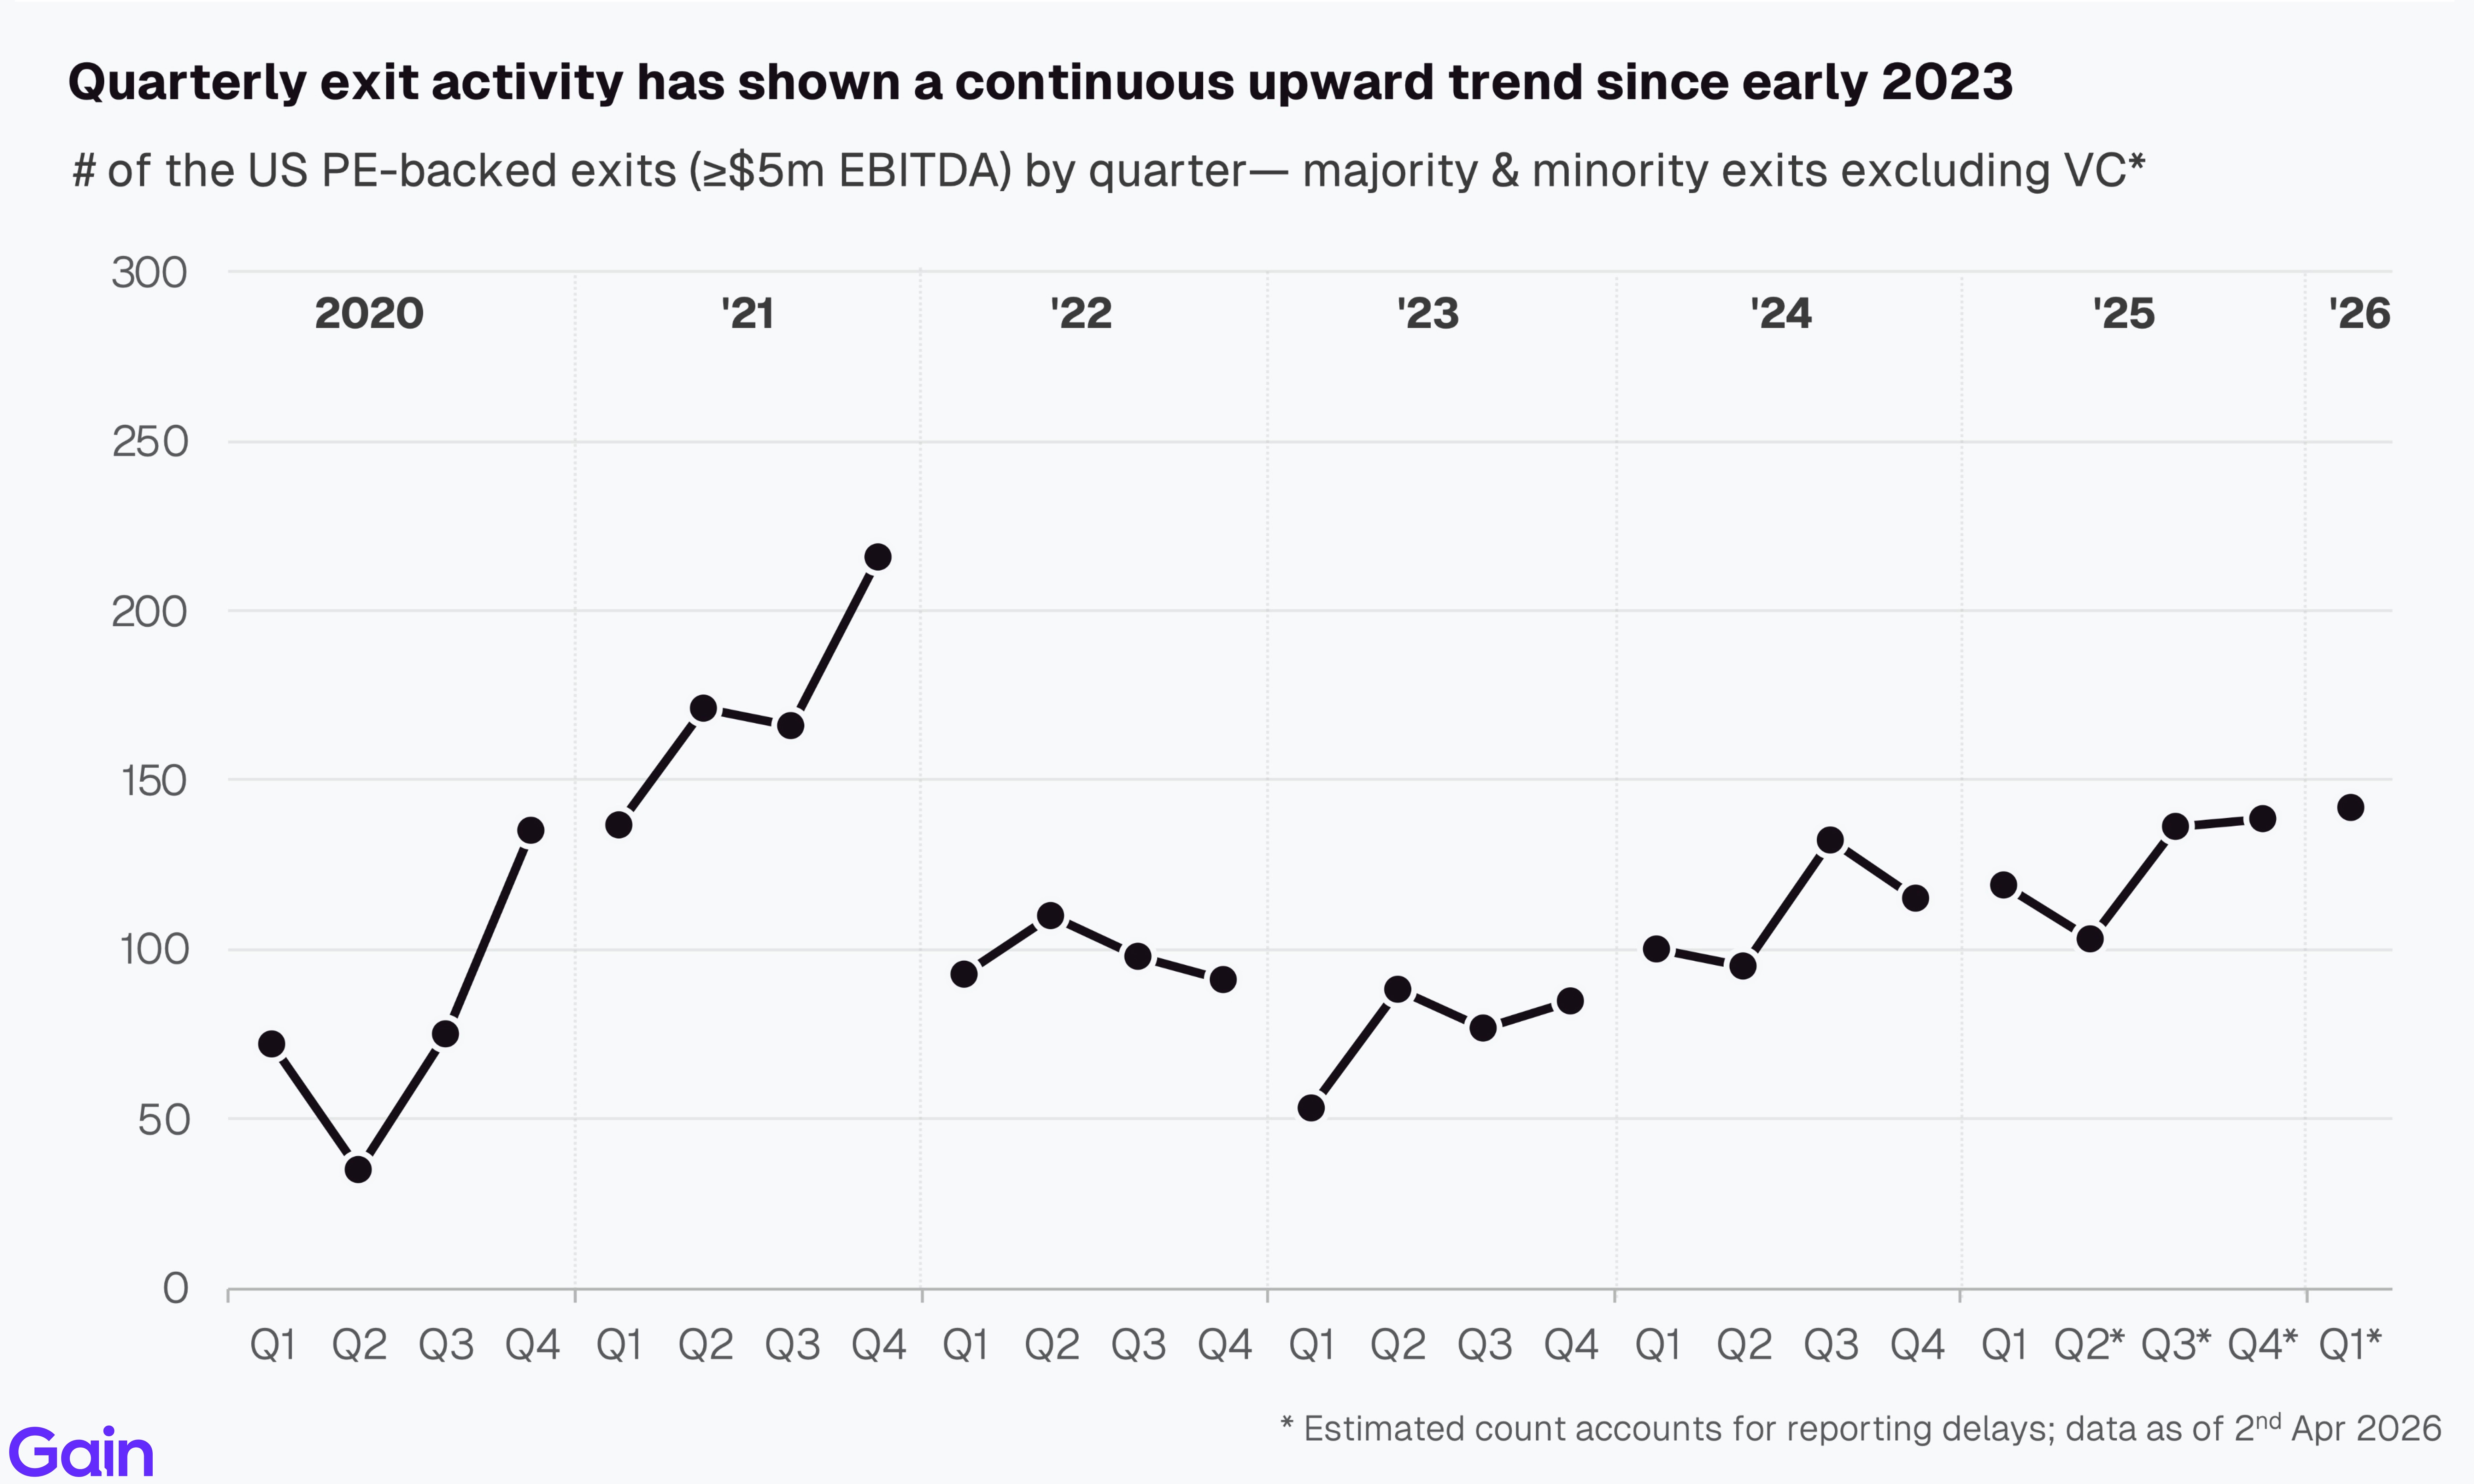
Quarterly exit activity has shown a continuous upward trend since early 2023, with momentum carrying into early 2026. Despite this recovery, exit volumes remain modest relative to the large backlog of unsold assets.
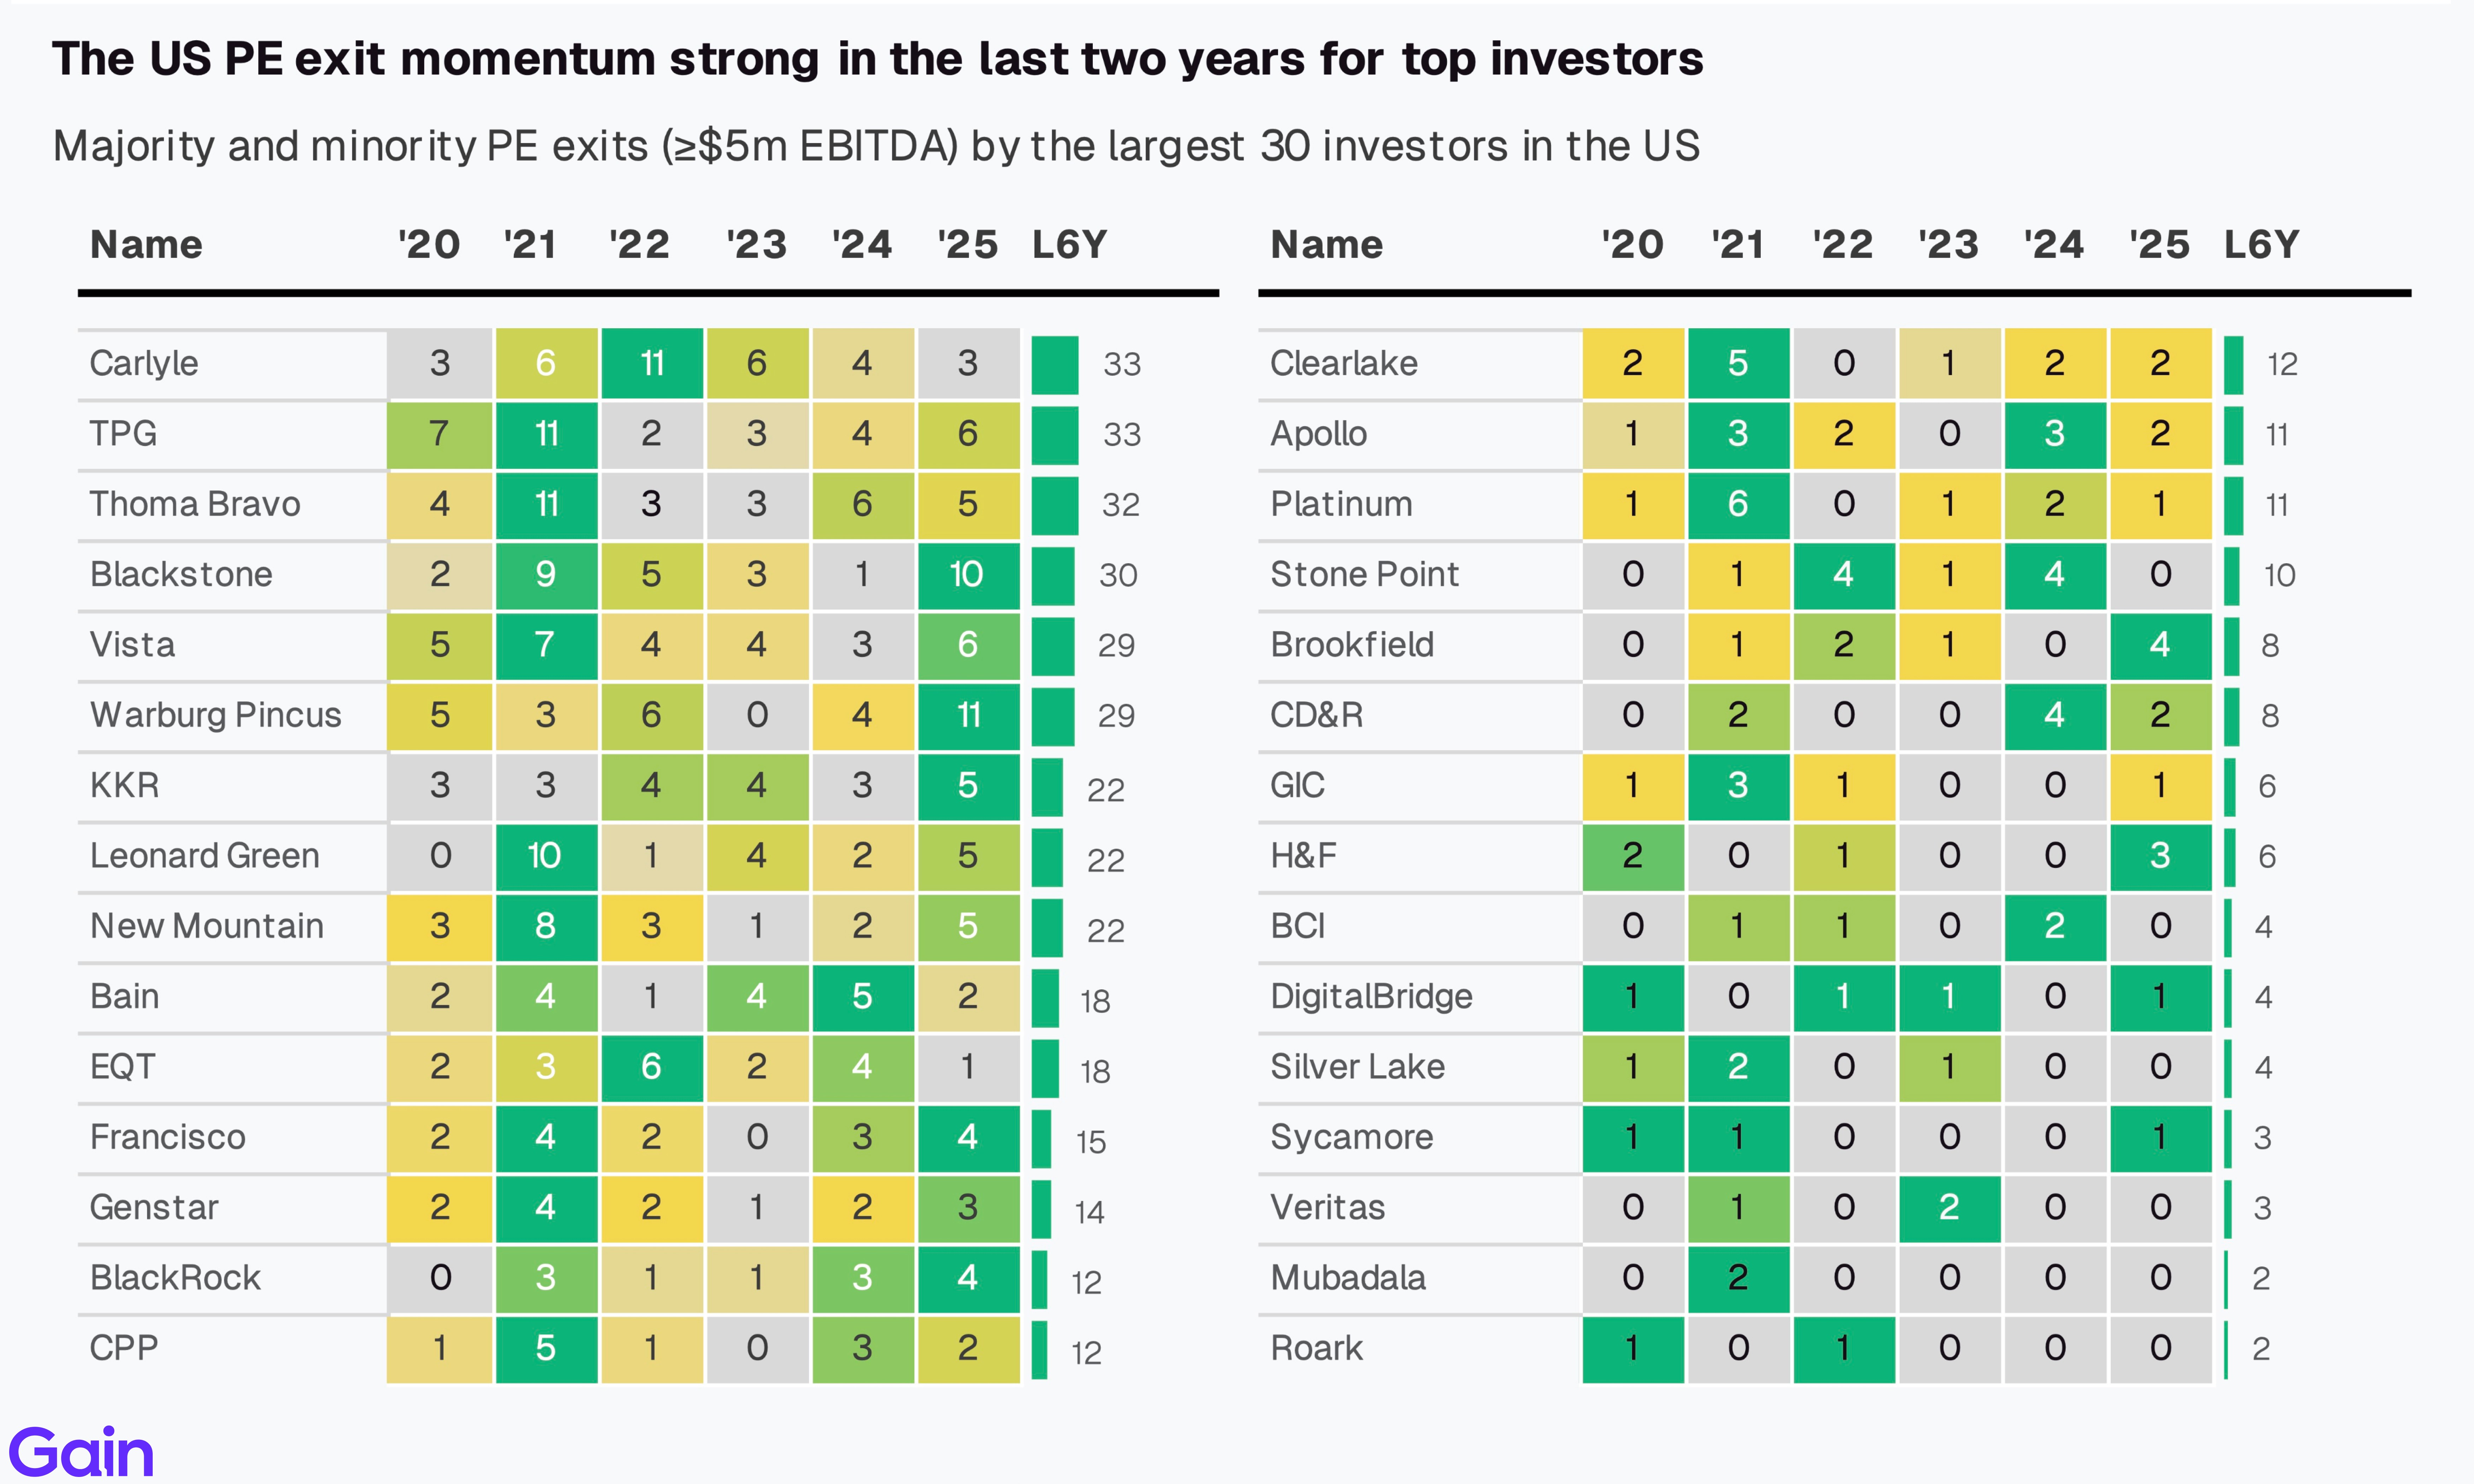
PE exits among the largest 30 investors also point to a recovery. Most firms recorded higher counts in 2025 than in the prior two years but are still somewhat shy of the 2021 levels.
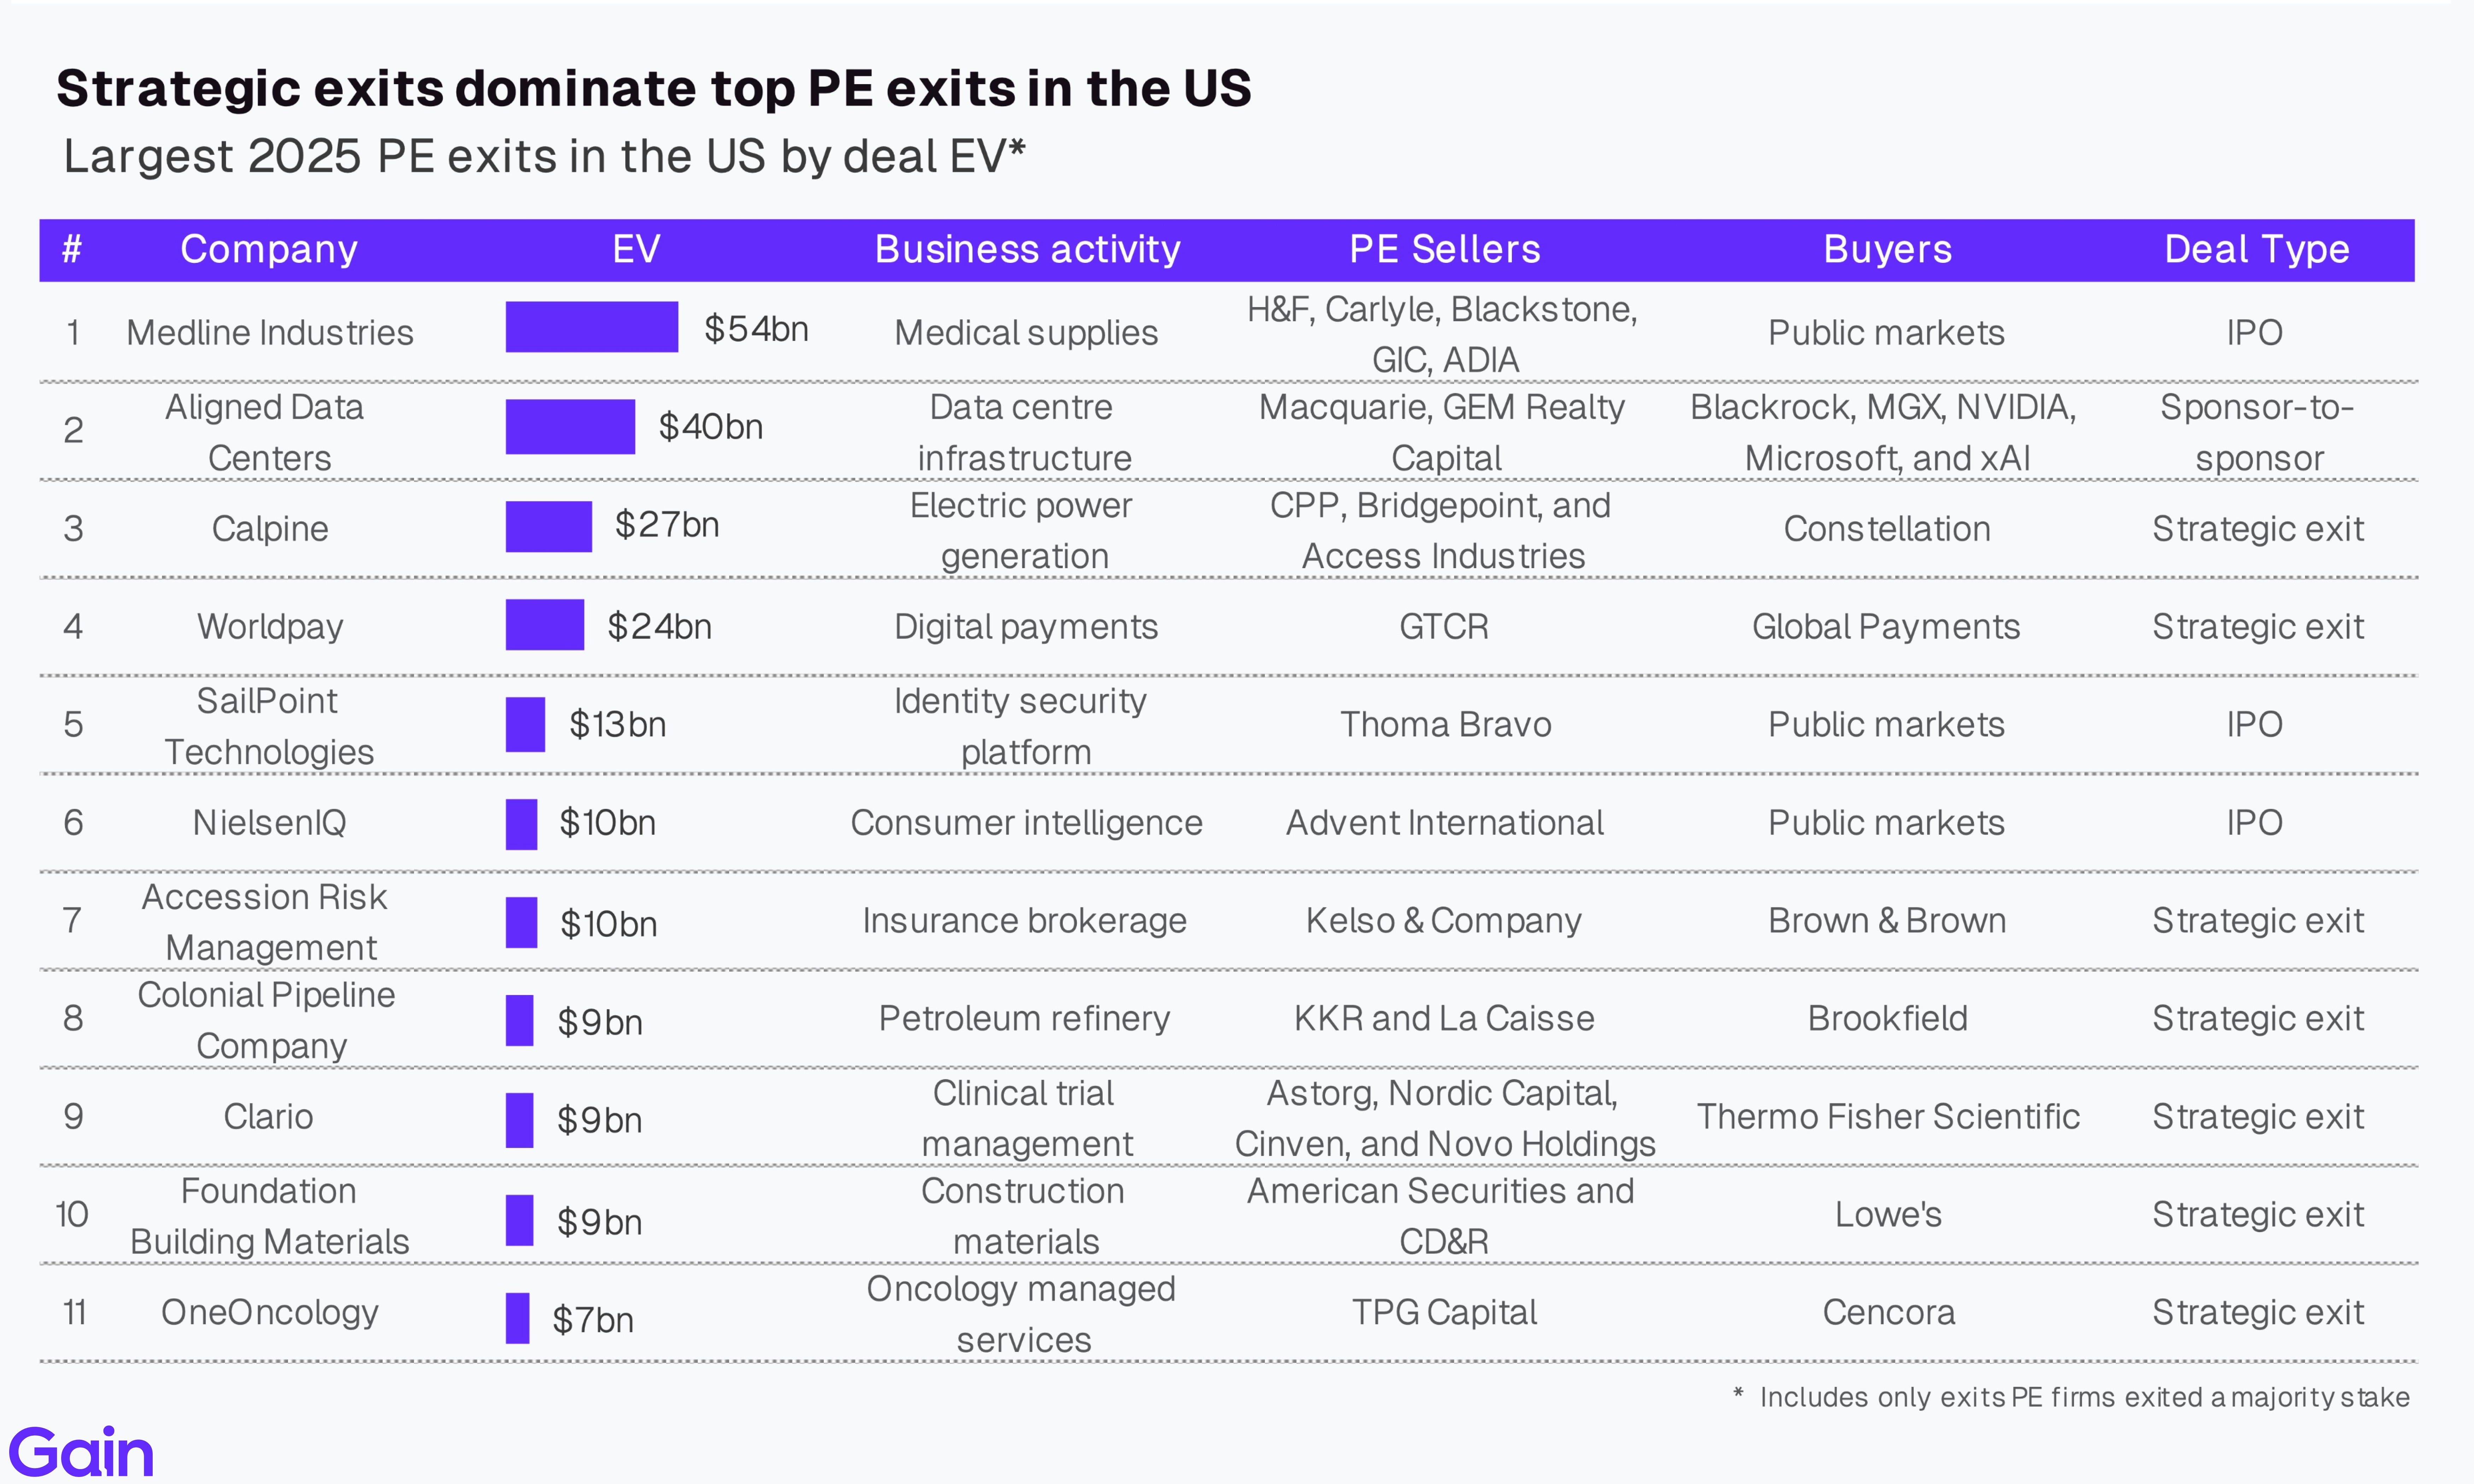
Strategic exits represented 7 of the top 11 largest exits last year, IPOs accounted for 3, while 1 was sponsor-to-sponsor. Overall, Medline Industries ($54bn) was the largest exit of 2025, followed by Aligned Data Centers ($40bn) and Calpine ($27bn). IPO markets showed meaningful improvement compared to 2023-2024.
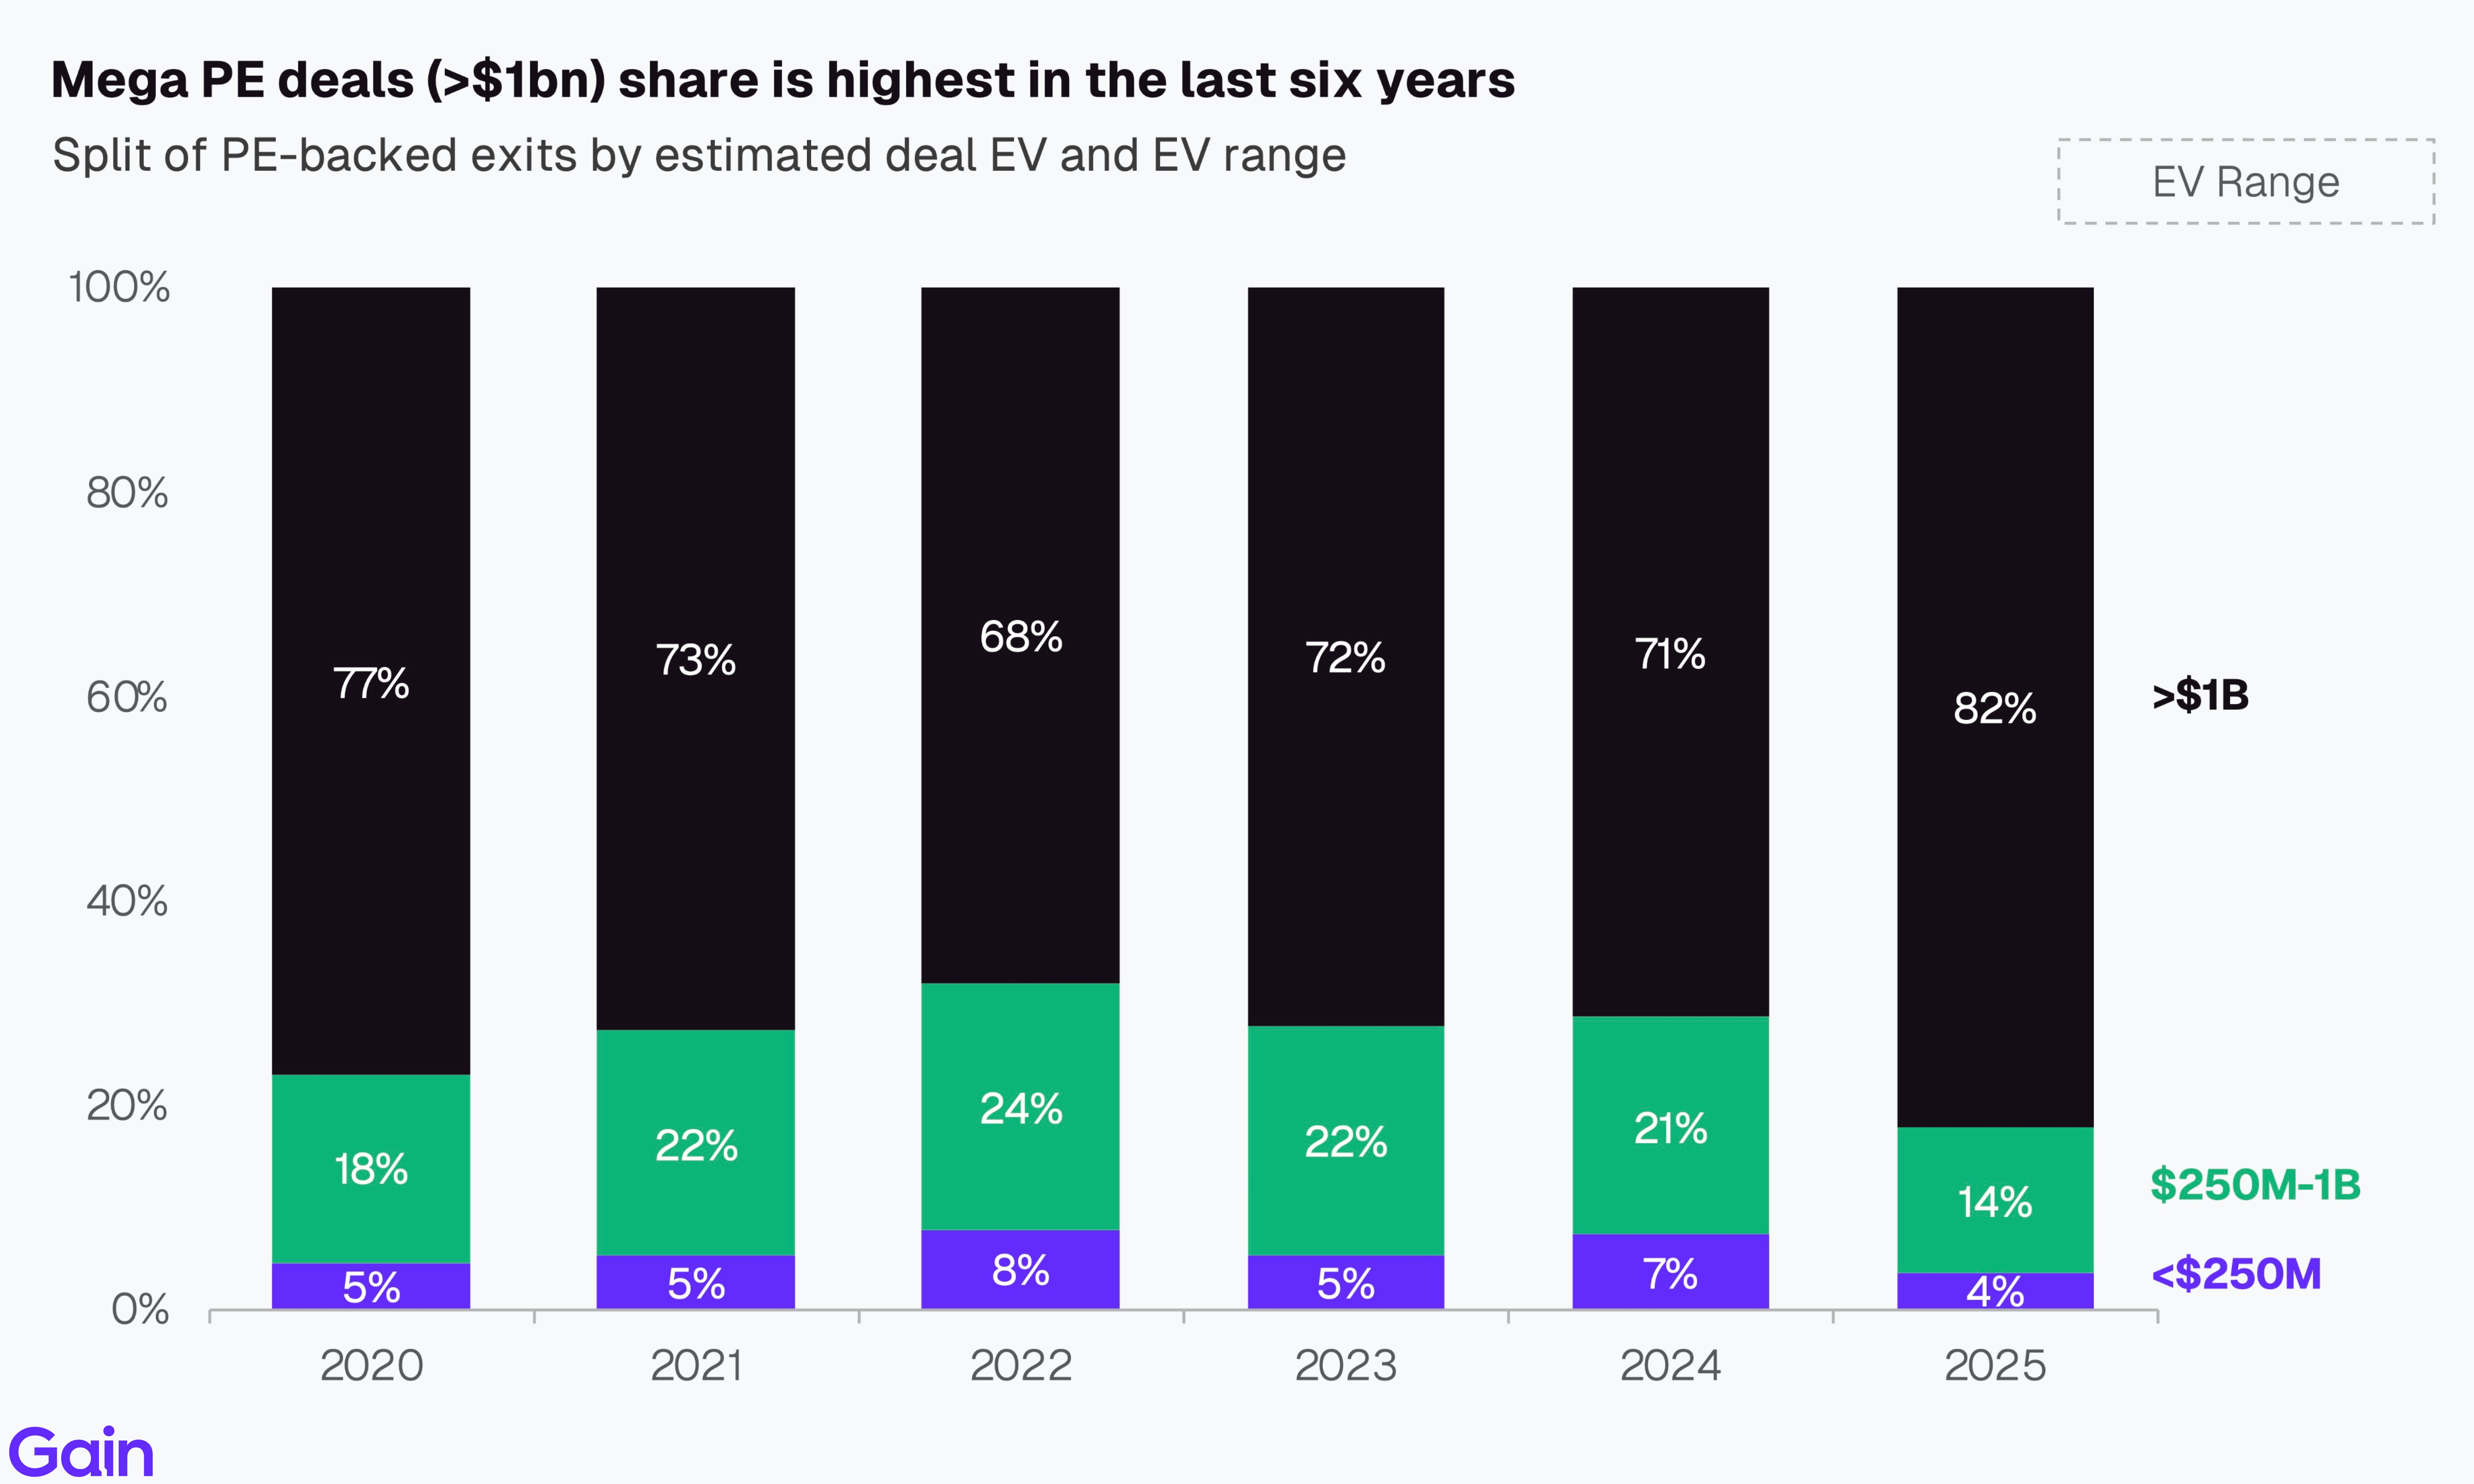
The share of $1bn+ exits has been growing, rising from 71% of all exits by deal value in 2024 to 82% in 2025. In contrast, the share of mid-market exits ($250M to $1B) has declined from 21% to 14%, as sponsors prioritise larger, higher-value realizations.
Holding Periods
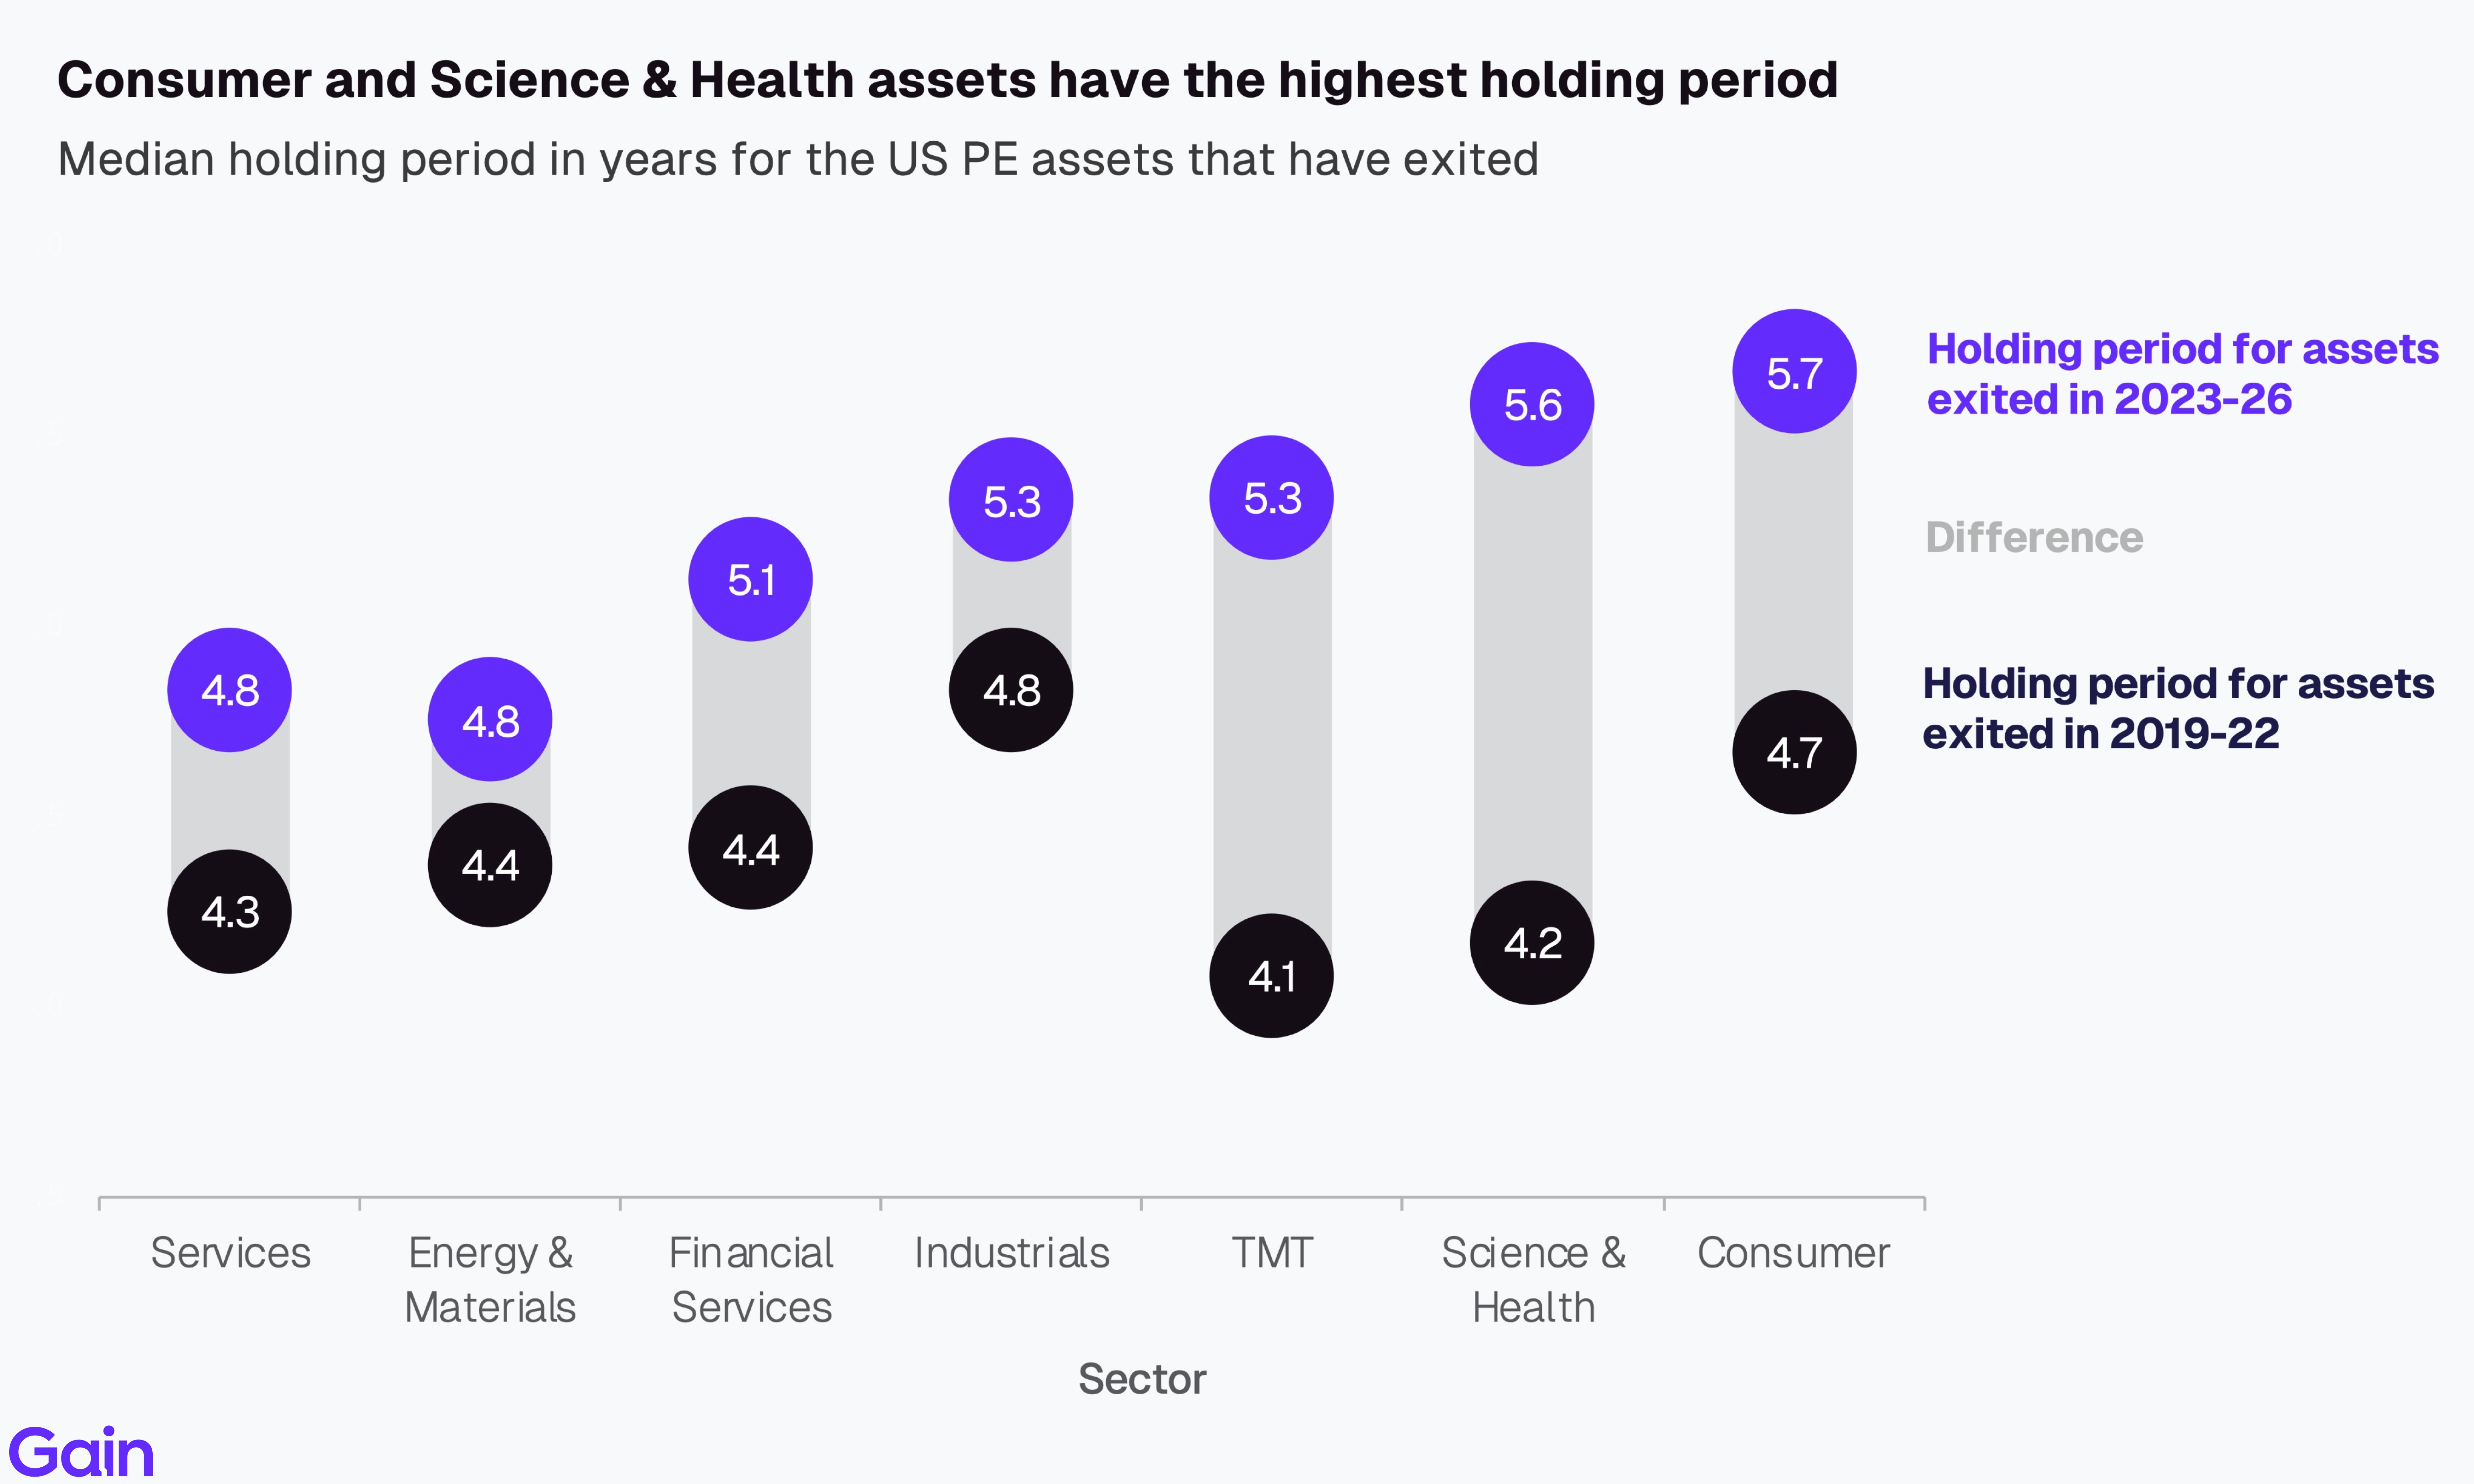
Holding periods for US PE assets rose for the fourth consecutive year. The median company exiting in 2025 spent 5.3 years in the portfolio, up from 5.1 years in 2024 and 4.2 years in 2021. This trend is even more pronounced in Europe, where assets are held for 5.7 years on average, driven by a higher concentration in Industrials and Consumer, sectors where exit timelines are longer.

A third of PE assets stay in the portfolio longer than 7 years, a higher proportion than many GPs and LPs would prefer. Holding periods remain top of mind given their significant impact on performance metrics such as IRR, DPI and, potentially, performance fees.
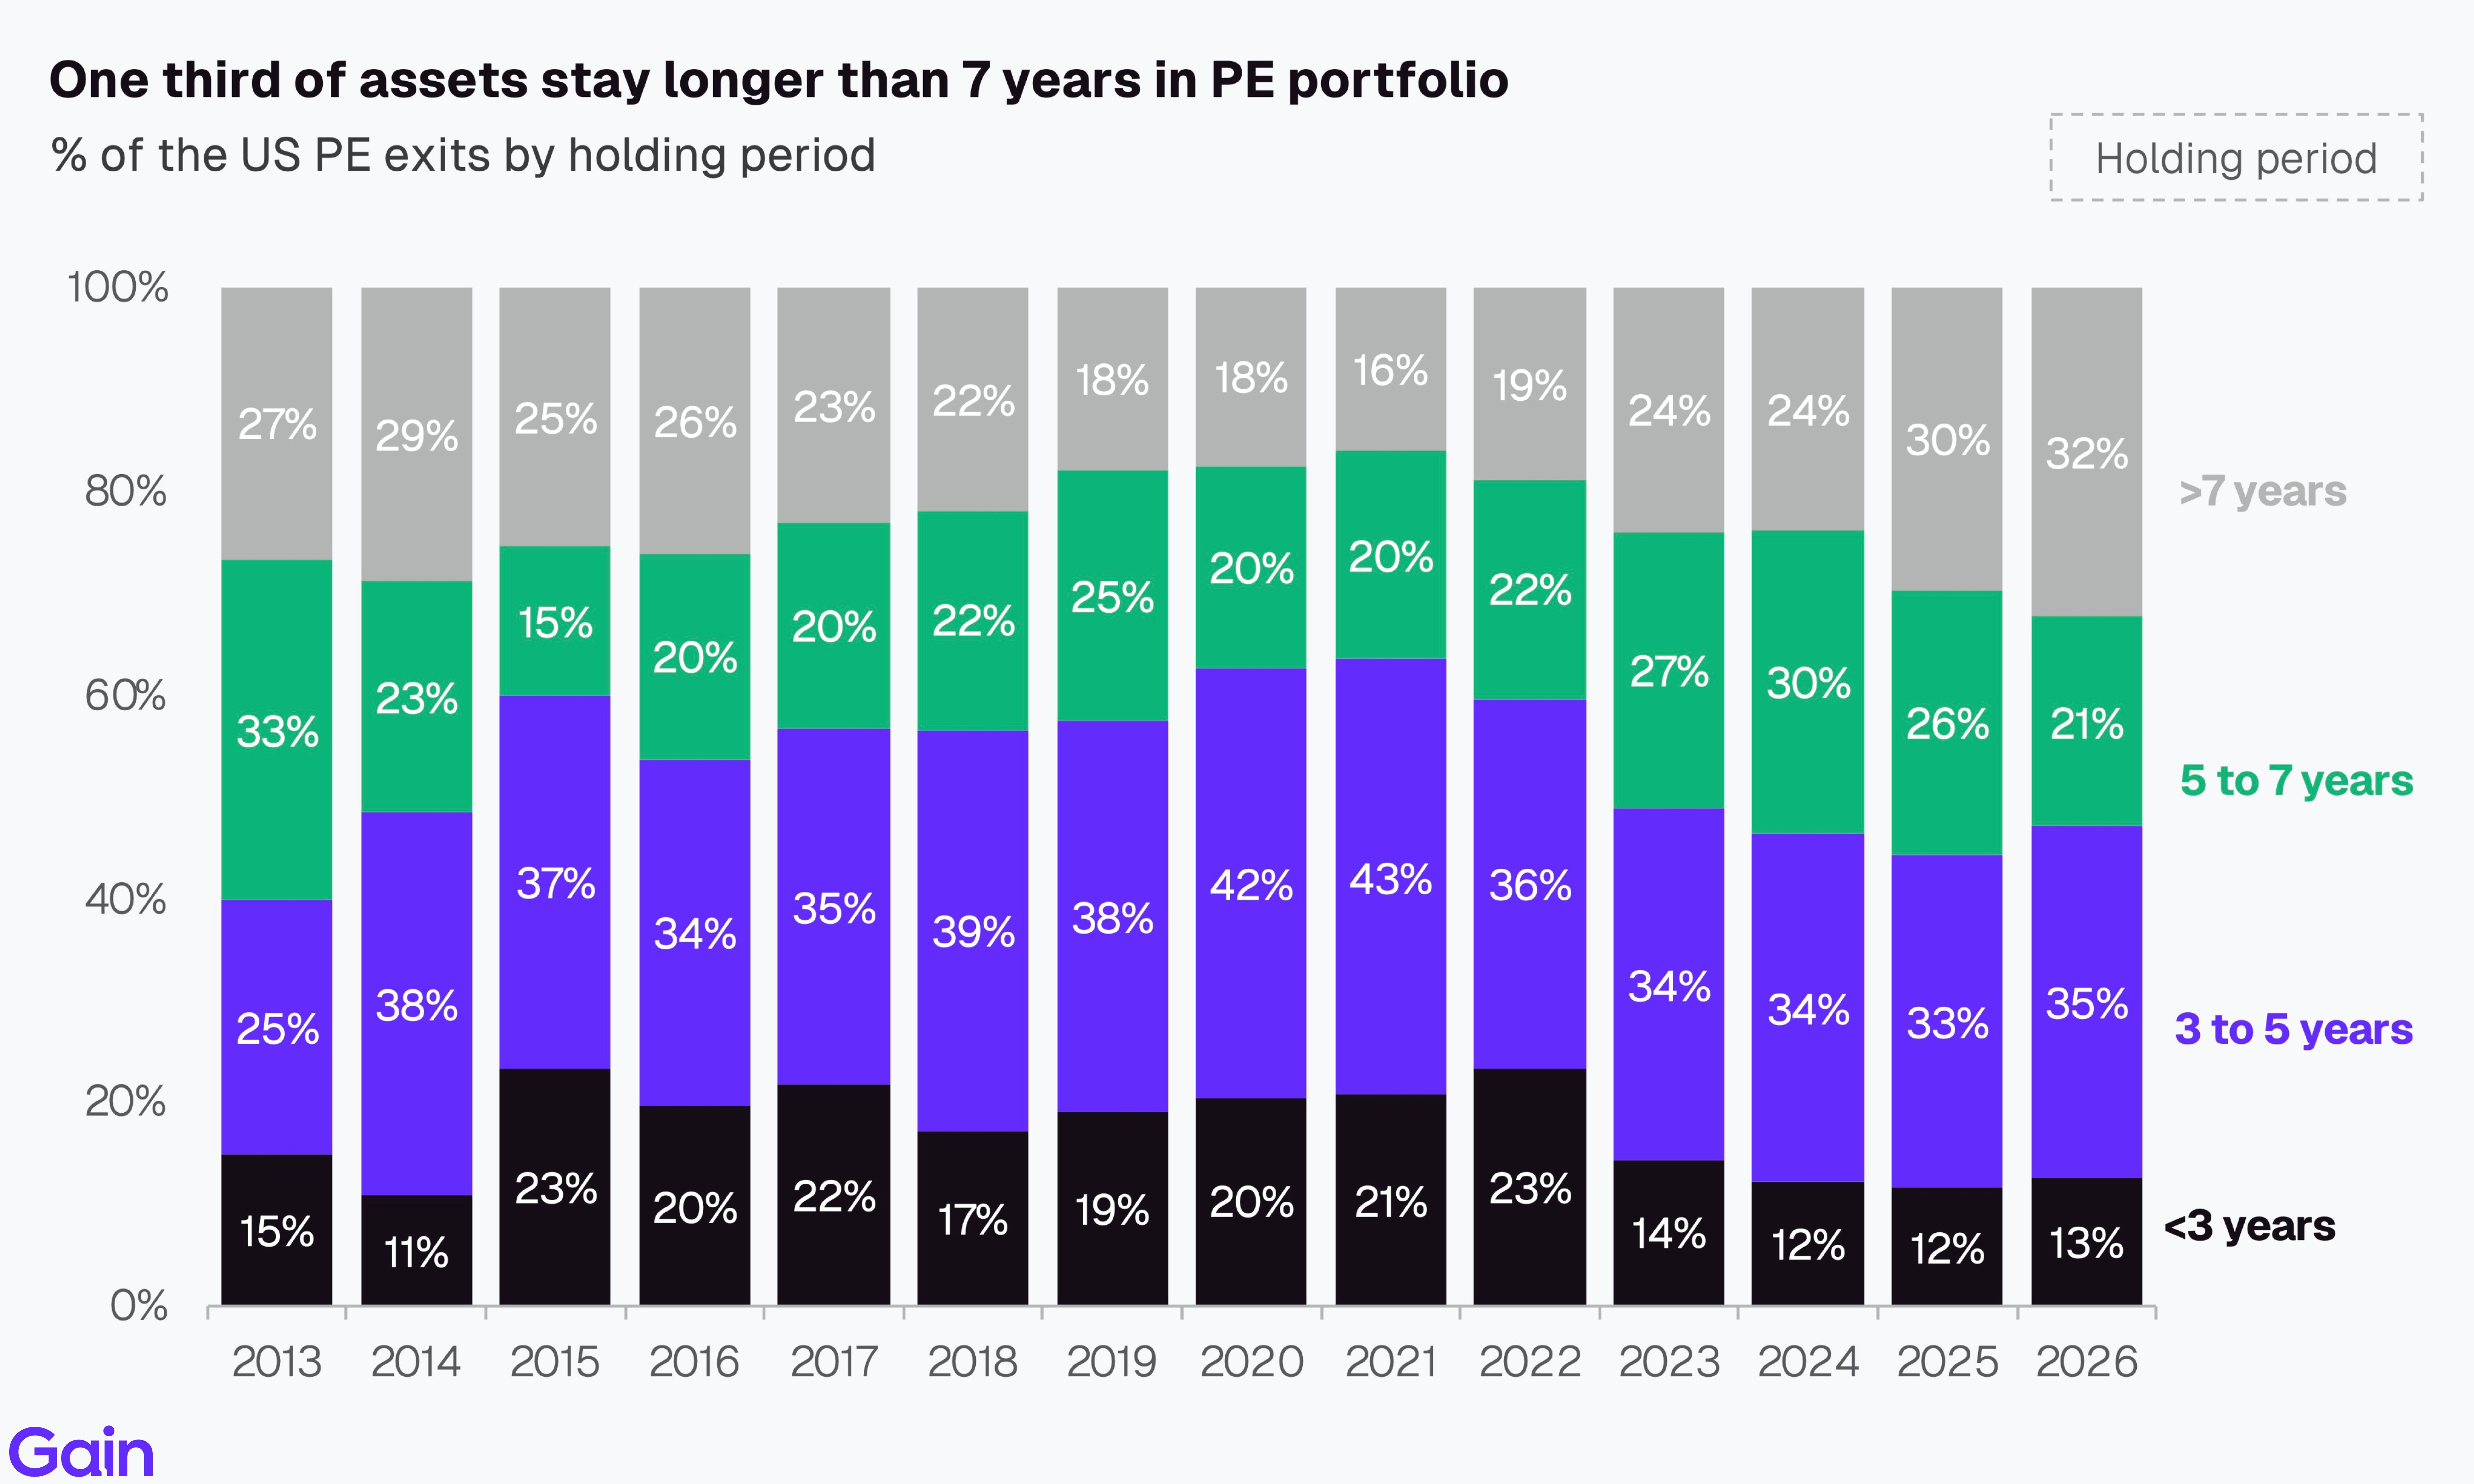
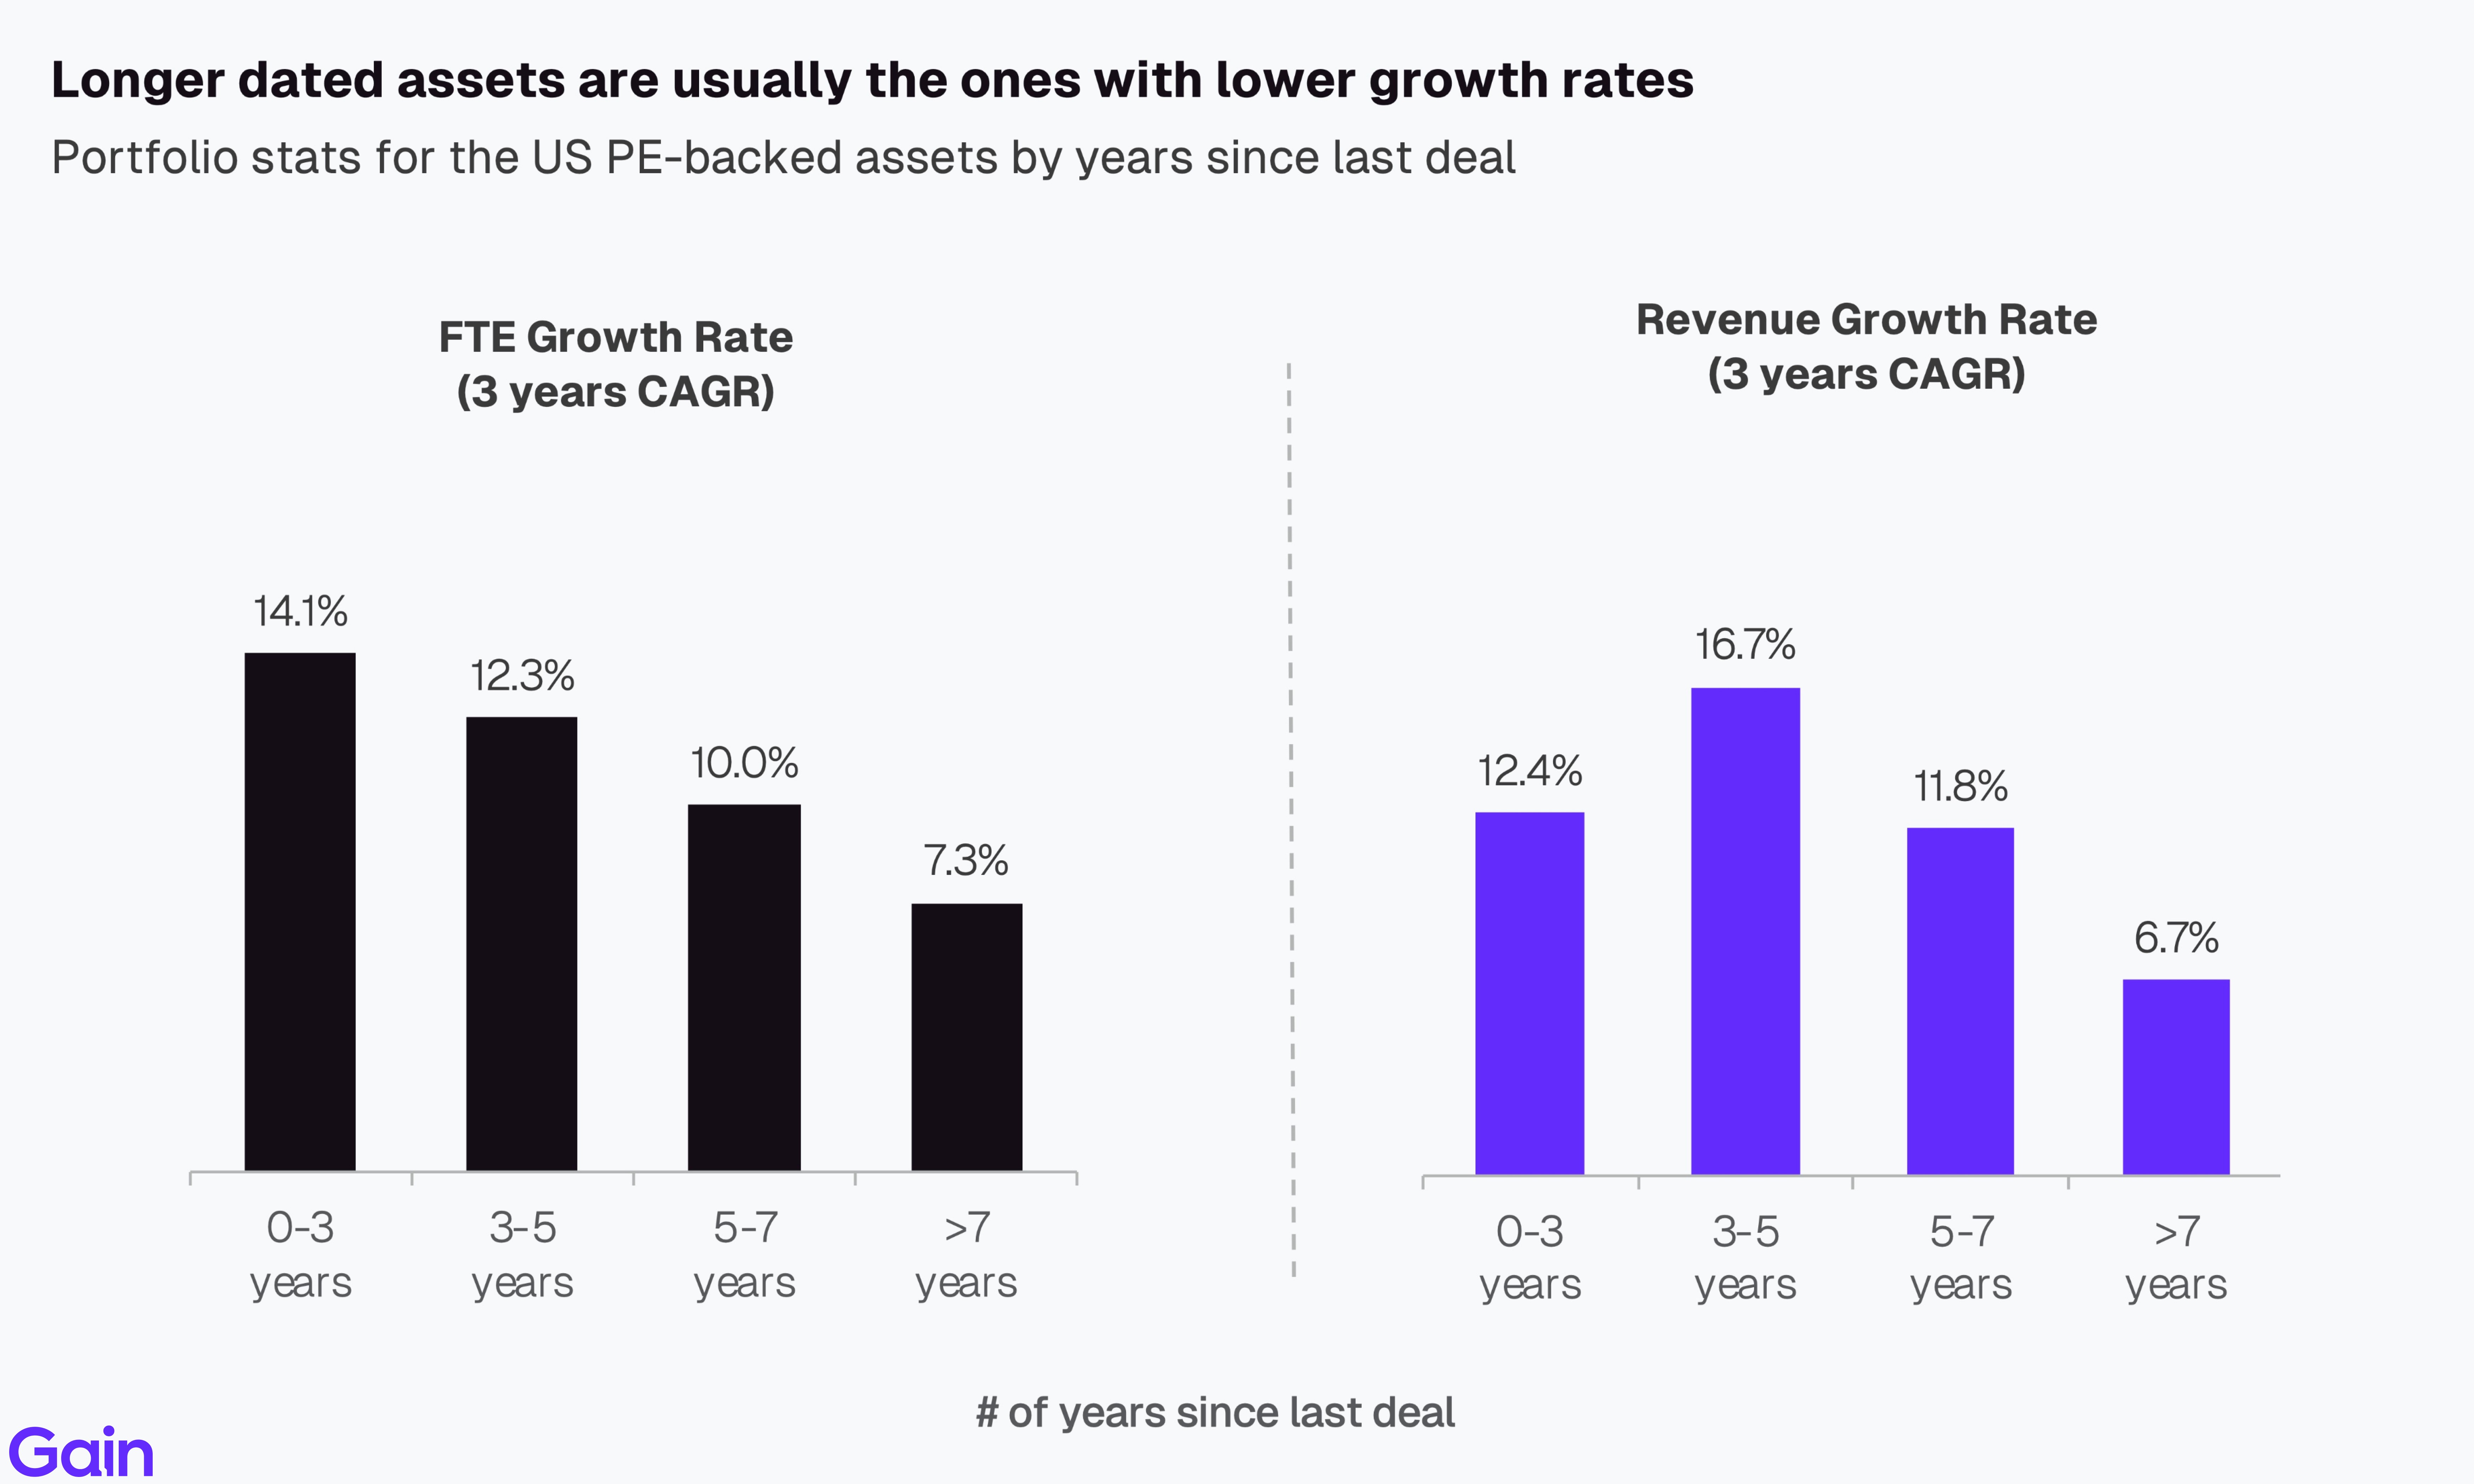
Selling some of those longer-dated assets might pose a challenge. Investors typically prioritize selling their stronger-performing assets first to boost DPI and deliver returns to LPs, meaning the remaining assets are the ones with slower growth rates. Exceptions exist, however, where sponsors choose to retain strong-performing assets for longer by requesting fund extensions or rolling them into continuation vehicles.
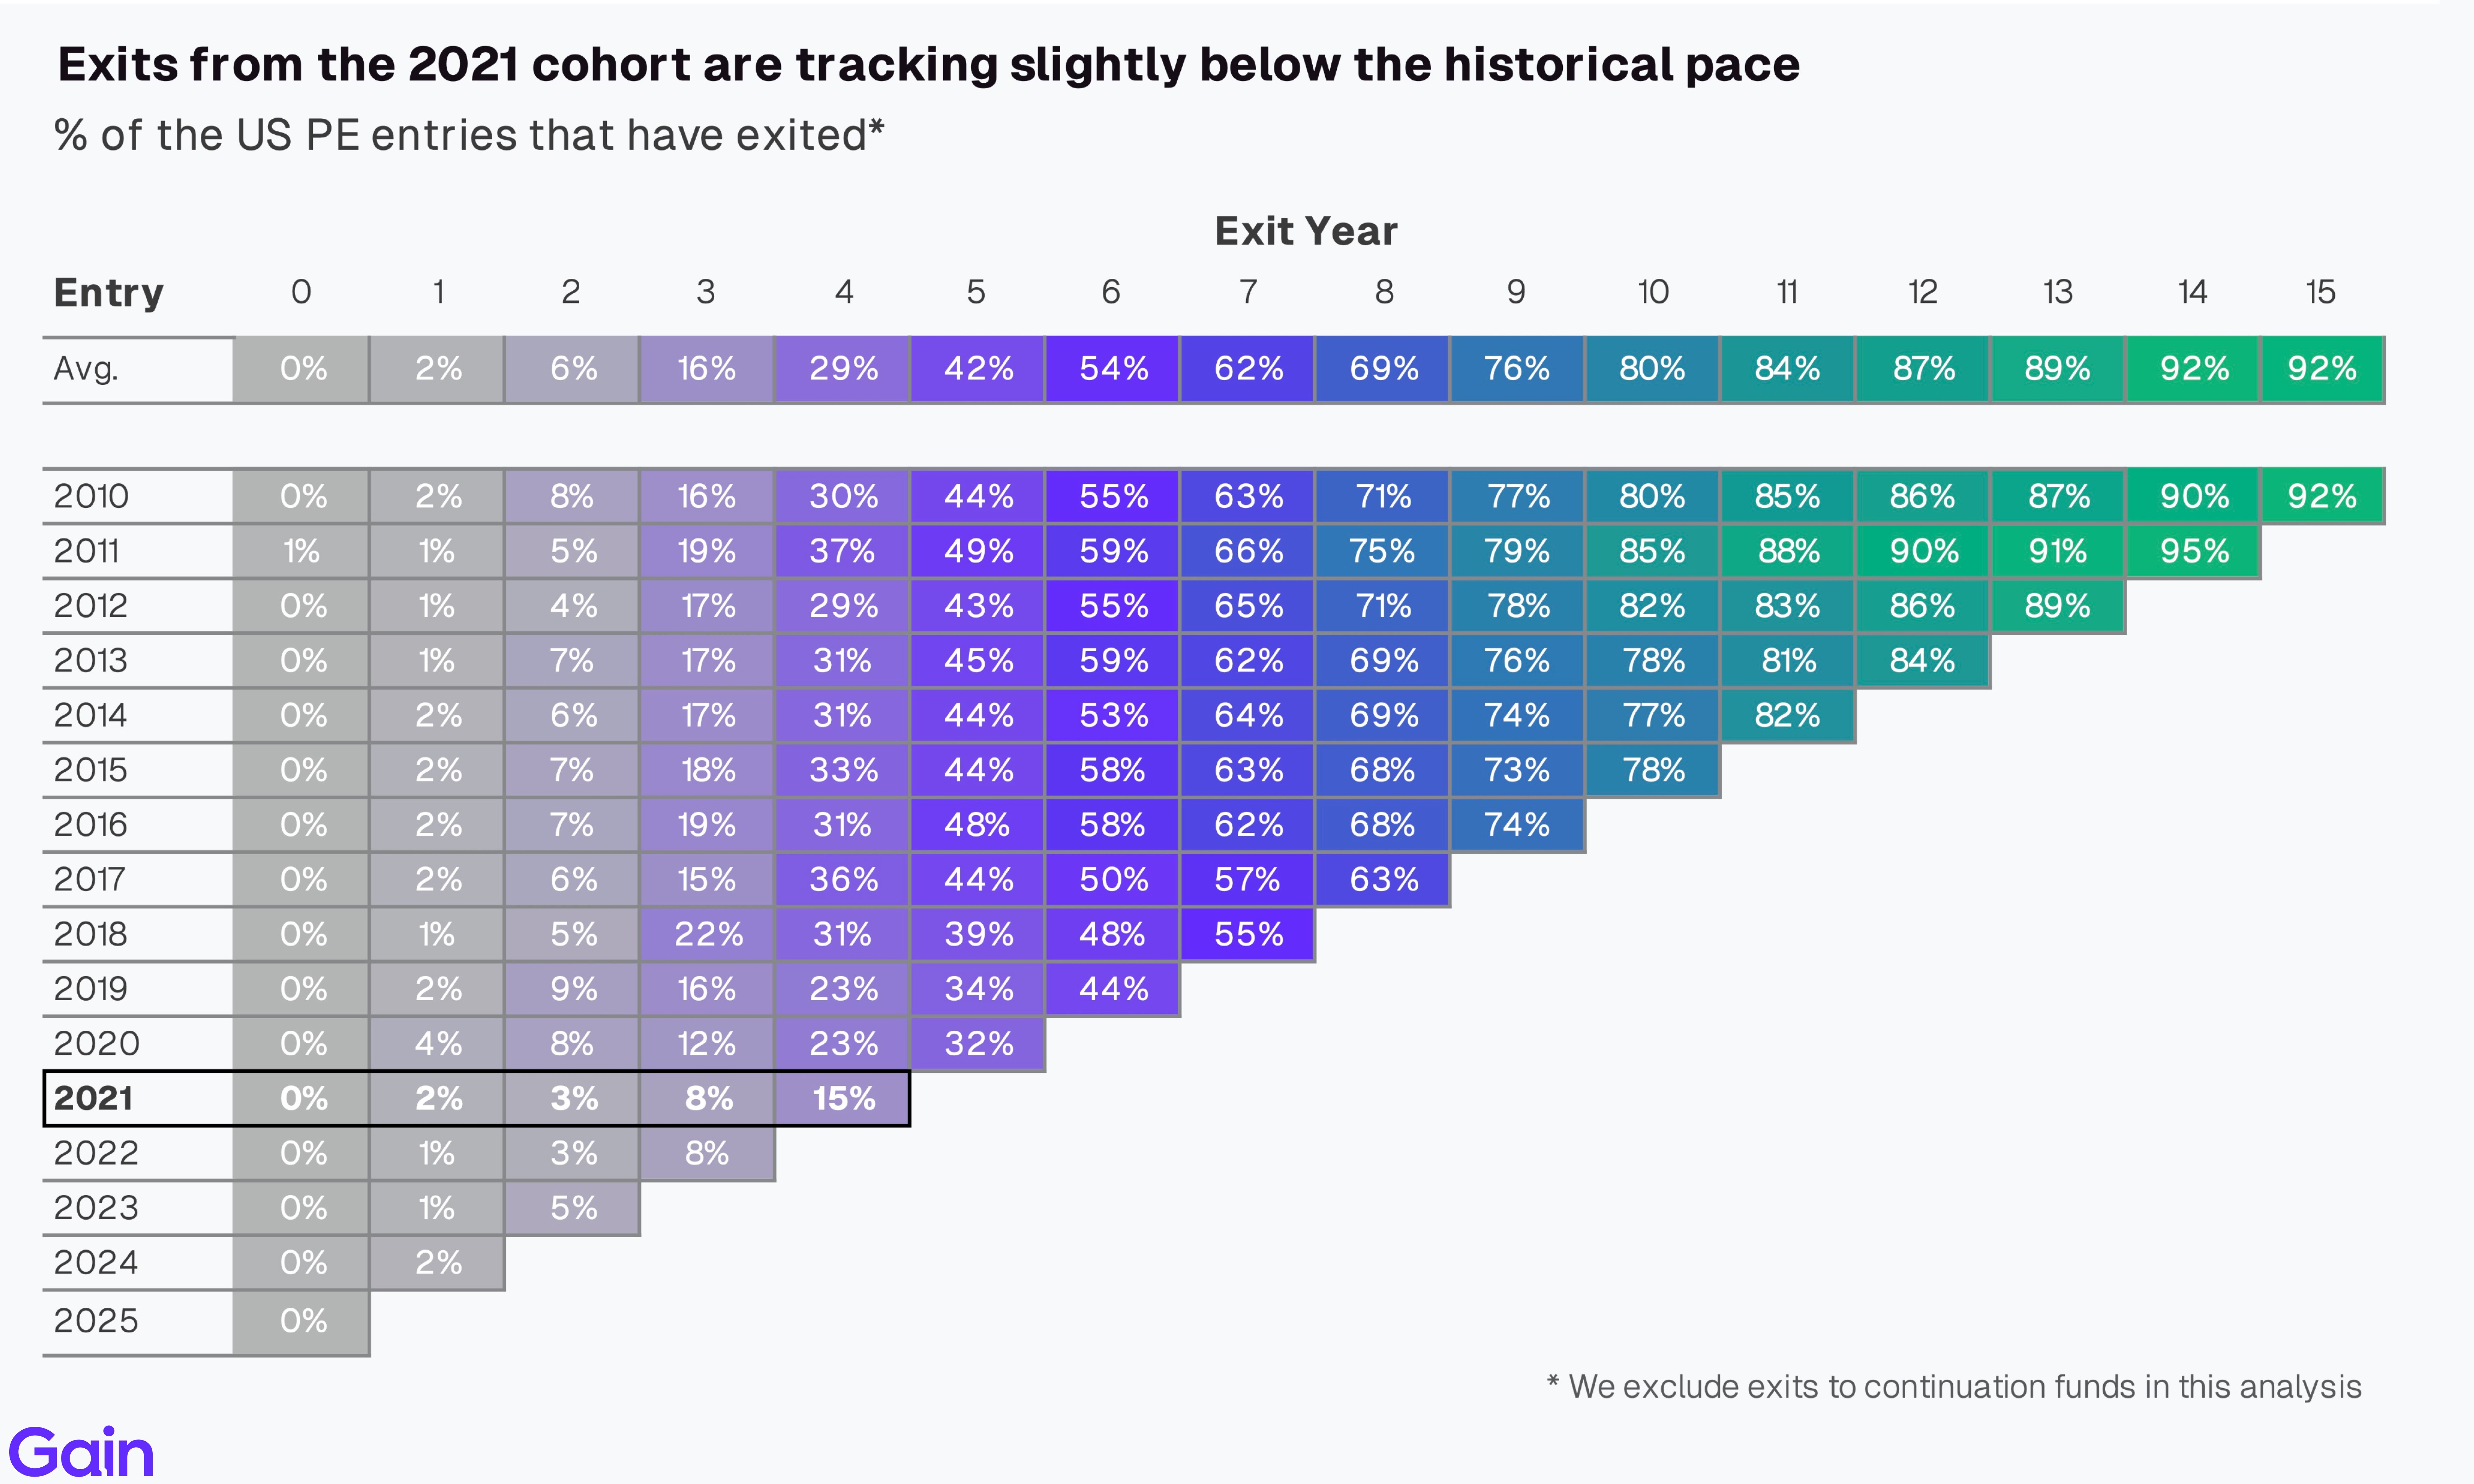
Exit counts from the 2021 vintage are tracking slightly below the prior cohorts at the same stage. Only 15% of assets from the 2021 cohort have exited by year 4, compared to the typical 23-30% range seen in prior vintages. This reflects the challenge of exiting assets bought at peak valuations during the 2021 market high.
Sector and Region
Science & Health and Consumer face the most challenging exit environment, with a high proportion of assets held over 5 years remaining in the backlog. Science & Health is weighed down by regulatory uncertainty and reimbursement overhang, while Consumer assets struggle with slower growth and margin pressure. In contrast, Financials and Services have seen healthier exit activity, supported by stronger earnings momentum and a broader mid-market buyer universe.

Software exits, which accounted for ~15% of all US PE exits (>$5m EBITDA) over the last few years, have fallen to 10% of the market this year. It’s still early to convincingly tell, but concerns in public market software appear to be spilling over into private markets as well.
Of all sectors, Consumer (5.7 years) and Science & Health (5.6 years) have the longest holding periods. In contrast, Services and Energy & Materials have the shortest holding period at 4.8 years, with both sectors also showing the smallest increase from the previous period.
Exits by Deal Type
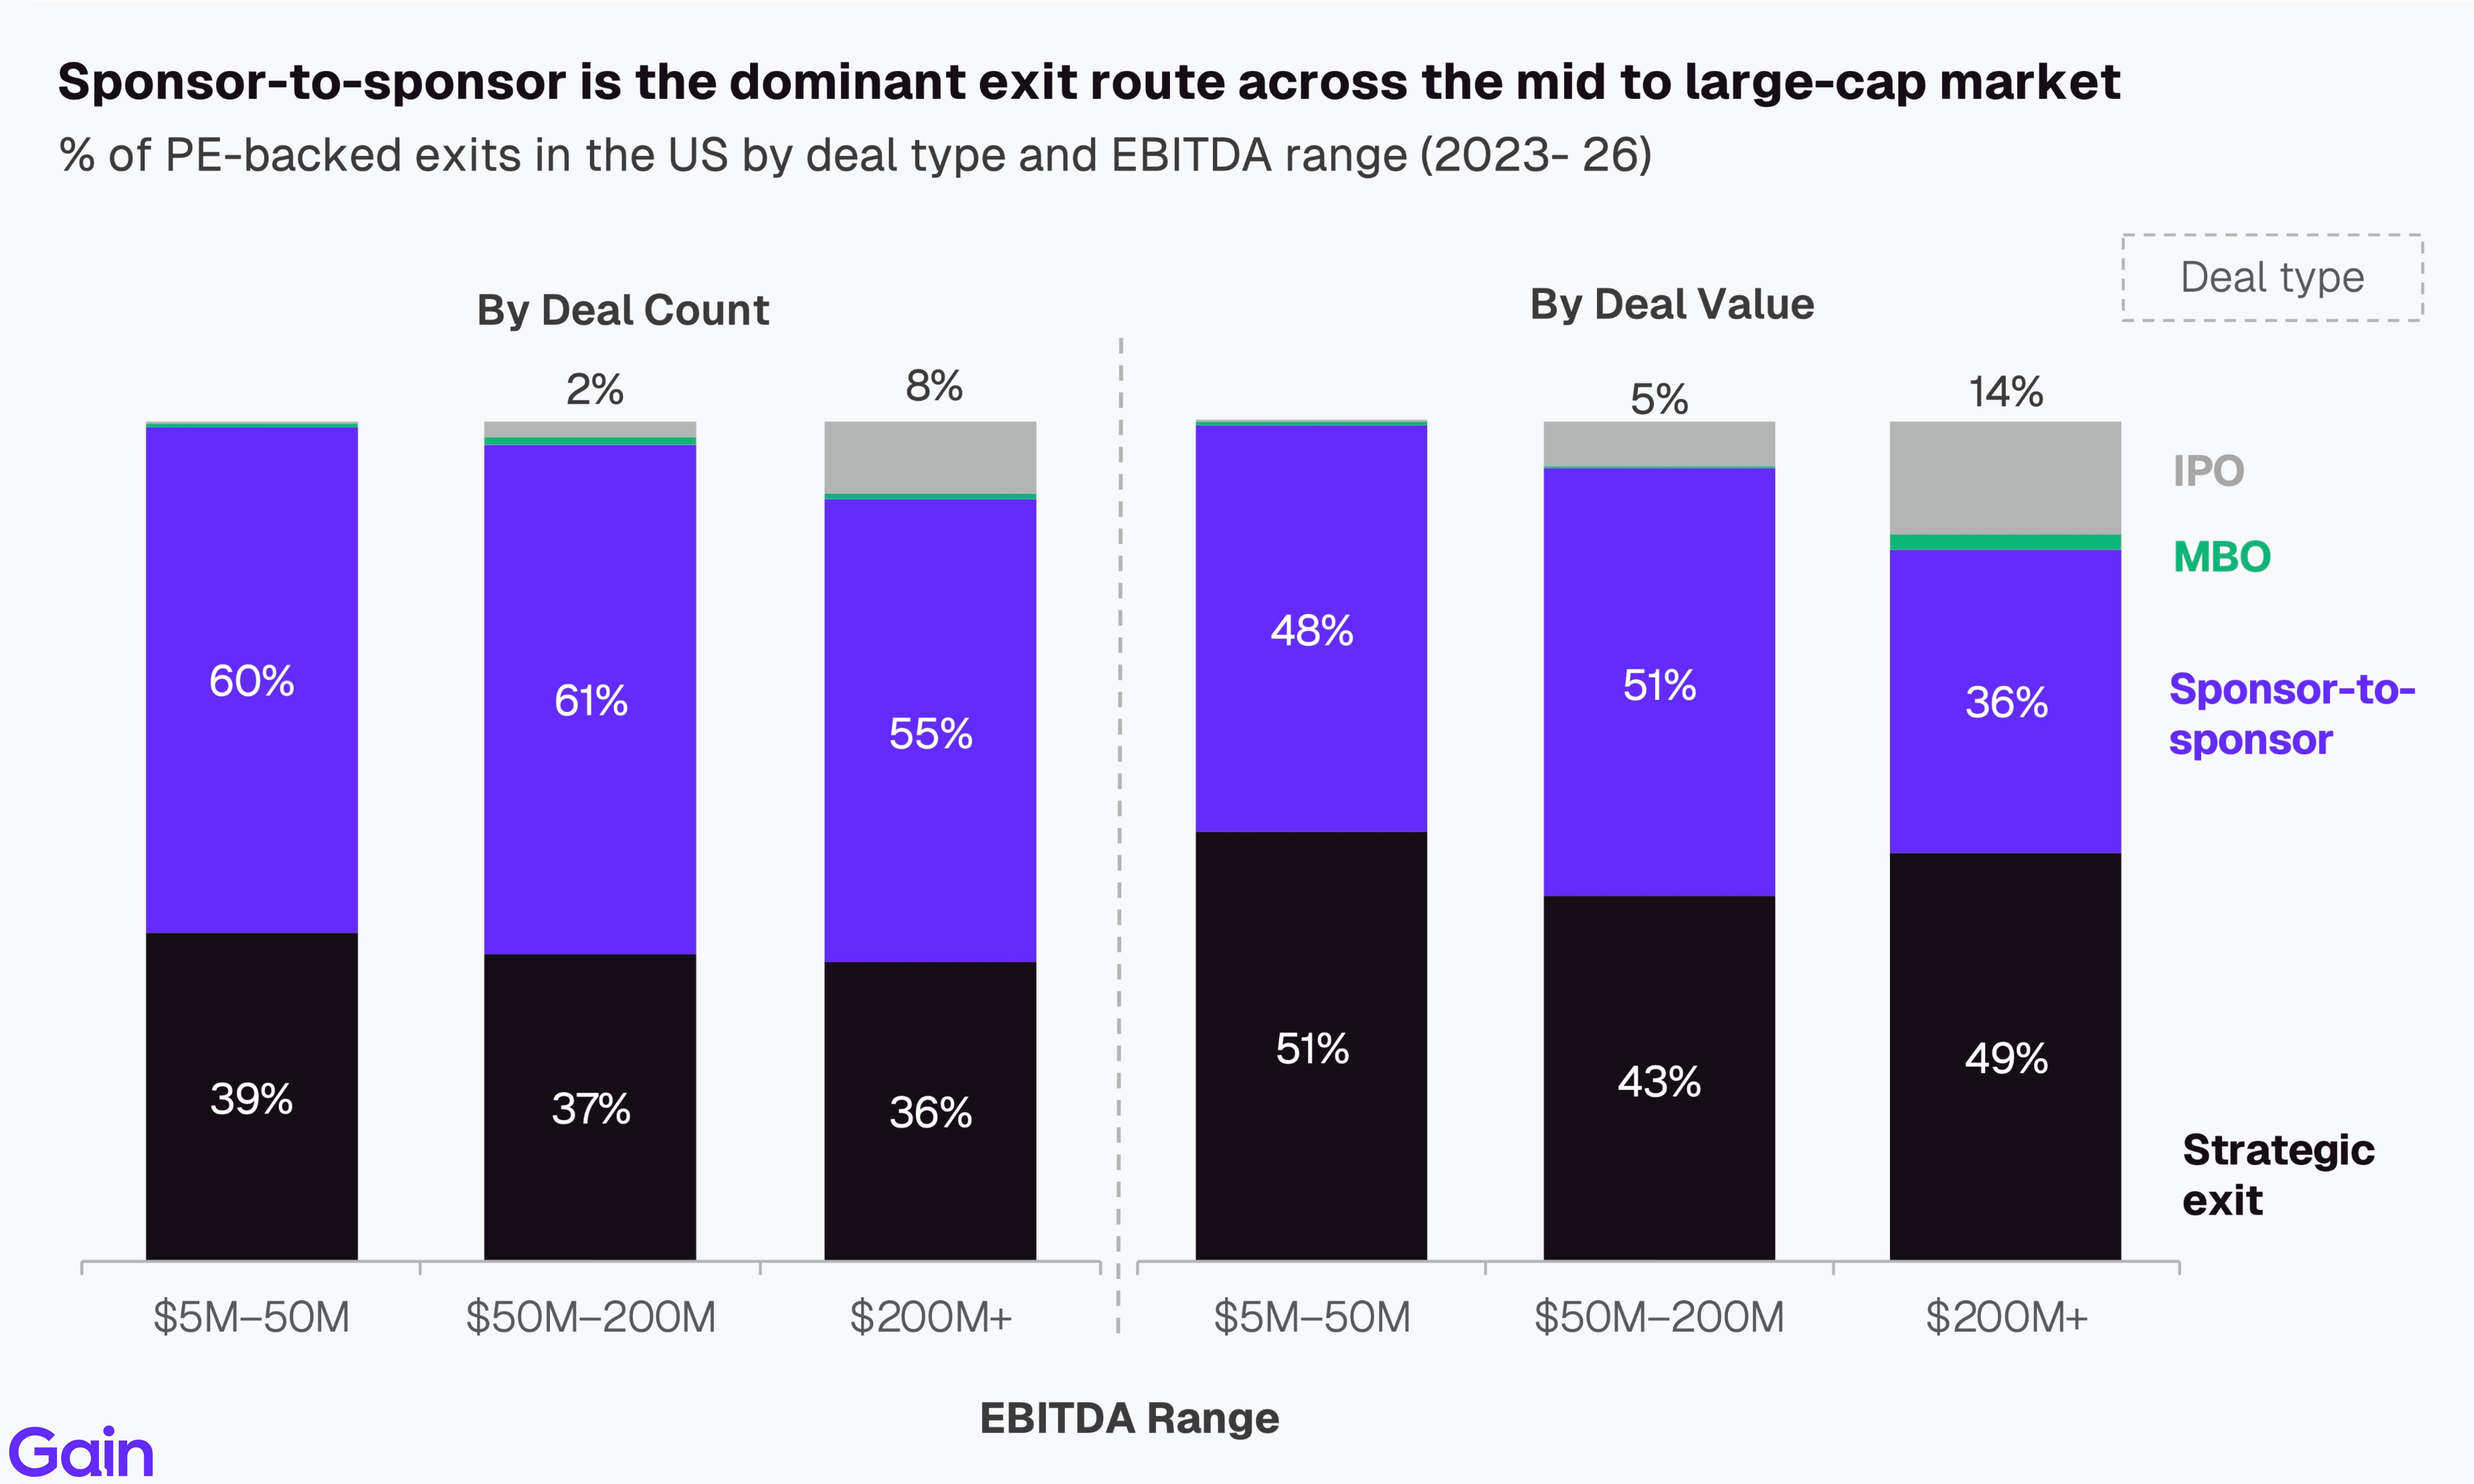
Sponsor-to-sponsor is the dominant exit route, accounting for ~55-60% of all exits by count. Strategic exits account for ~30-40%, with IPOs making up the remainder. The share of IPO exits increases as deal size increases.
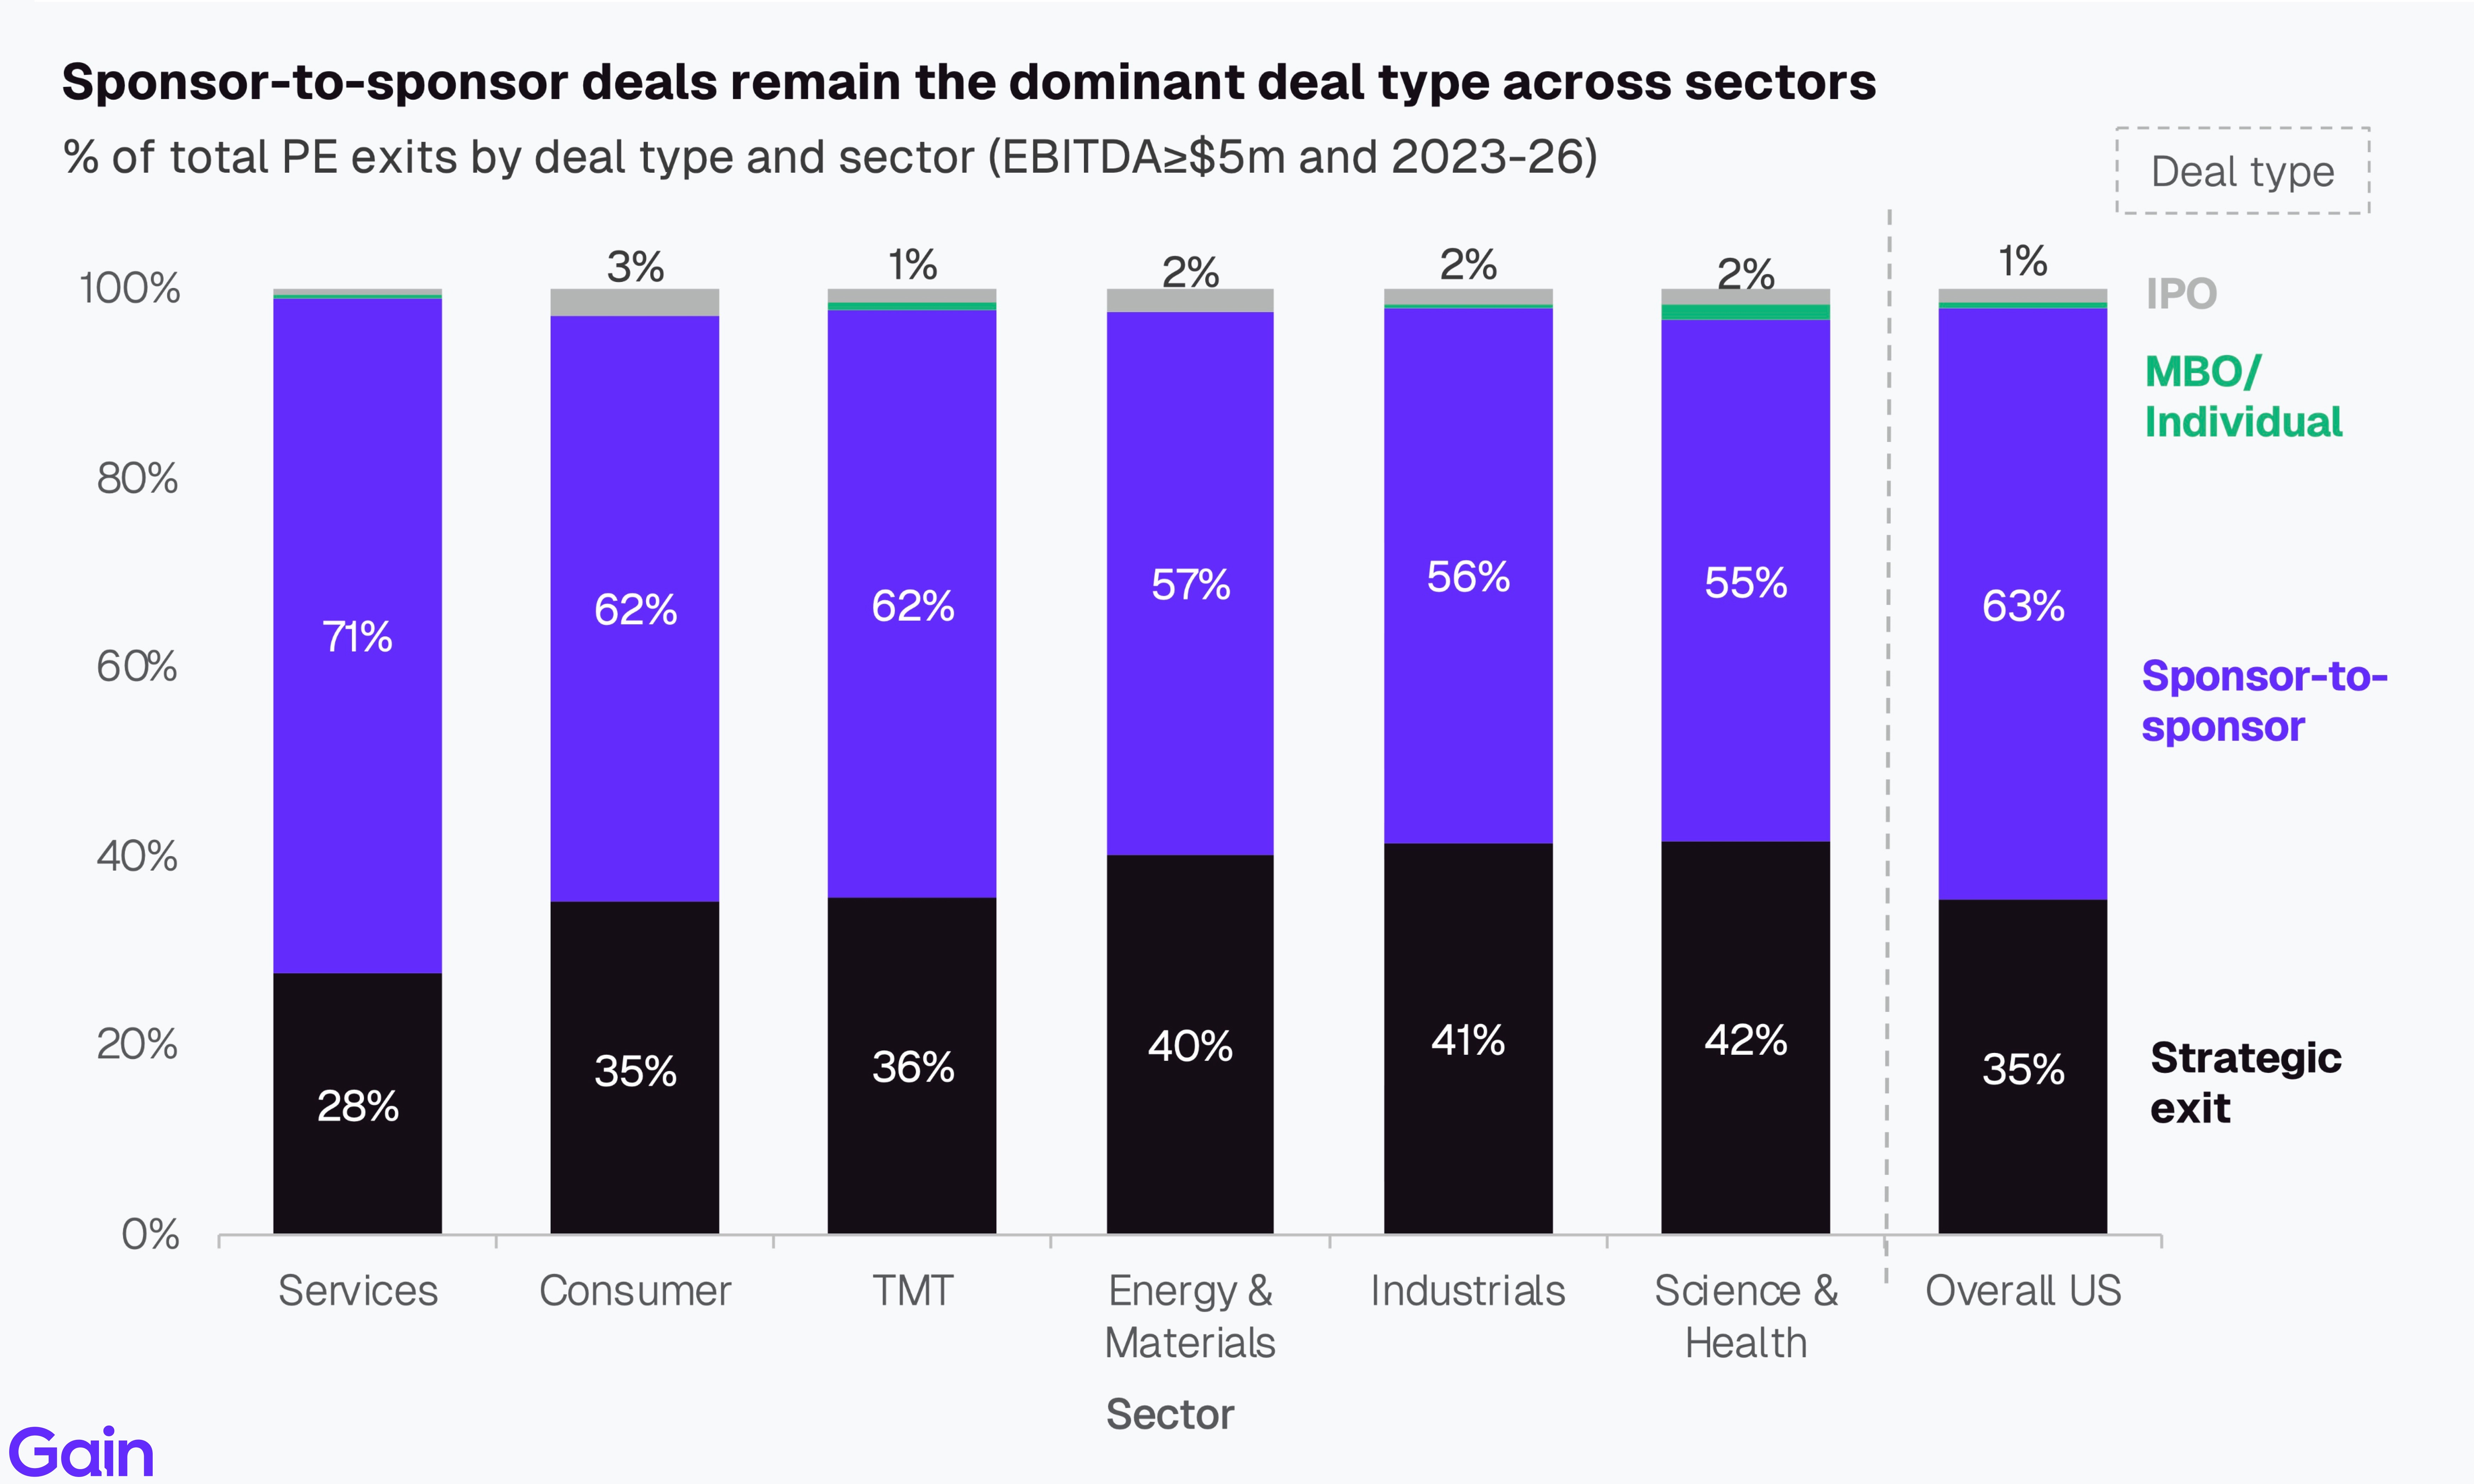
Sponsor-to-sponsor deals remain the dominant deal type across sectors, accounting for 63% of all US PE exits. Services (71%) has the highest share of sponsor-to-sponsor exits, while Energy & Materials (40%), Industrials (41%) and Science & Health (42%) have a higher share of strategic exits. Energy & Materials, in particular, sees many acquisitions of renewable and clean-tech assets to support energy transition strategies and meet ESG commitments.
Turn insights into action
Behind every chart and trend in this report is actionable data your team can use to source better deals, faster.
See Gain in action!


Chapter 03: Buy-and-Build
Deal Activity
In the US, add-ons accounted for 74% of overall PE deal activity in 2025, with their share holding steady over the past four years. The US market sees more add-ons compared to the European market, where a lower 69% of all deals are add-ons. In both markets, add-on activity has flatlined over the last few years owing to limited multiple arbitrage opportunities, integration challenges, and higher financing costs.

Services is the largest sector for add-ons in the US, accounting for 37% of deals, followed by TMT (20%) and Science & Health (13%). Across all sectors, buy-and-build strategies continue to drive value through accelerated revenue growth and cost synergies.
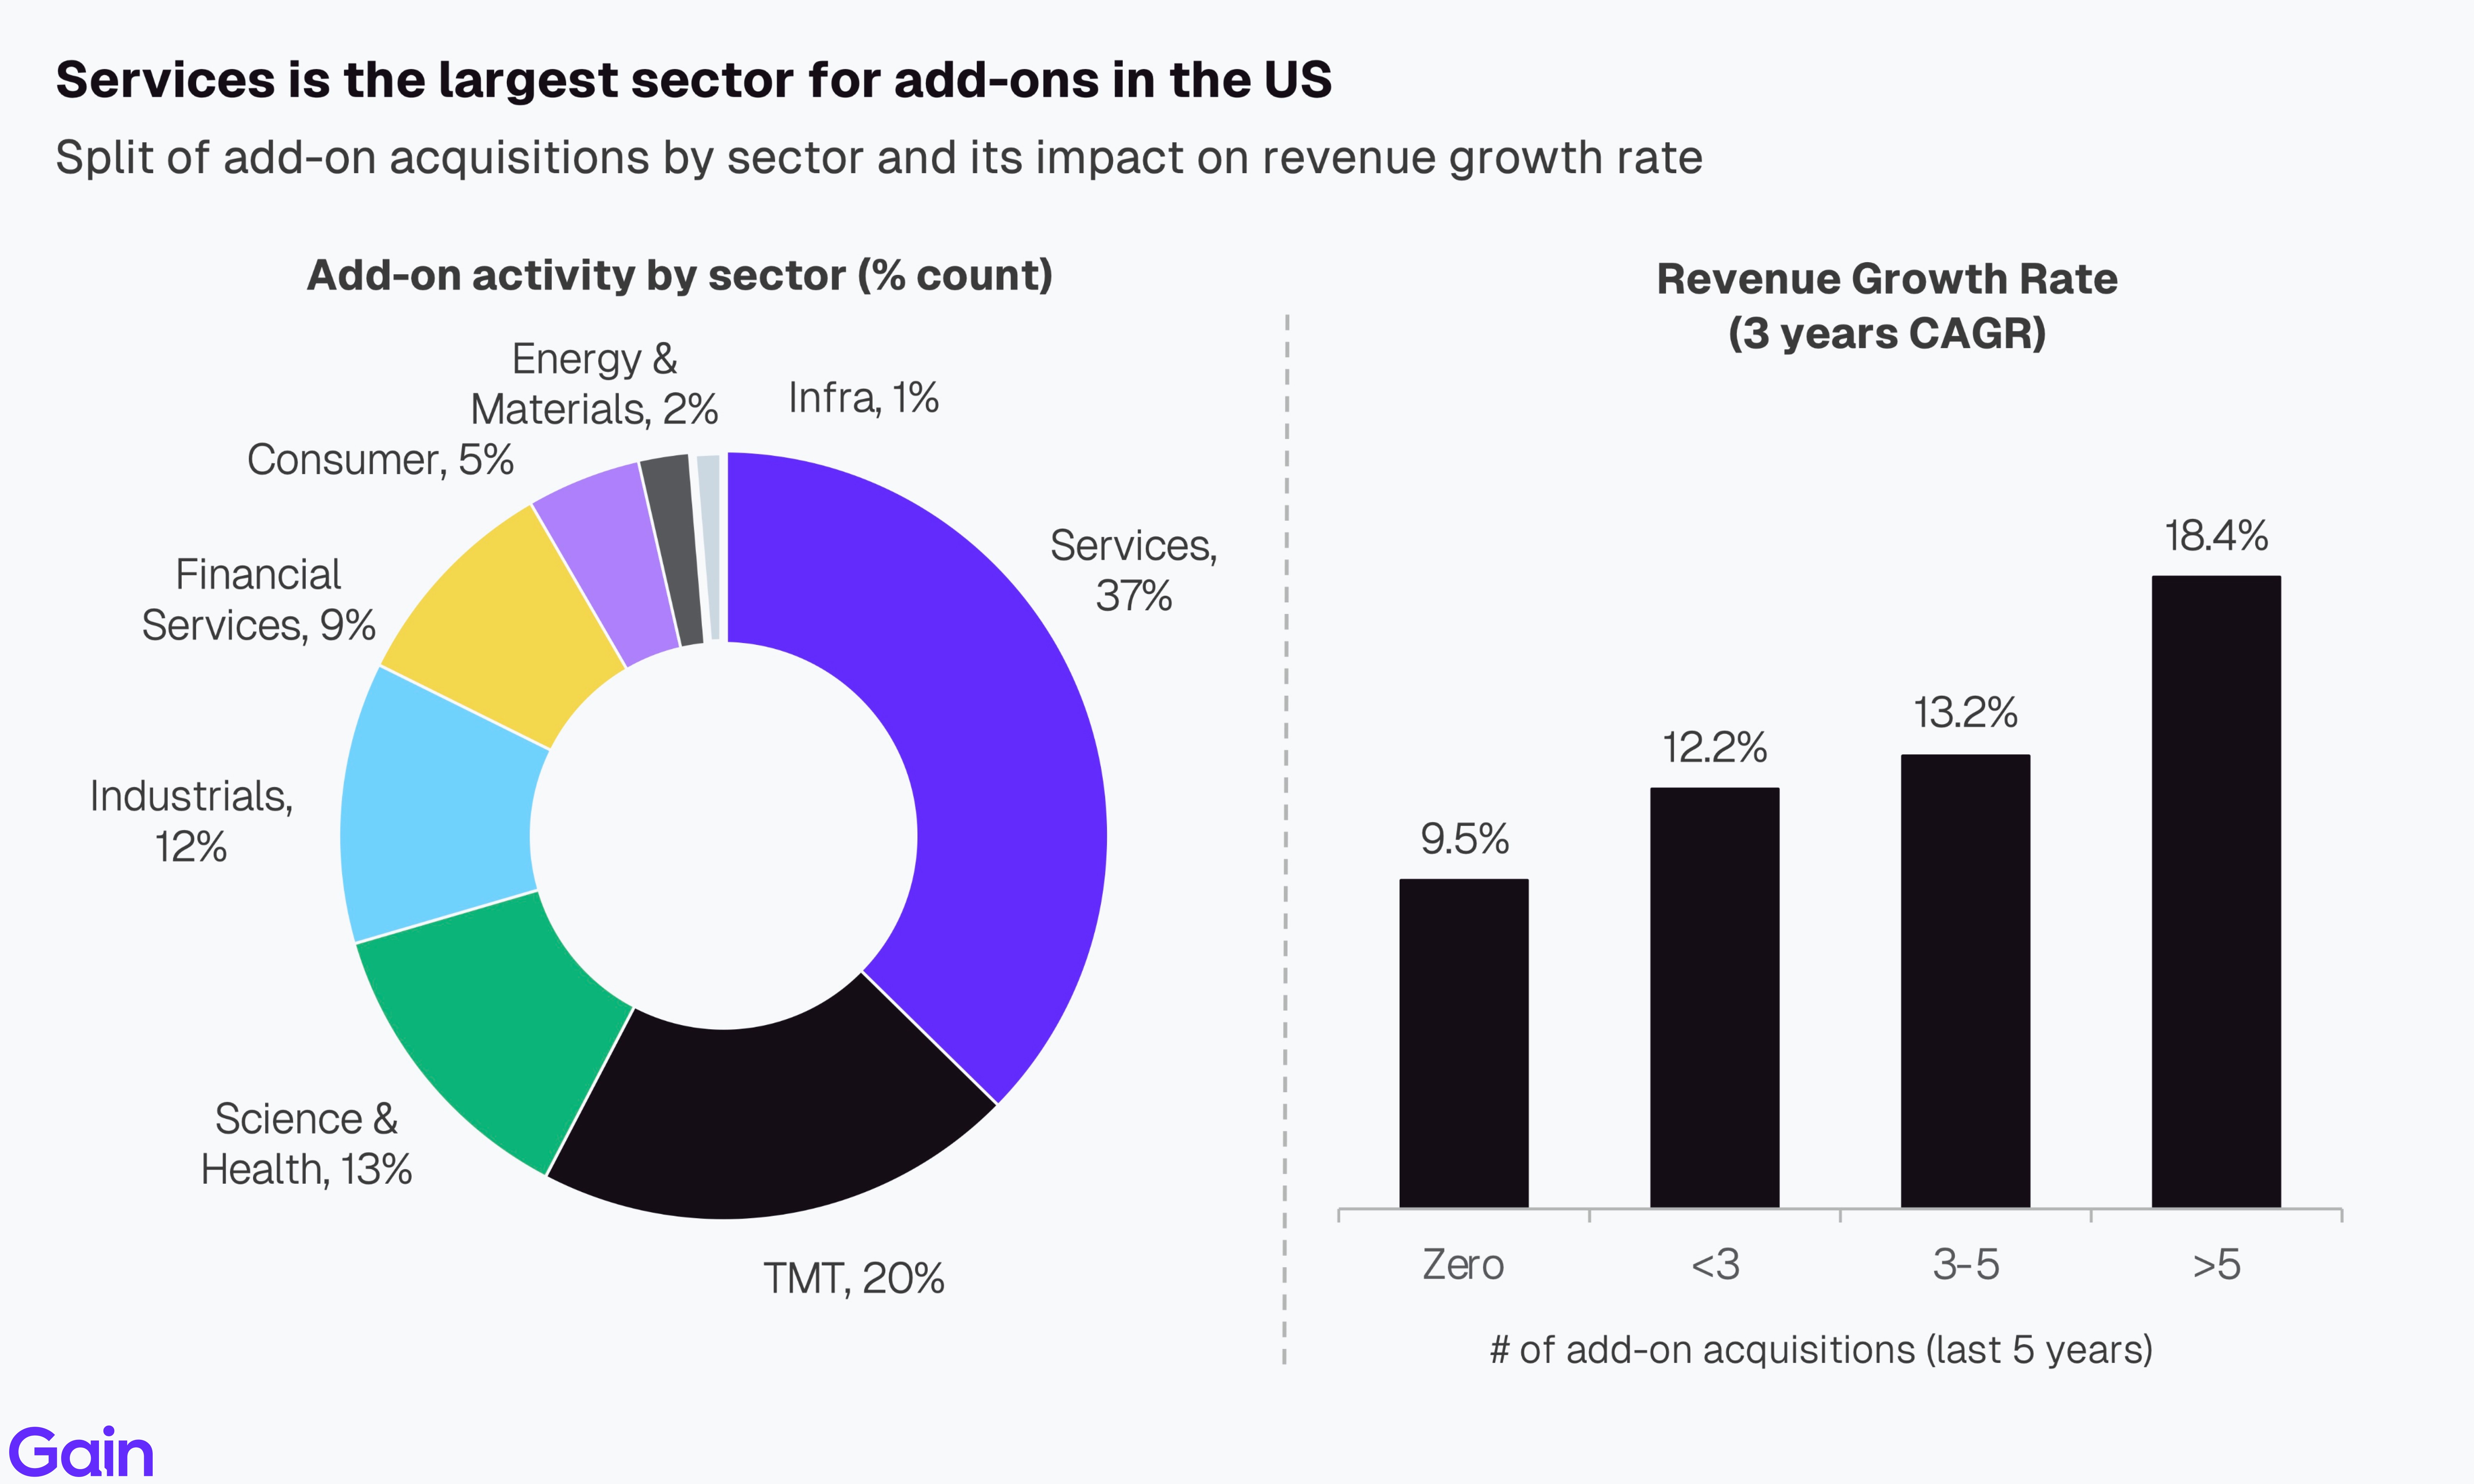
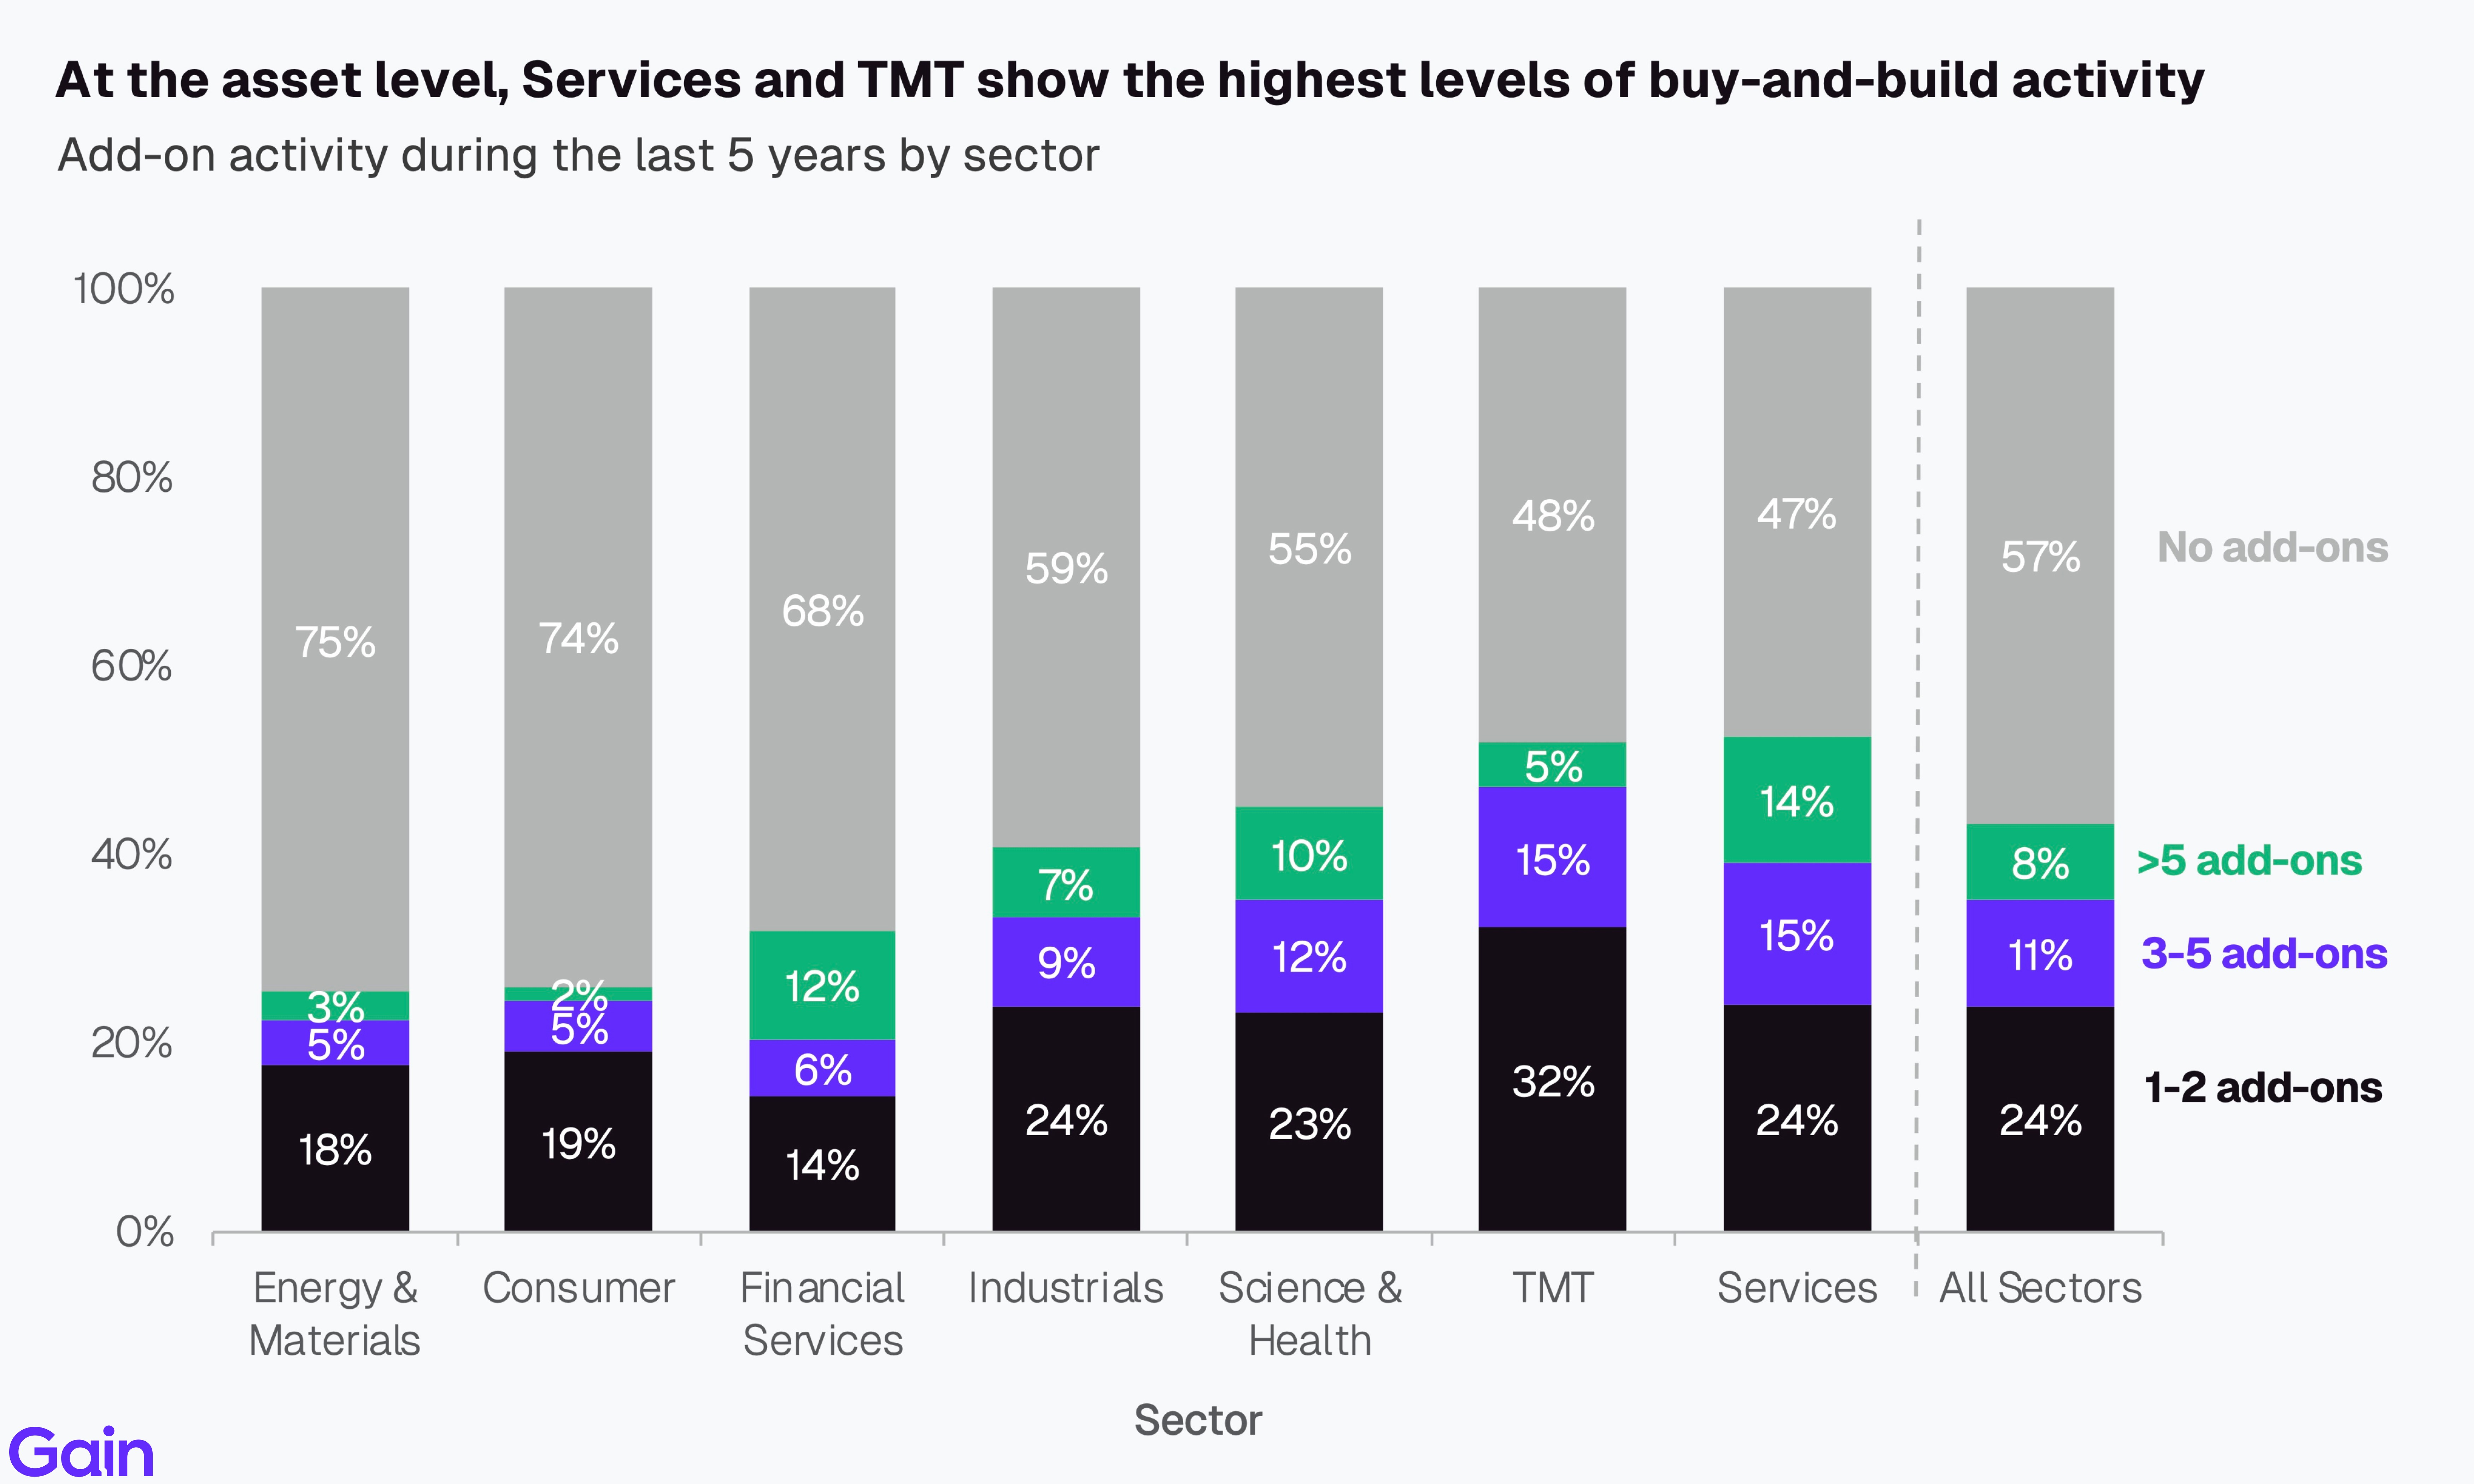
At the asset level, Services (53%) and TMT(52%) show the highest levels of buy-and-build activity. In Services, market fragmentation and limited organic growth potential make M&A essential for value creation, with sponsors capturing multiple arbitrage by consolidating smaller operators into scaled platforms. In TMT, buy-and-build is driven by the need to acquire complementary technology capabilities and expand product suites faster than organic expansion allows.
Largest Consolidators
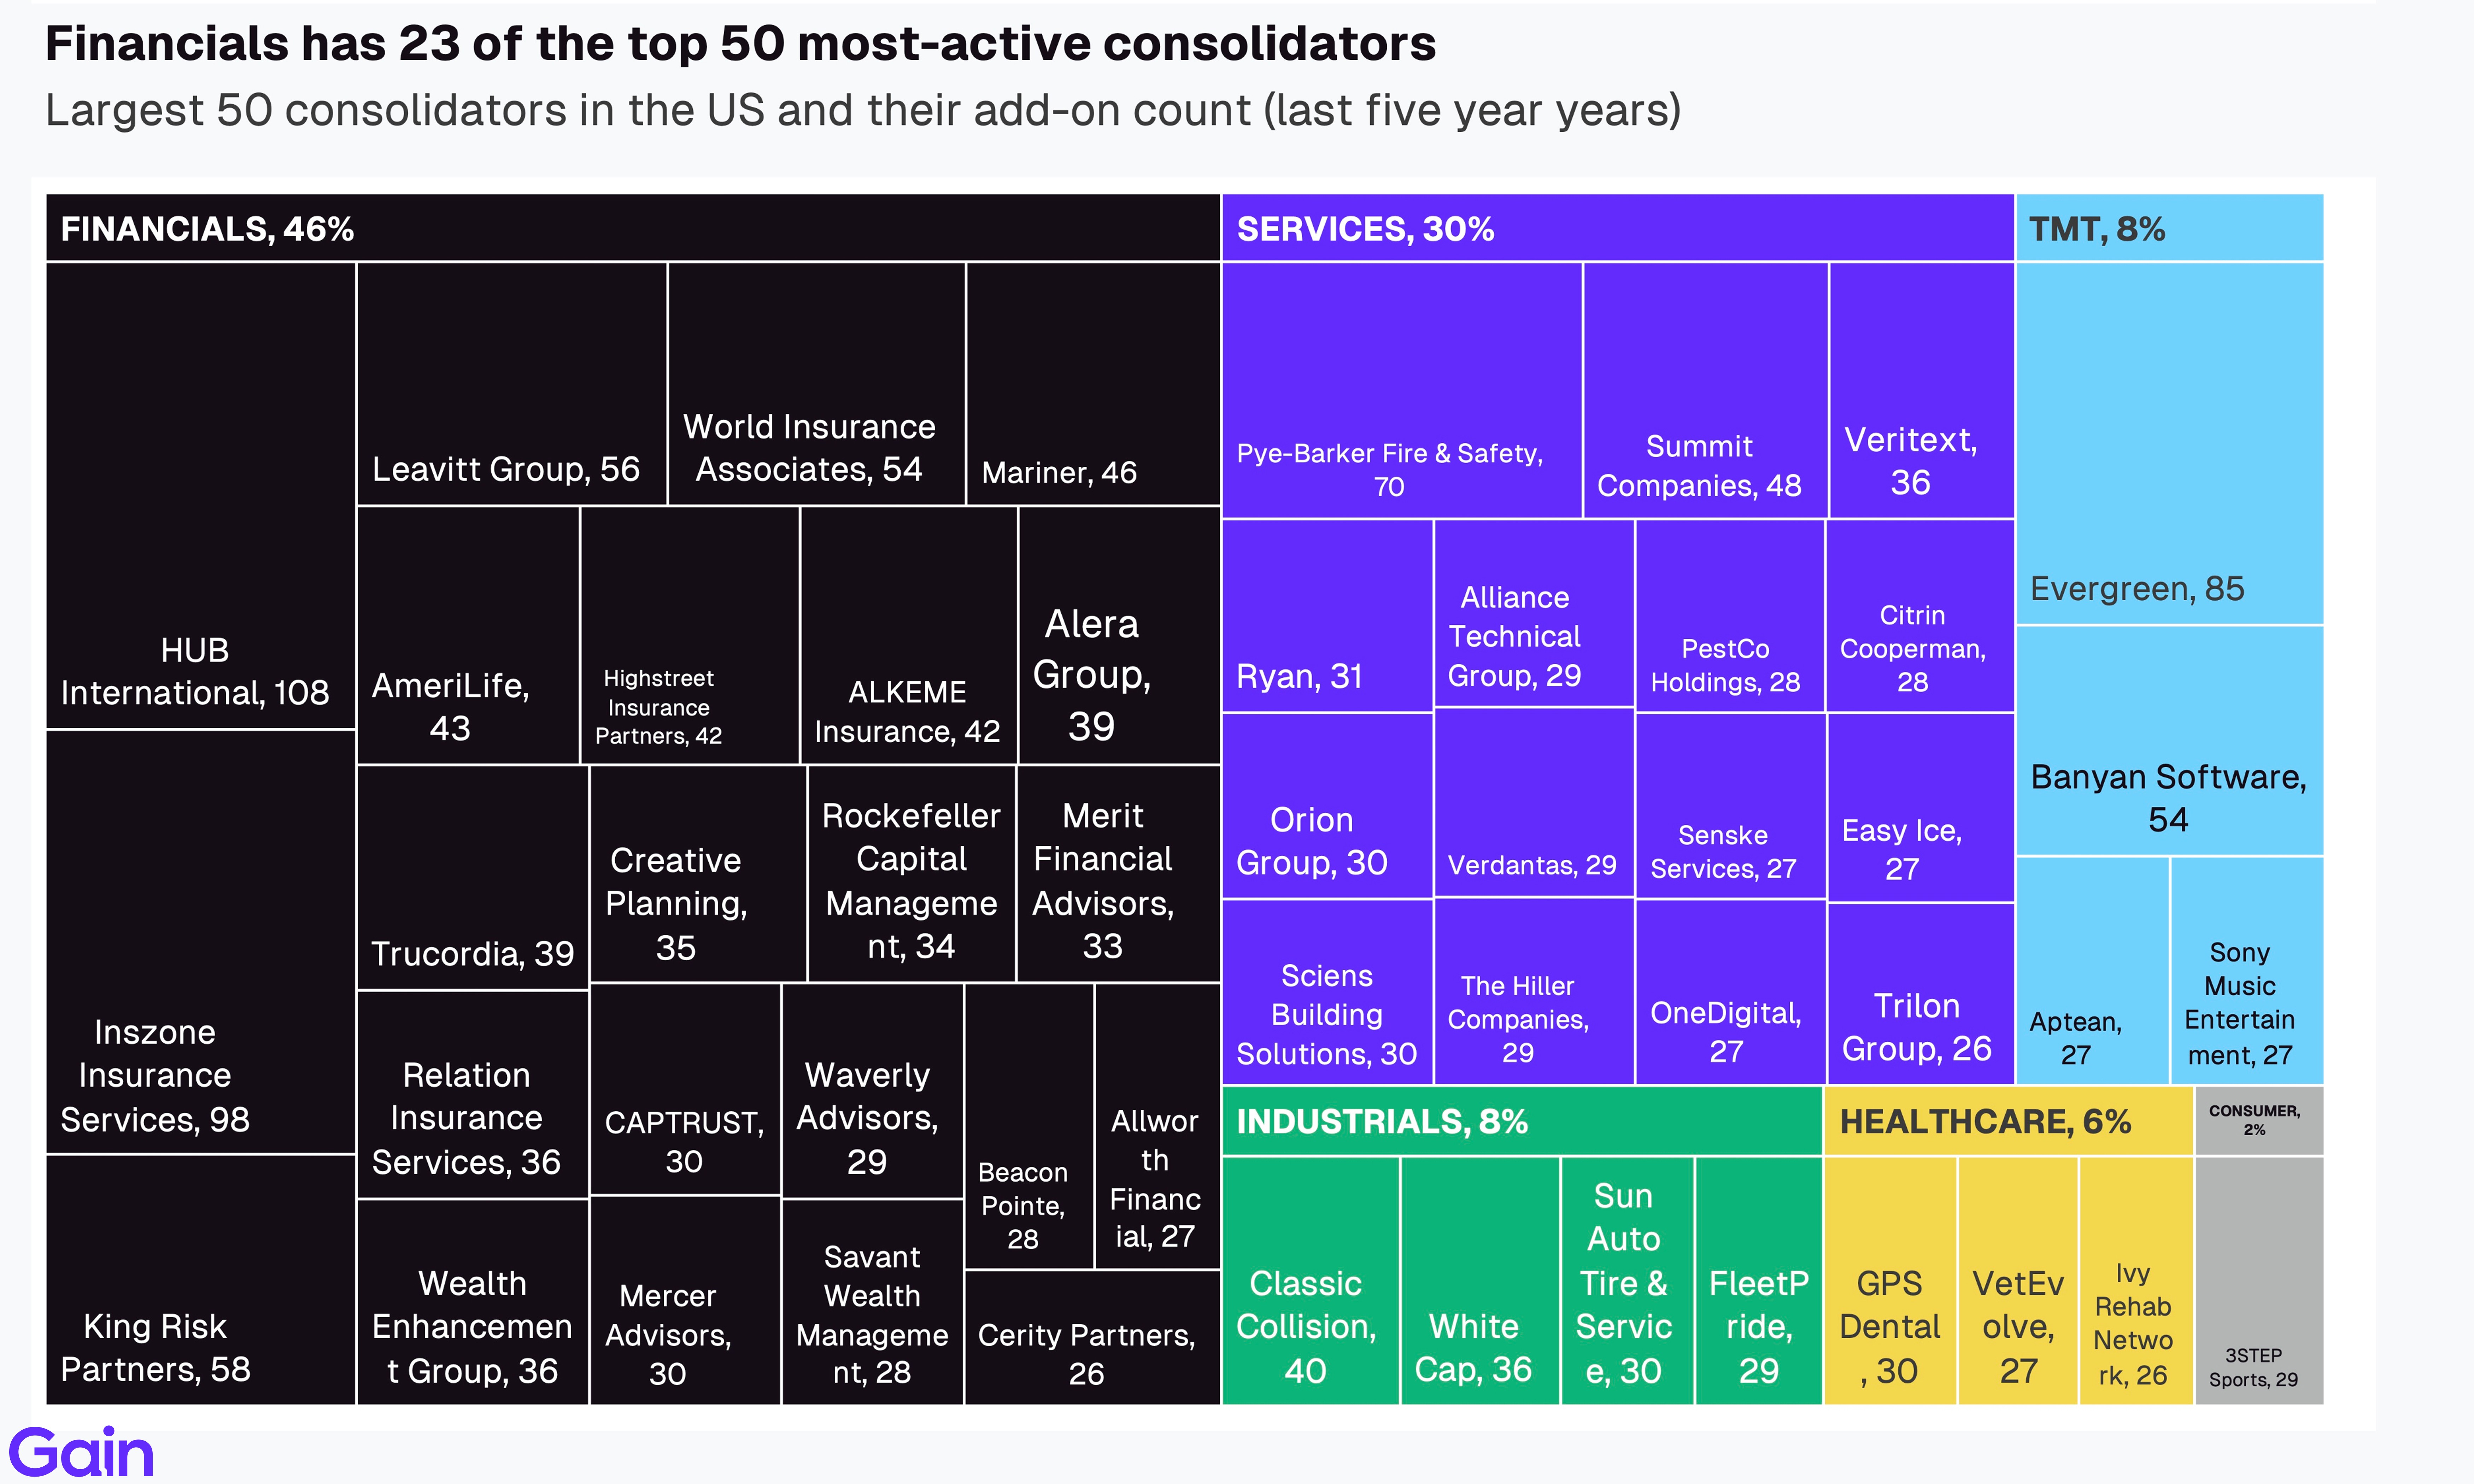
Financials has 23 of the top 50 most-active consolidators. HUB International leads the list with 108 add-ons over five years, followed by Inszone Insurance Services (98) and King Risk Partners (58). Many US financial institutions pursue strategic acquisitions for both AUM and market share expansion. Services accounts for a further 30% of the most active consolidators, led by Pye-Barker Fire & Safety (70) and Summit Companies (48). TMT and Industrials each represent 8% of the most active acquirers.
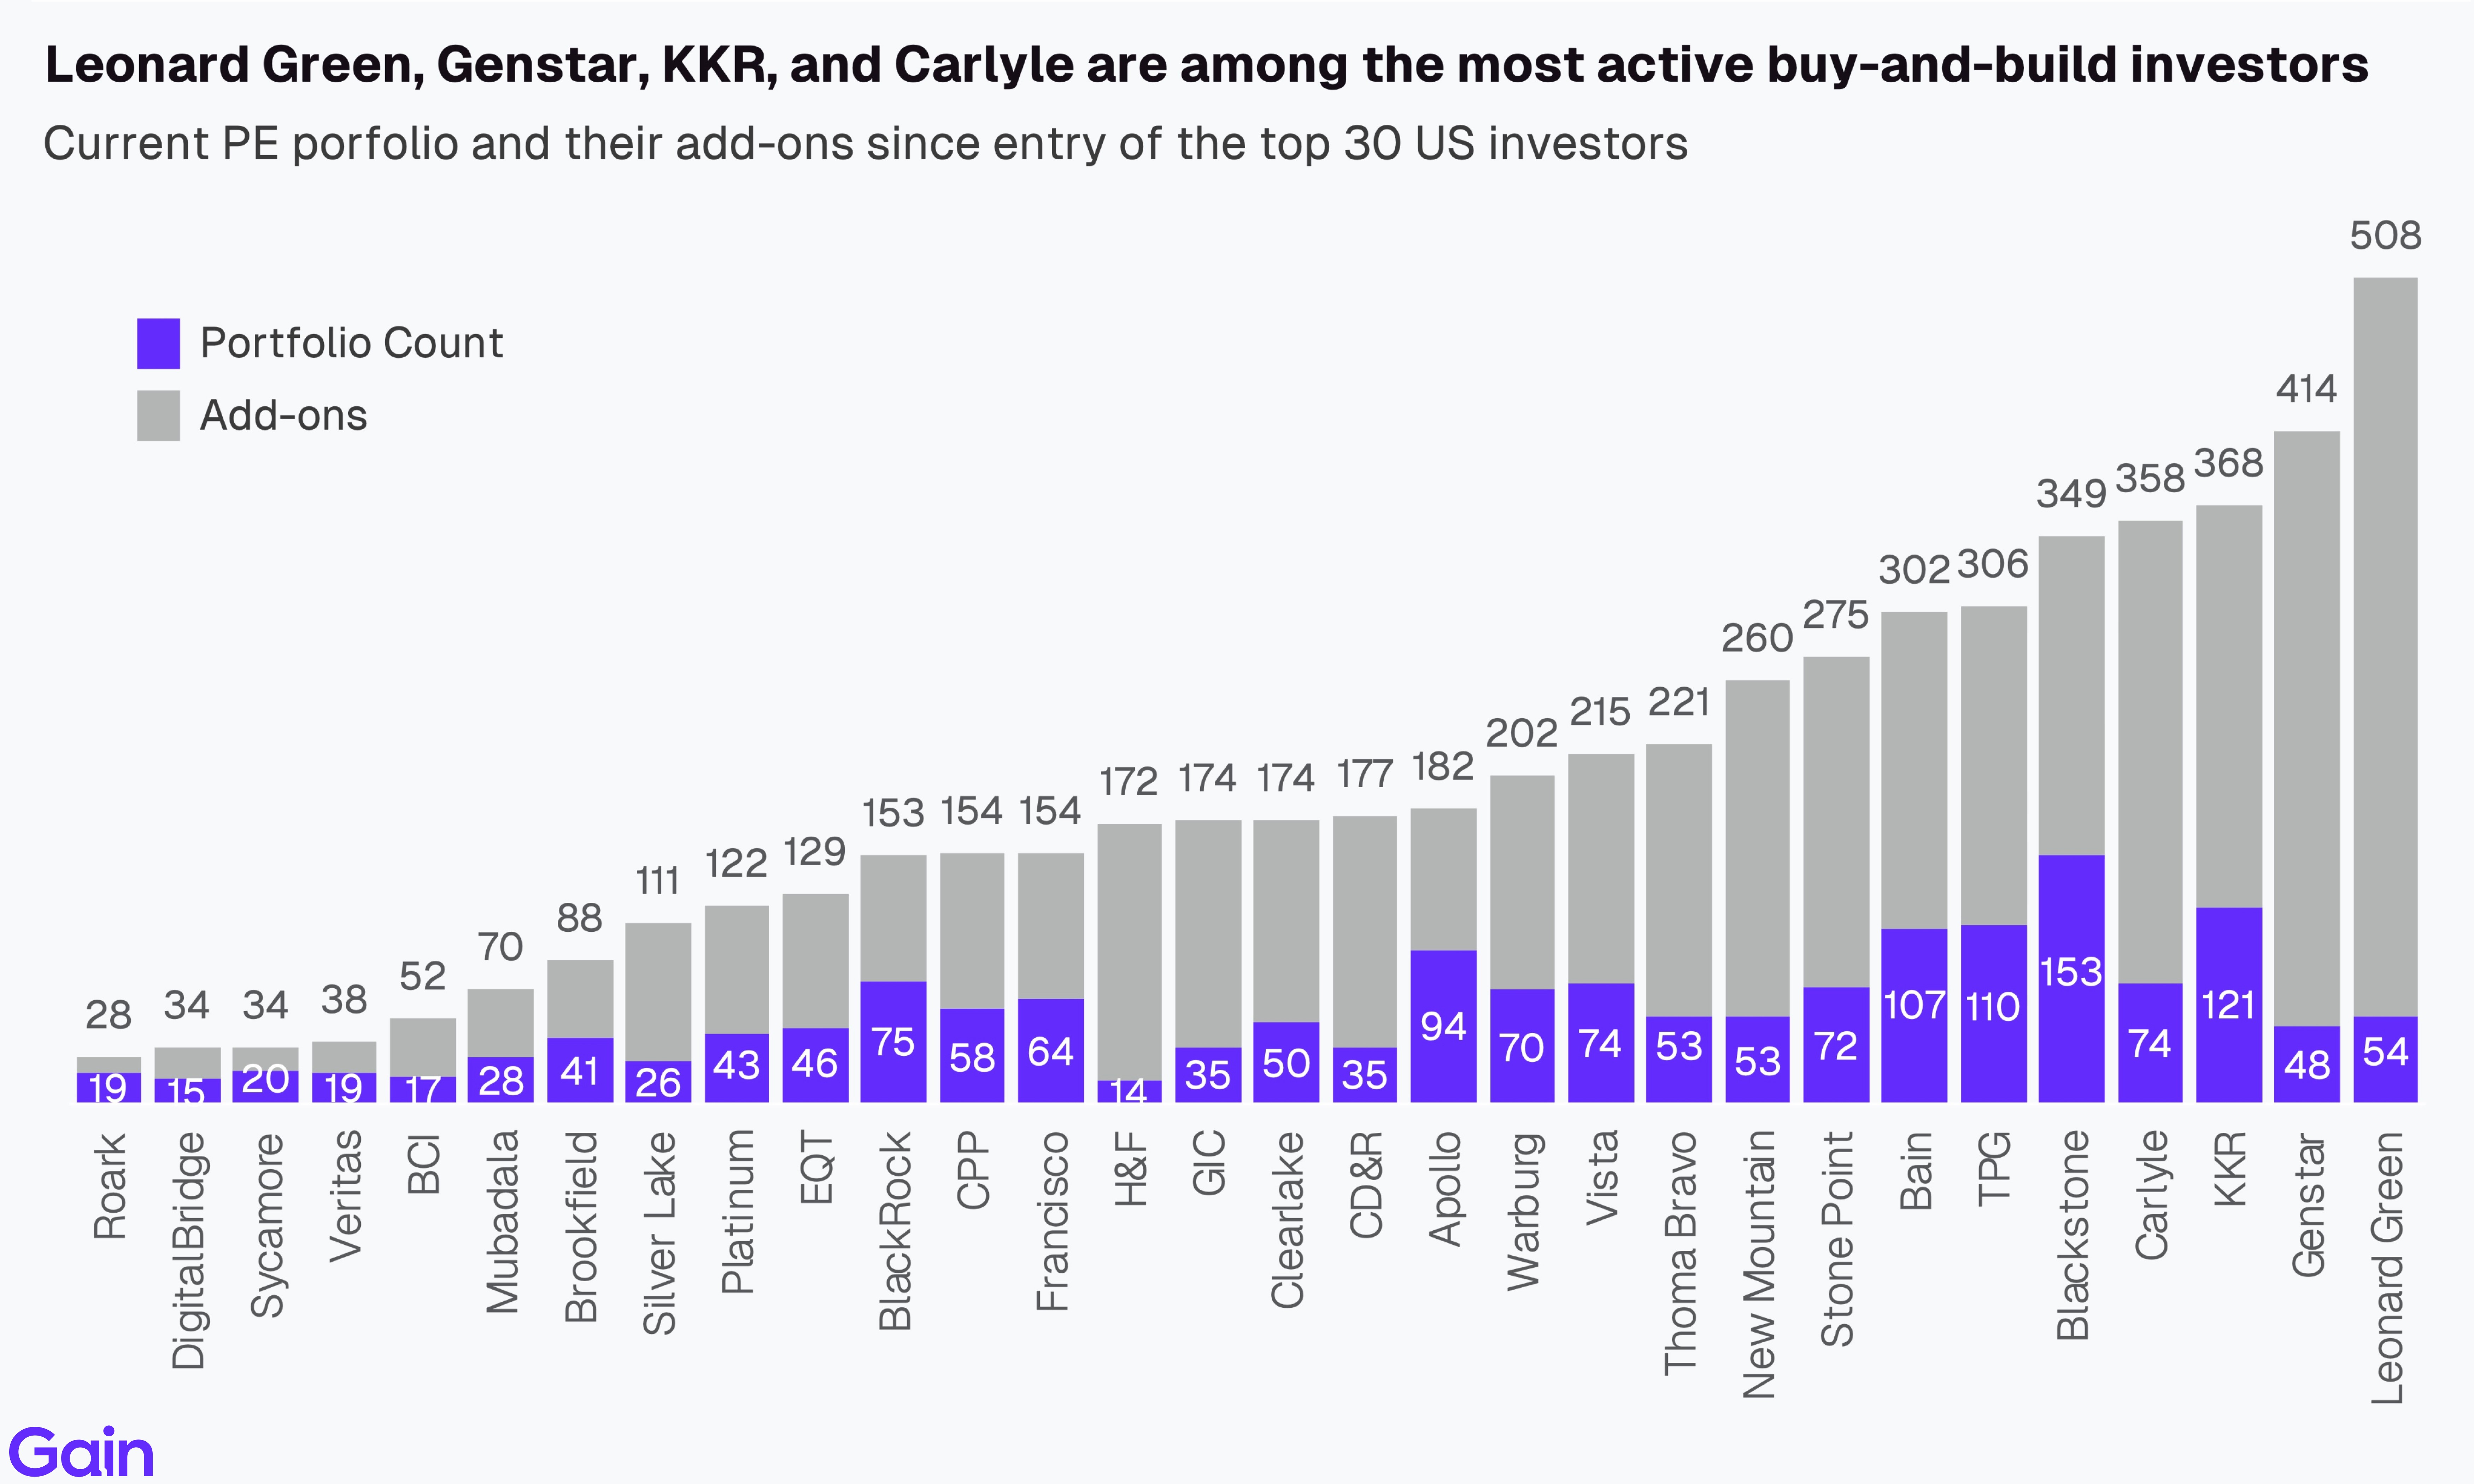
Leonard Green, Genstar, KKR, and Carlyle are among the most active buy-and-build investors in the US. Roark (28), DigitalBridge (34), and Sycamore (34), in contrast, aren’t as active in the buy-and-build markets.
Chapter 04: Value Creation & Multiples
Value Creation
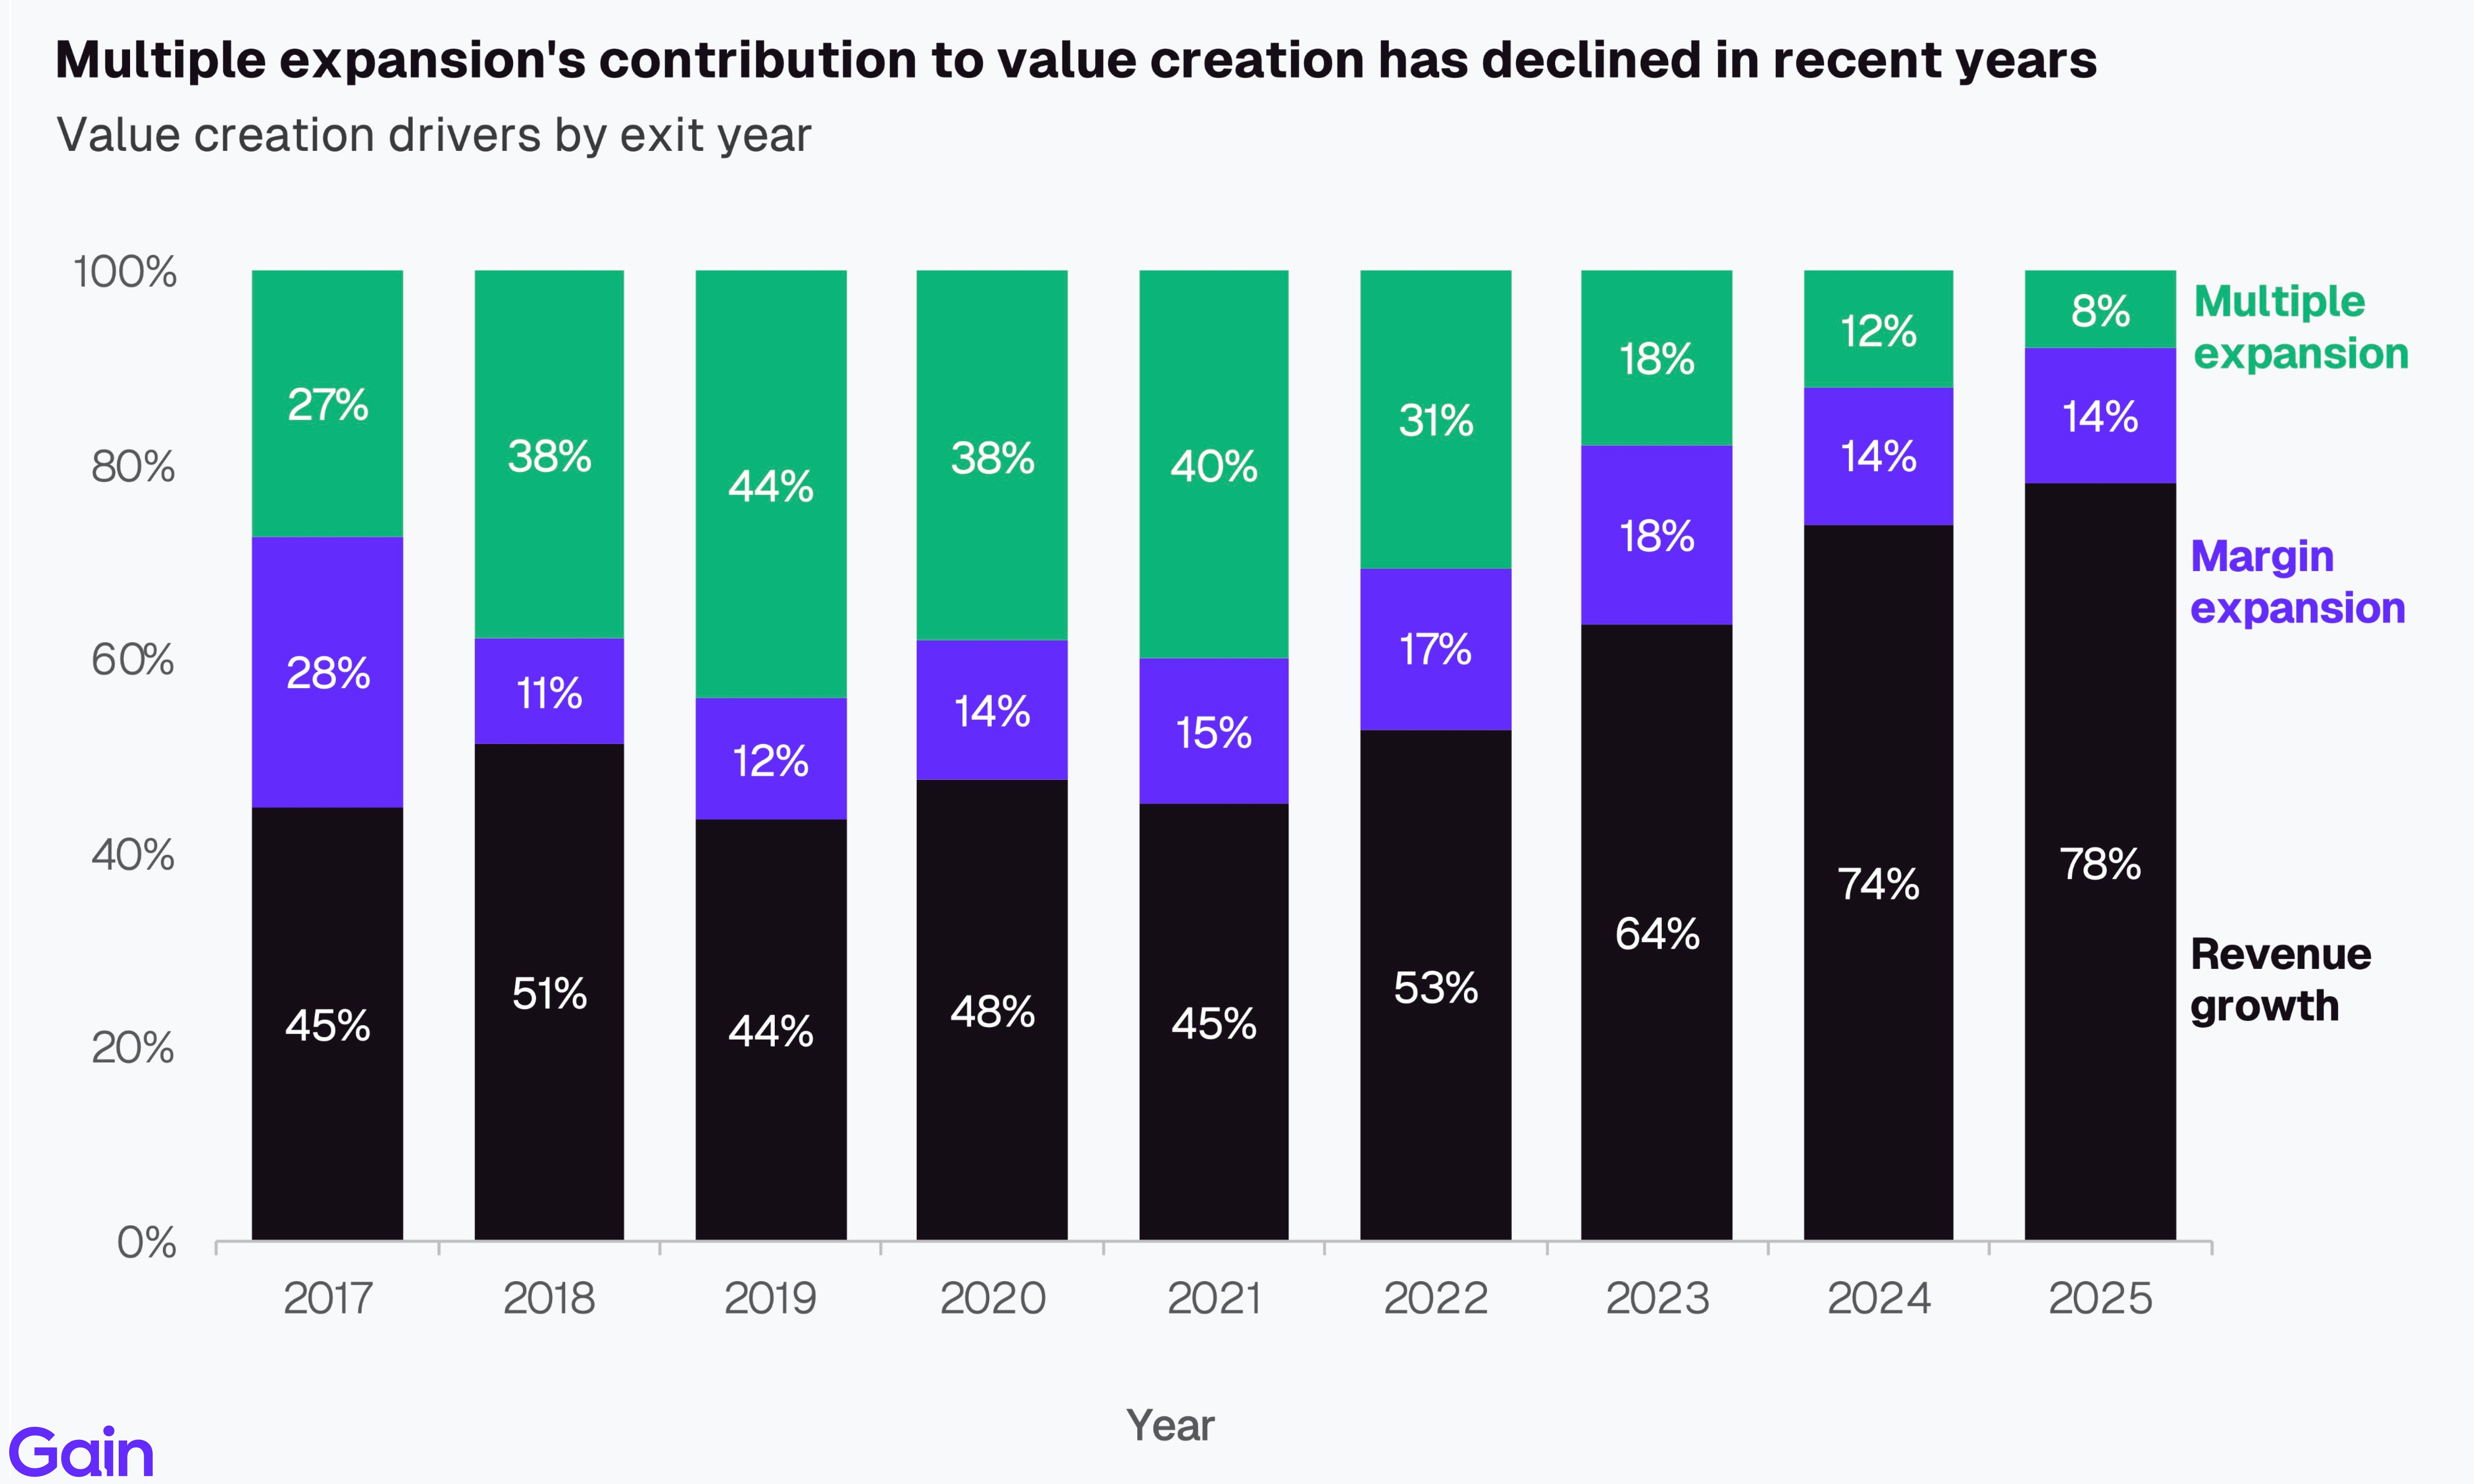
Multiple expansions' contribution to value creation has declined in recent years. It contributed to ~40-45% of returns in 2019-21, driven by higher exit multiples and attractive entry valuations. However, as exit multiples have come down, revenue growth has become the primary driver of value creation (~75-80% of returns). We expect revenue growth to remain the key driver going forward as multiples remain under pressure in this higher-for-longer interest rate environment.
Revenue Growth
Growth for PE-backed assets is coming off cycle highs and is now below pre-pandemic levels. The median PE-backed business grew 5.6% in 2025, down from a high of 22.1% in 2021. Higher input costs, trade tariffs, and muted demand have put downward pressure on growth, compounded by challenging comps from post-pandemic expansion. Given how crucial growth is to PE value creation, any further weakening could dampen PE returns and limit exit opportunities.

TMT (15.6%), Financial Services (15.2%), and Services (14.7%) are the fastest-growing sectors among US PE-backed assets. Science & Health (7.6%) and Industrials (8.7%), in contrast, have lagged behind. We expect TMT revenue growth to moderate from here on, as AI puts pricing and top-line pressure across certain software categories.

Multiples
PE multiples rebounded in 2025 (13.2x) but remain well below the 2021 highs (-18%). We expect multiples to flatline from here, as interest rates remain high (given higher inflation) and buyer competition remains limited.
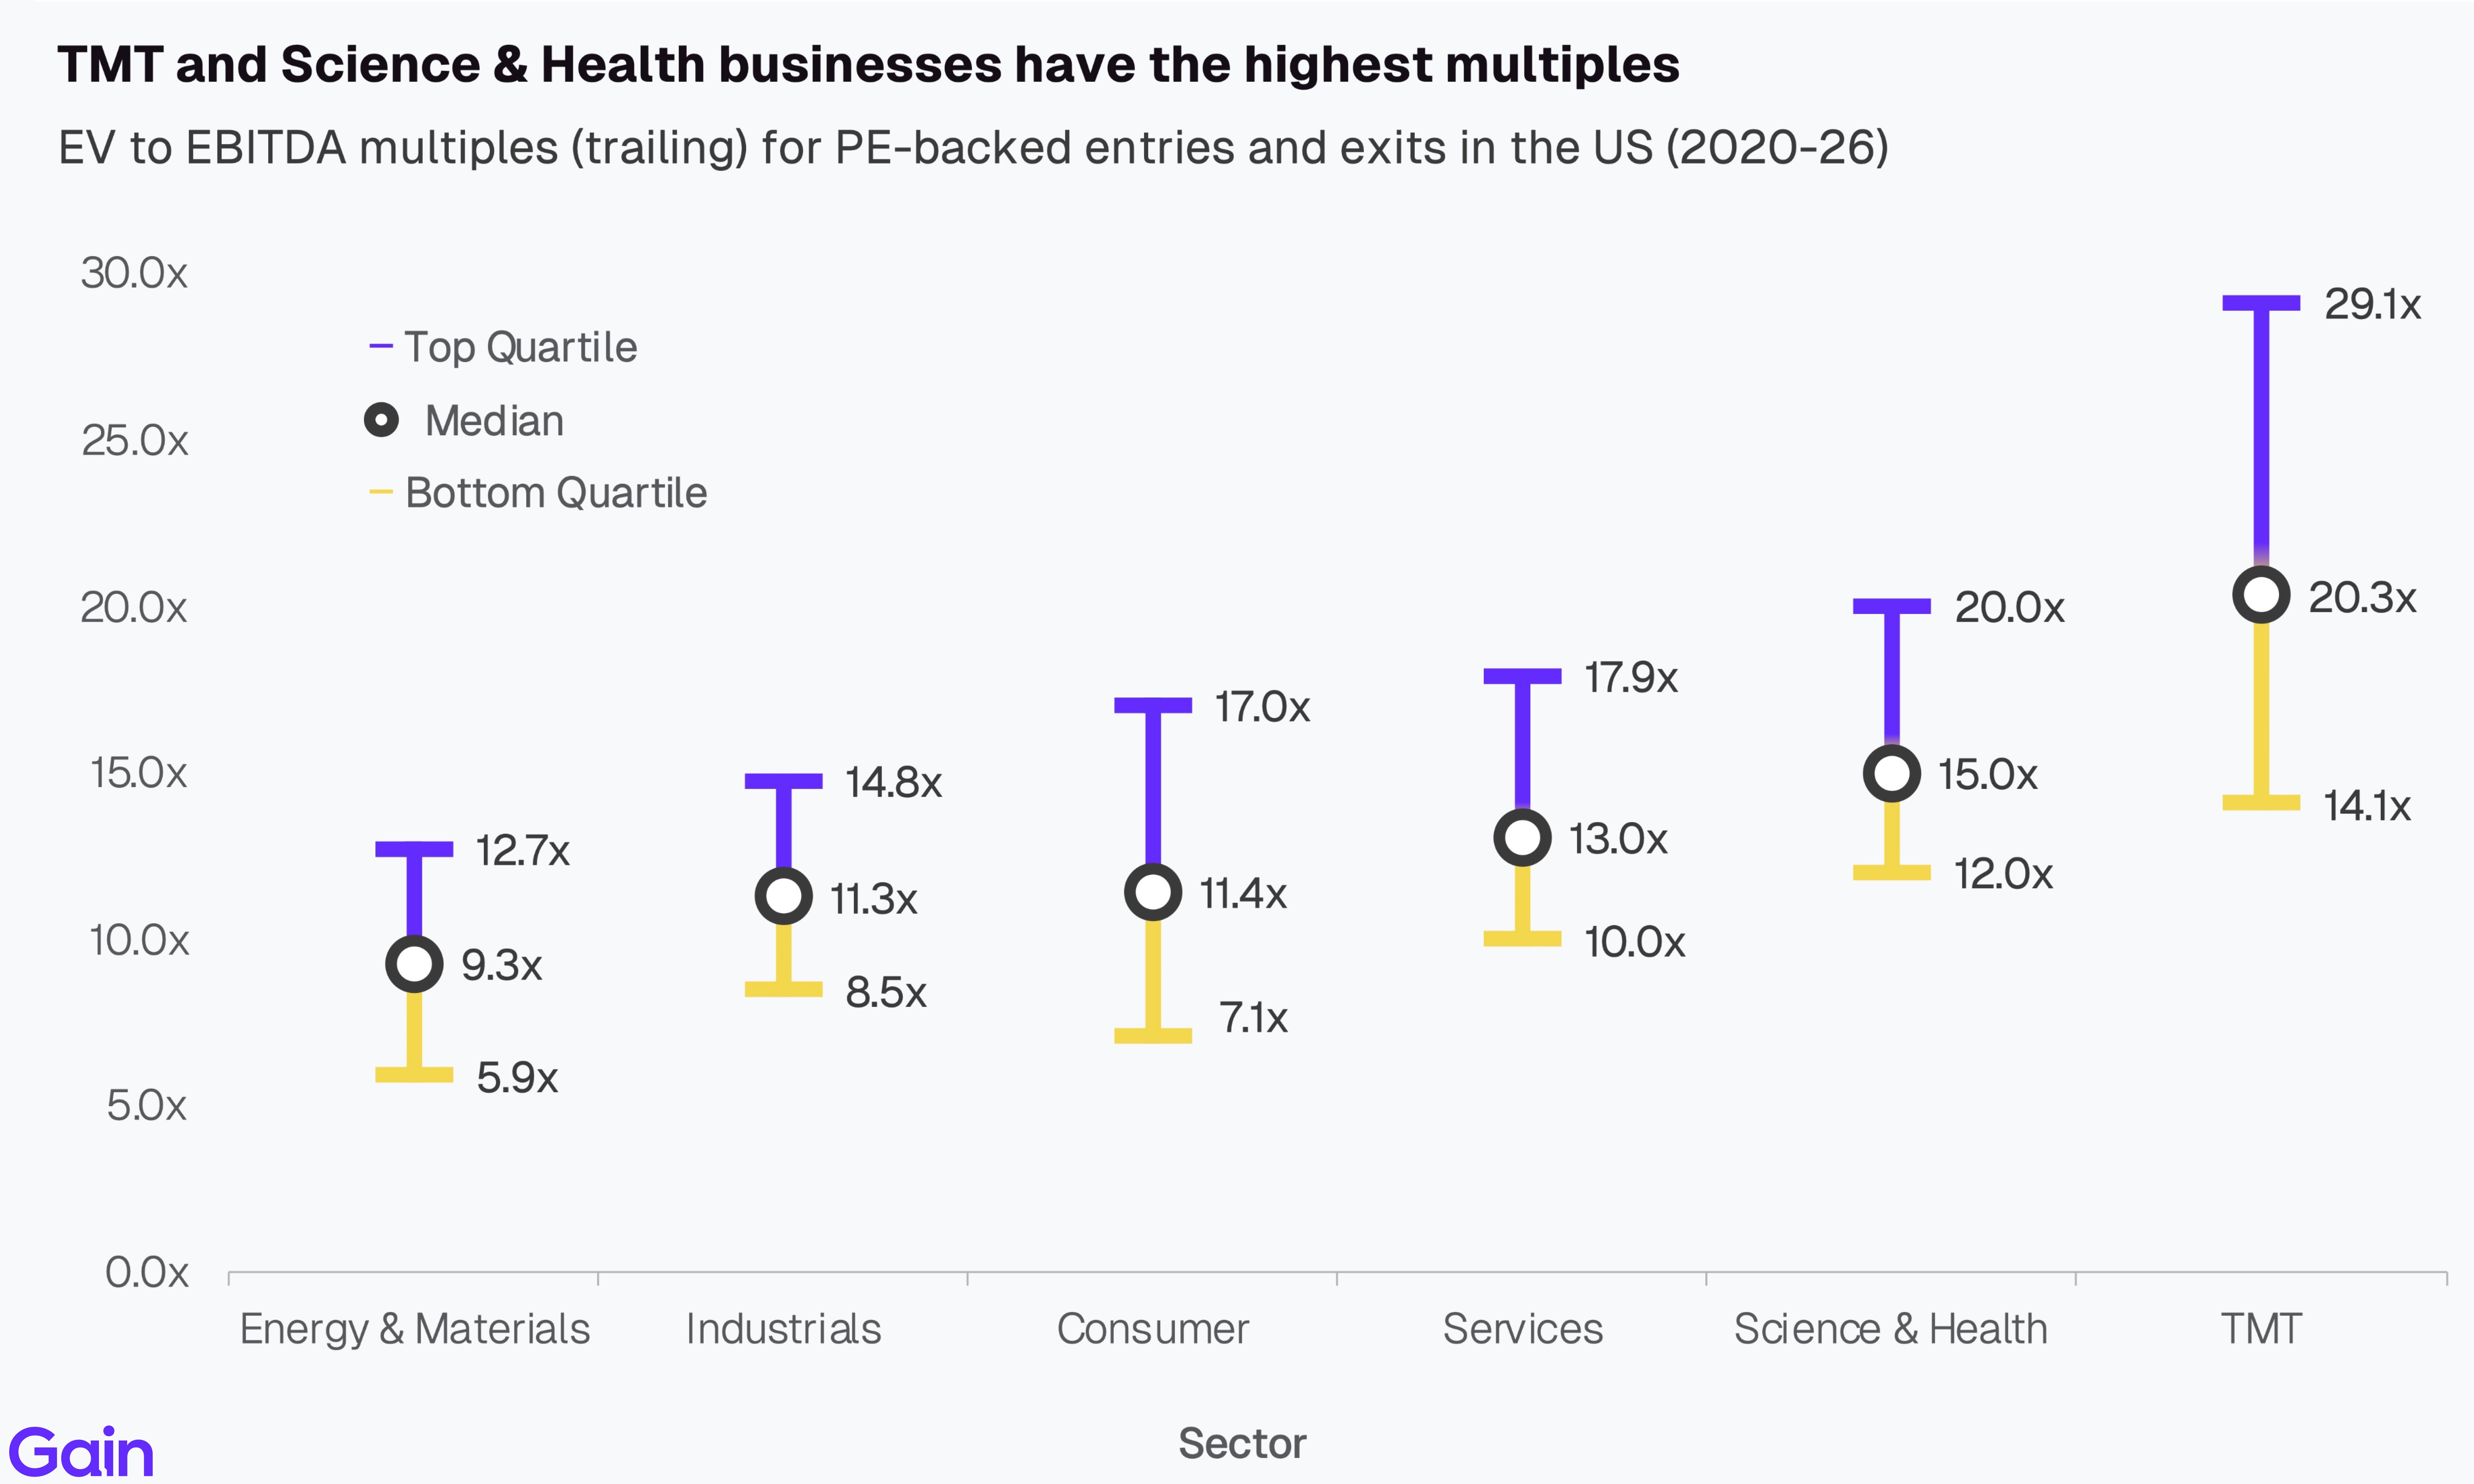
By sector, TMT (20.3x) commands a healthy valuation premium over all other sectors. This is supported by the sector's strong growth profile and higher margins. However, given the price action in public markets, we expect downward pressure on the sector's multiples going forward. Broadly, Energy (9.3x), Industrials (11.3x) and Consumer (11.4x) trade at lower multiples than the market, reflecting slower growth profiles and the more asset-heavy nature of these sectors.
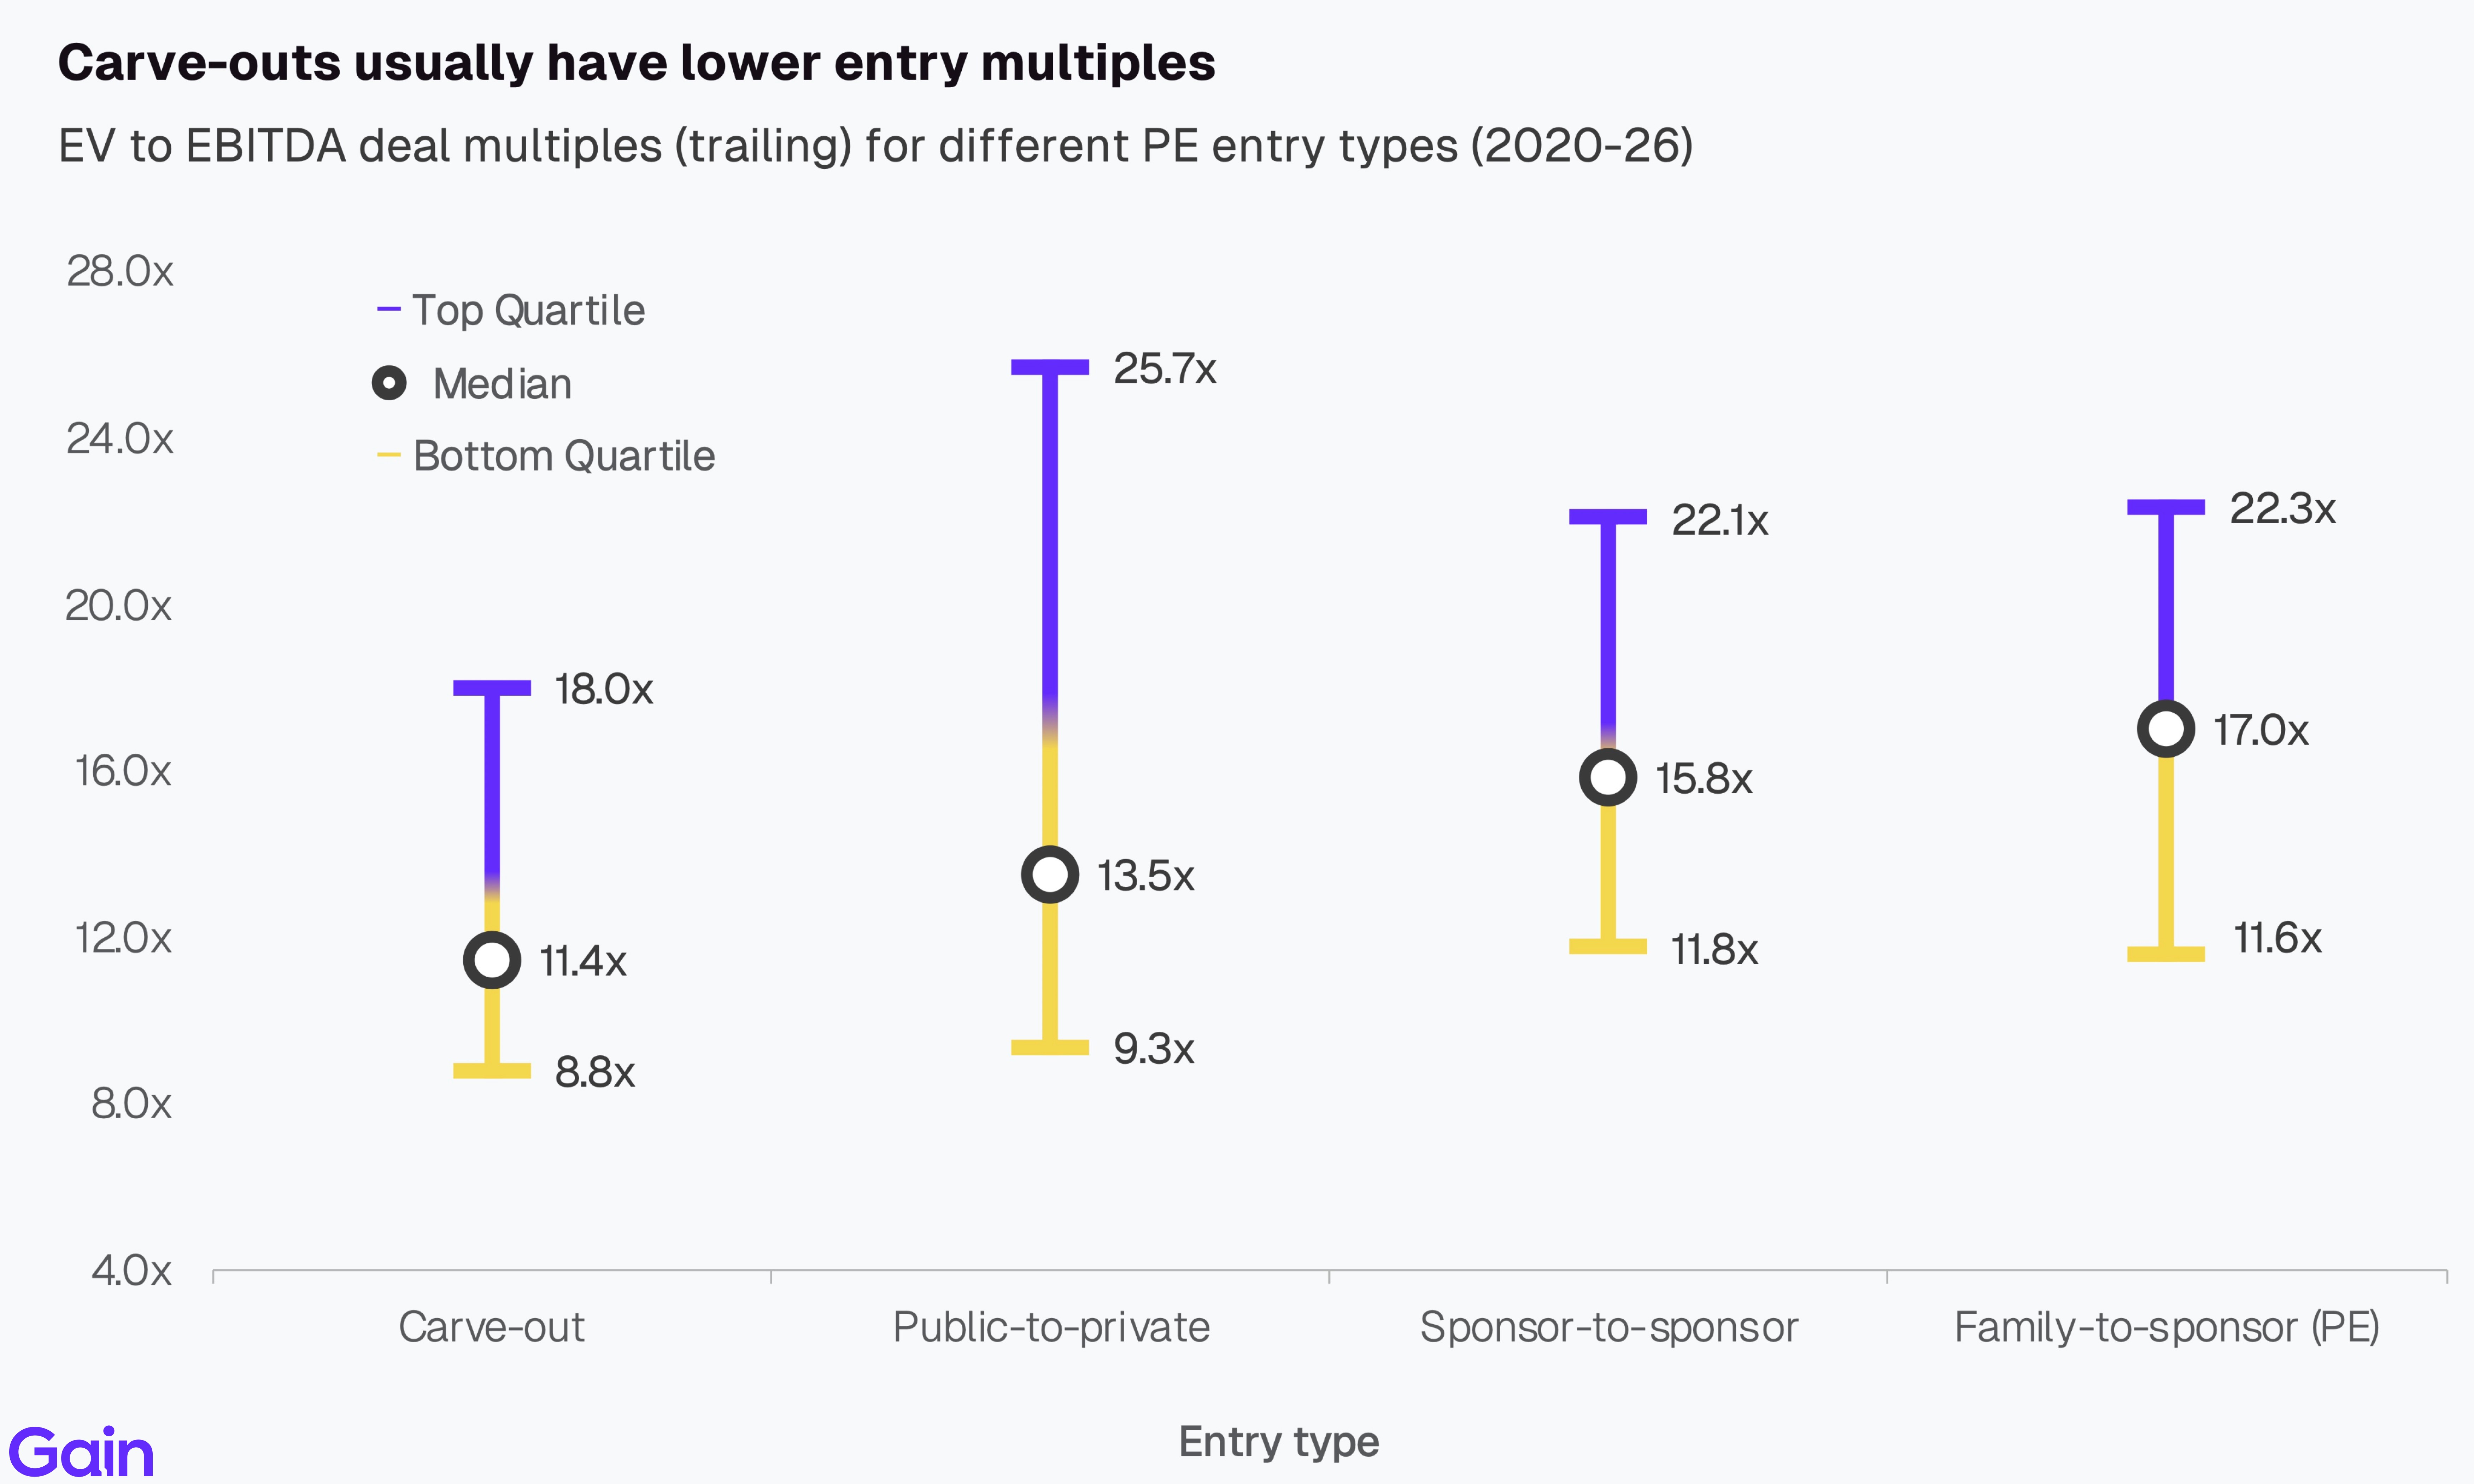
By entry type, carve-out deals have the lowest entry multiples (11.4x). These businesses tend to be underperforming and need investment to build up all support functions post-acquisition. In contrast, multiples are highest in family-to-sponsor (17.0x) and sponsor-to-sponsor deals (15.8x). Family-to-sponsor transactions often involve earlier-stage businesses with stronger growth profiles, while sponsor-to-sponsor deals are typically sold through competitive auction processes that drive up valuations.
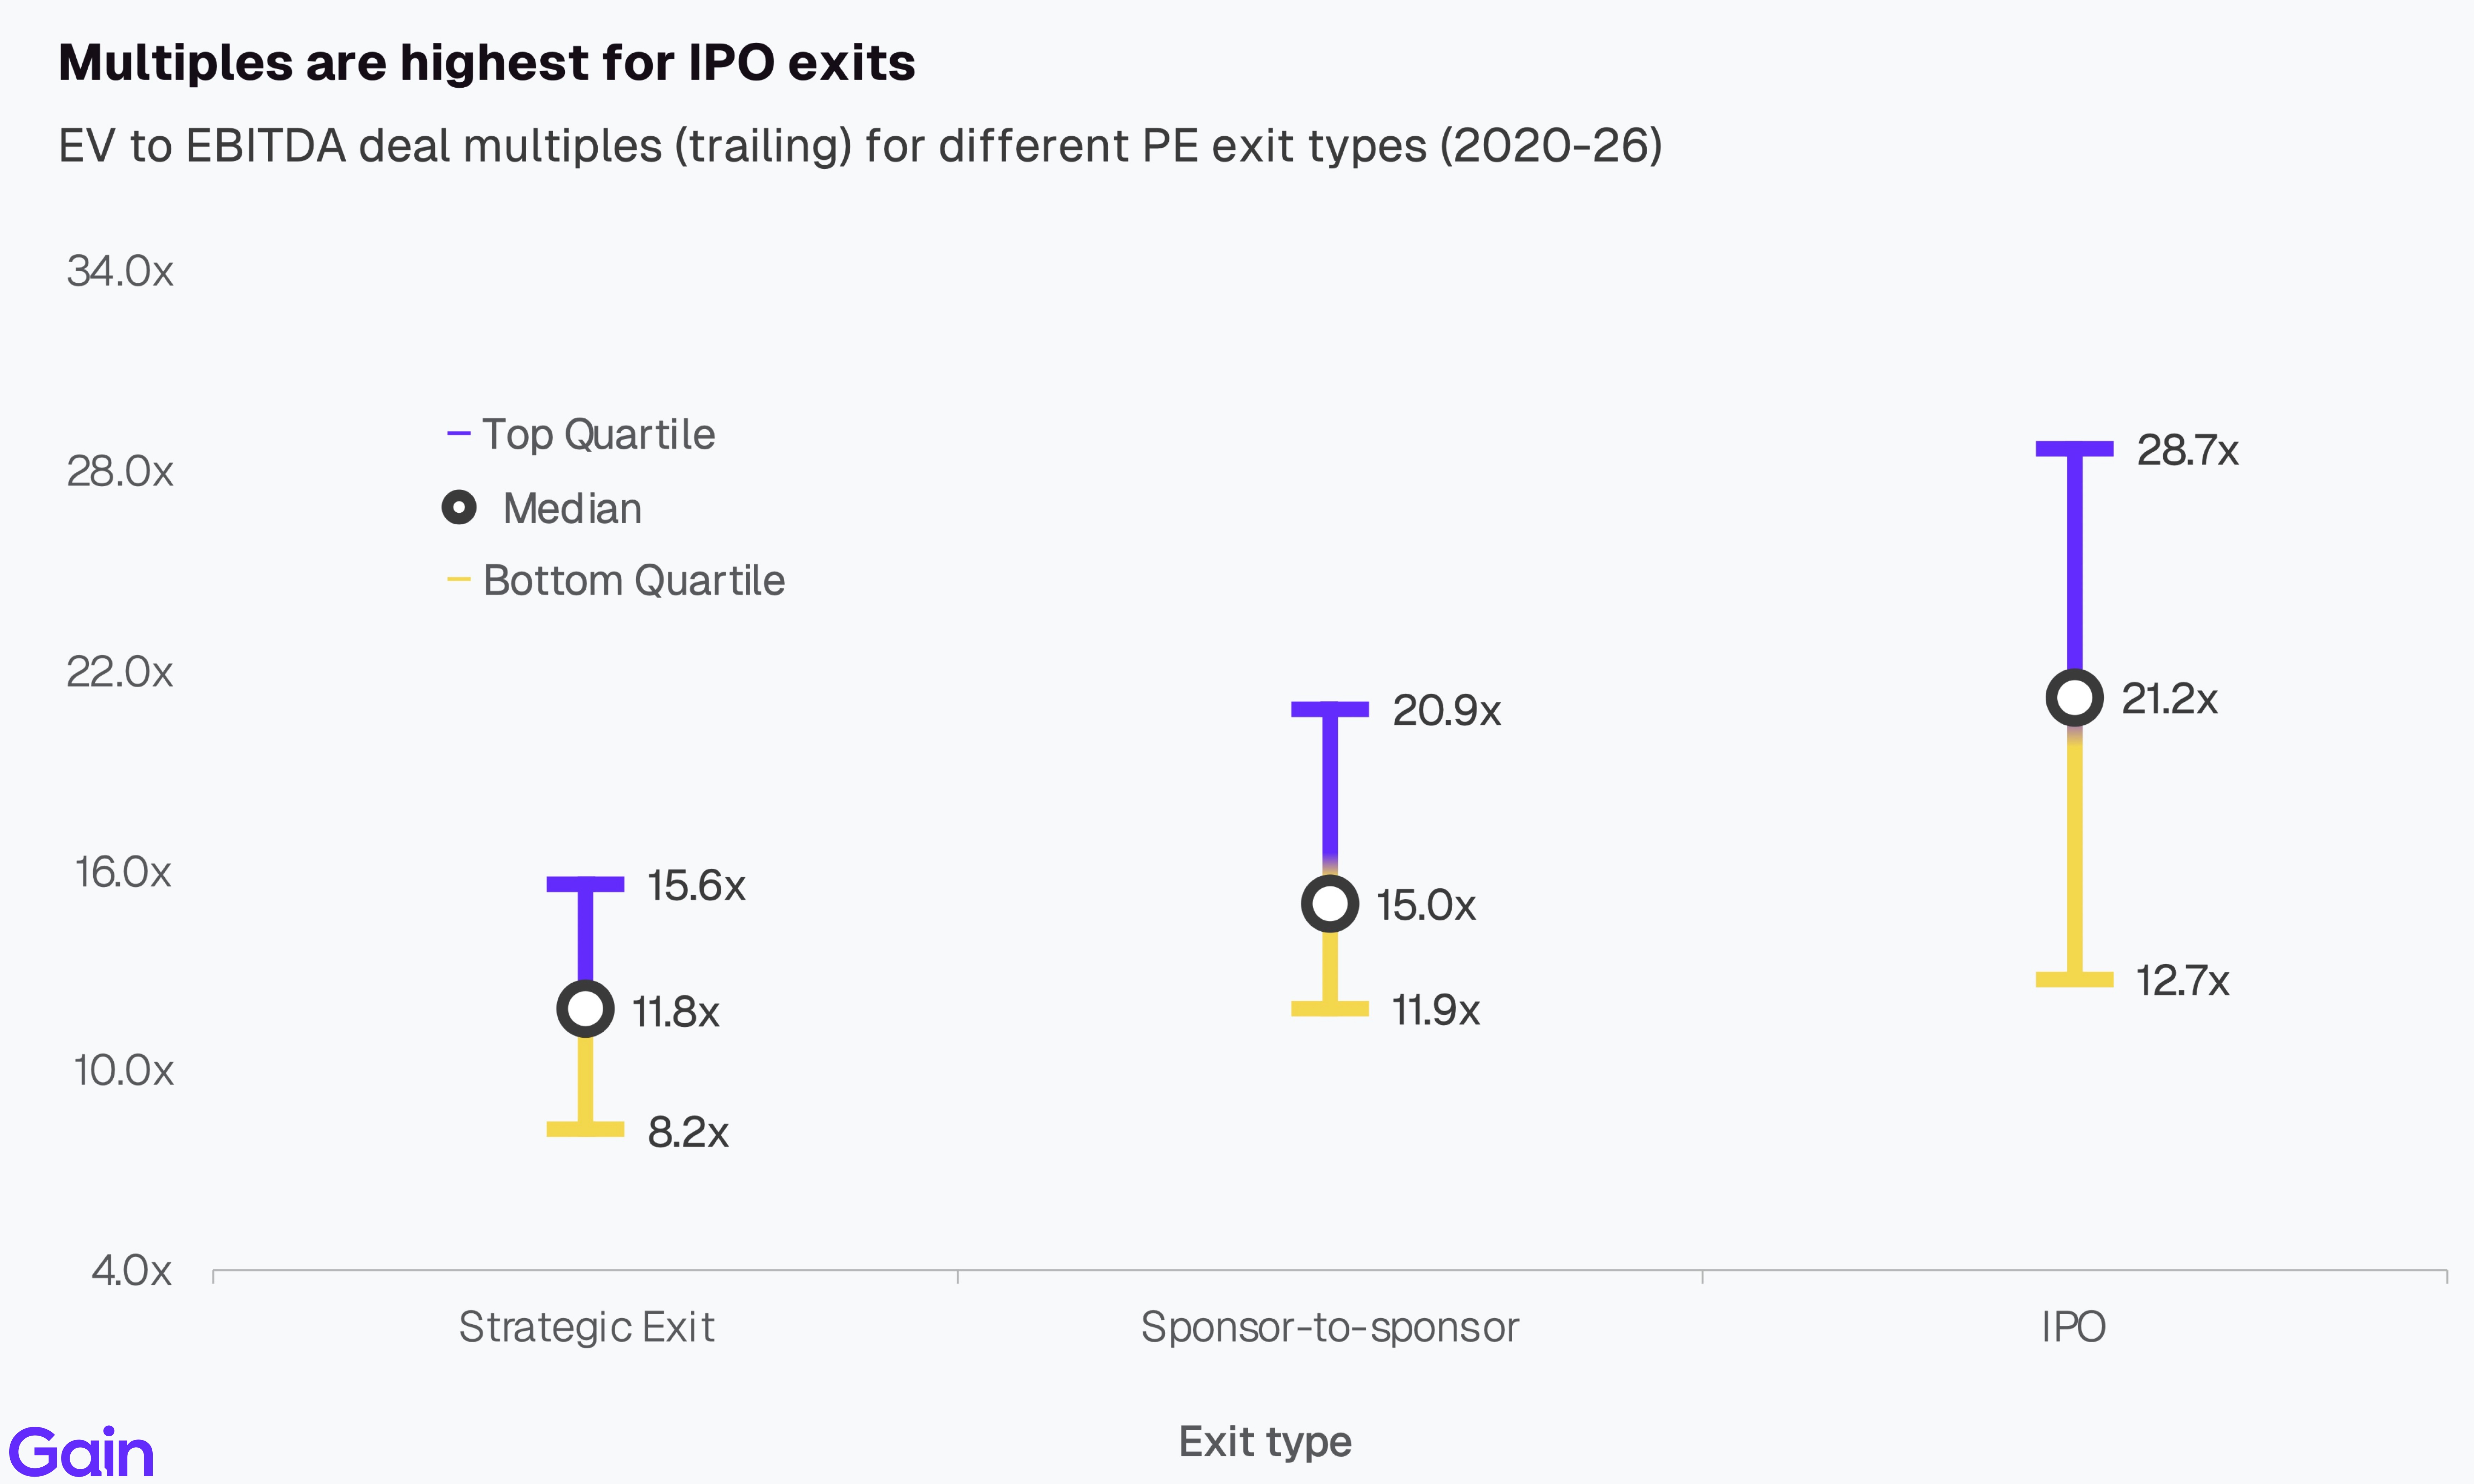
Multiples are highest for IPO exits (21.2x). IPOs command stronger valuations due to higher demand for faster-growing assets and interest from a broad investor base. The downside of IPOs, however, is that exits are rarely clean and PE sponsors typically cannot sell their full stake immediately while remaining exposed to ongoing share price volatility.
Employment
US PE-backed businesses employ 11.1 million people. By sector, Services (33%) and Consumer (19%) are the largest ones for employment, followed by Science & Health (18%) and TMT (13%). By state, California leads with 1.9m employees (17%), followed by Illinois (1.3m, 12%), Texas (1.1m, 10%), Florida (0.6m, 6%), and New York (0.6m, 5%), with the remaining 50% distributed across the rest of the US.
Methodology
The data for this report comes from Gain.
We define PE-backed entries as those in which a PE firm took a minority or majority stake. We define PE-backed exits as those in which a PE firm sold a minority or majority stake. We exclude any VC rounds from our analysis. Both entries and exits exclude aborted deals and add-ons.
We only focused our analysis on assets HQ’d in the US.
For deals without disclosed valuations, we estimate deal values using an EV/EBITDA multiple approach based on comparable transactions and company EBITDA. Deal values are also adjusted for the estimated ownership share of each deal.
We estimate the deal count for the last 4 quarters based on prior deal history and the percentage of deals that are announced or added post-quarter close.
Our historical data might change as we add and update new deals to the platform.
For metric calculations, we only included assets that had a hand-curated profile on Gain (10+ hours of primary research). Where possible, we have used 2025 and last reported metrics. But in cases where numbers are still being reported, we have relied on metrics from previous years.
All EBITDA-related aggregates such as EBITDA margin and EV/EBITDA multiples exclude Financial Services from calculations.