
H2 2026
The State of European Private Equity Report

Executive Summary
In this report, we go deep into the PE landscape in Europe. We share insights on entries, exits, multiples, add-ons, holding periods, growth rates, margins and much more. Here is a summary of our key findings:
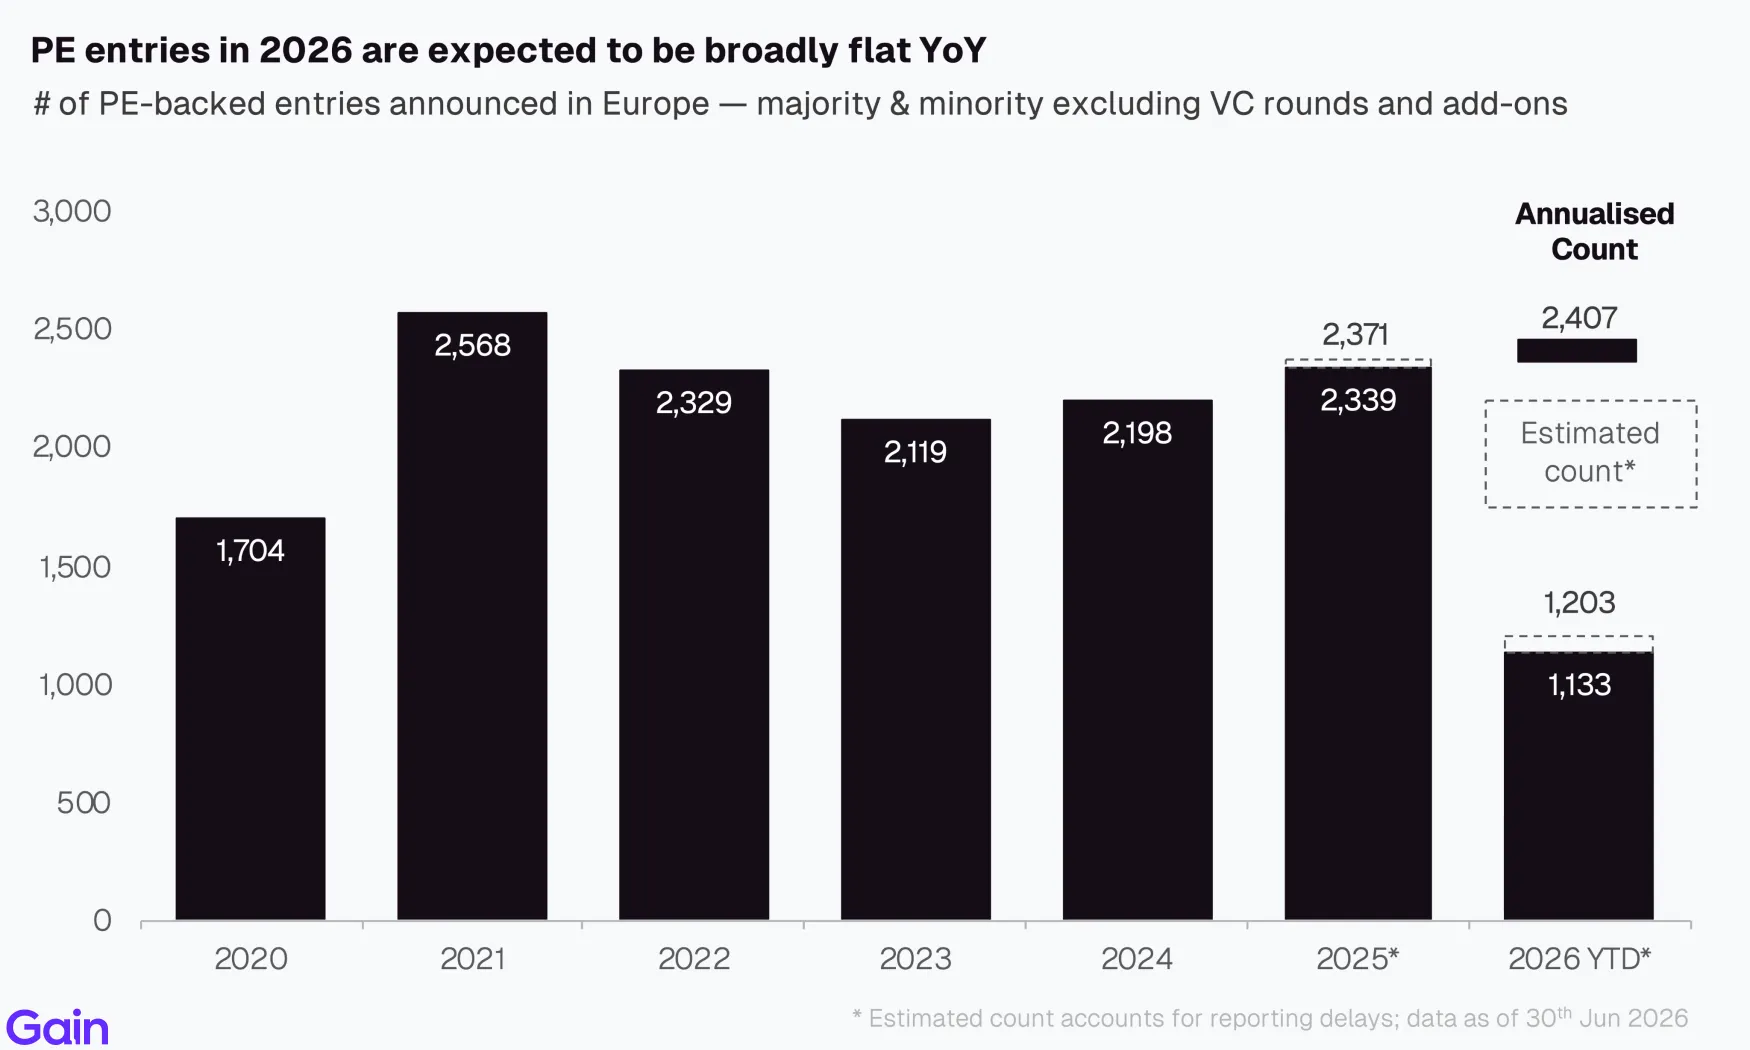
Entry activity in H1 2026 moderated from H2 2025 levels, amid geopolitical uncertainty. Annualised trends point to a broadly flat trajectory (+2%) for 2026. Services continued to attract the highest share of entries, while entries remain weak in Consumer and Healthcare.
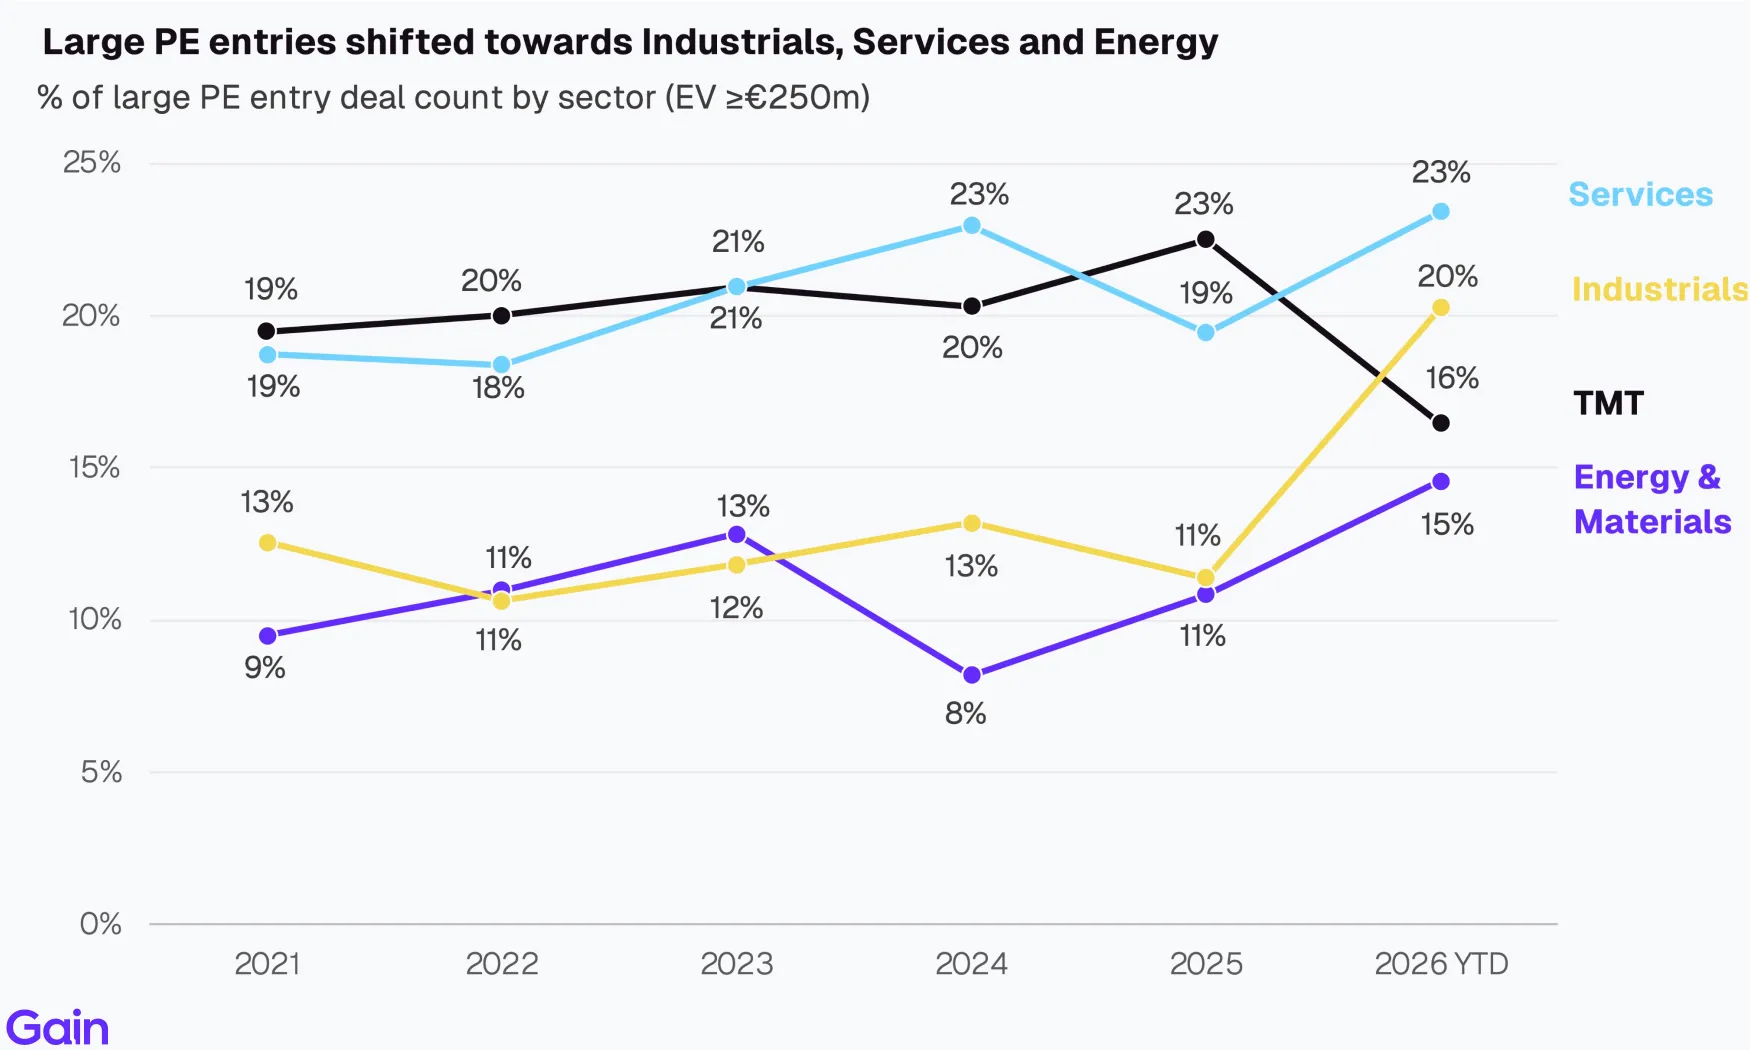
€1B+ transactions remained the primary driver of entry and exit deal value. Within large PE entries, investor preferences shifted towards Industrials, Services and Energy.
Exit activity softened more sharply than entries in H1 2026. Exits were particularly challenging in DACH, Benelux and Nordics markets, while Industrials and Consumer saw the slowest pace of exits.
Holding periods continued to increase to 5.8 years in 2026, extending a multi-year upward trend. One-third of PE assets have now been held for more than seven years, with Consumer and the Nordics exhibiting the longest holding periods.
Software PE deal activity fell to its lowest level since 2020. AI-related uncertainty remains a key overhang as investors assess whether it will expand software markets or disrupt incumbent business models.
Add-on share of total deals remained flat in 2026. Integration challenges, elevated financing costs, and narrowing multiple arbitrage opportunities moderated the pace of consolidation.
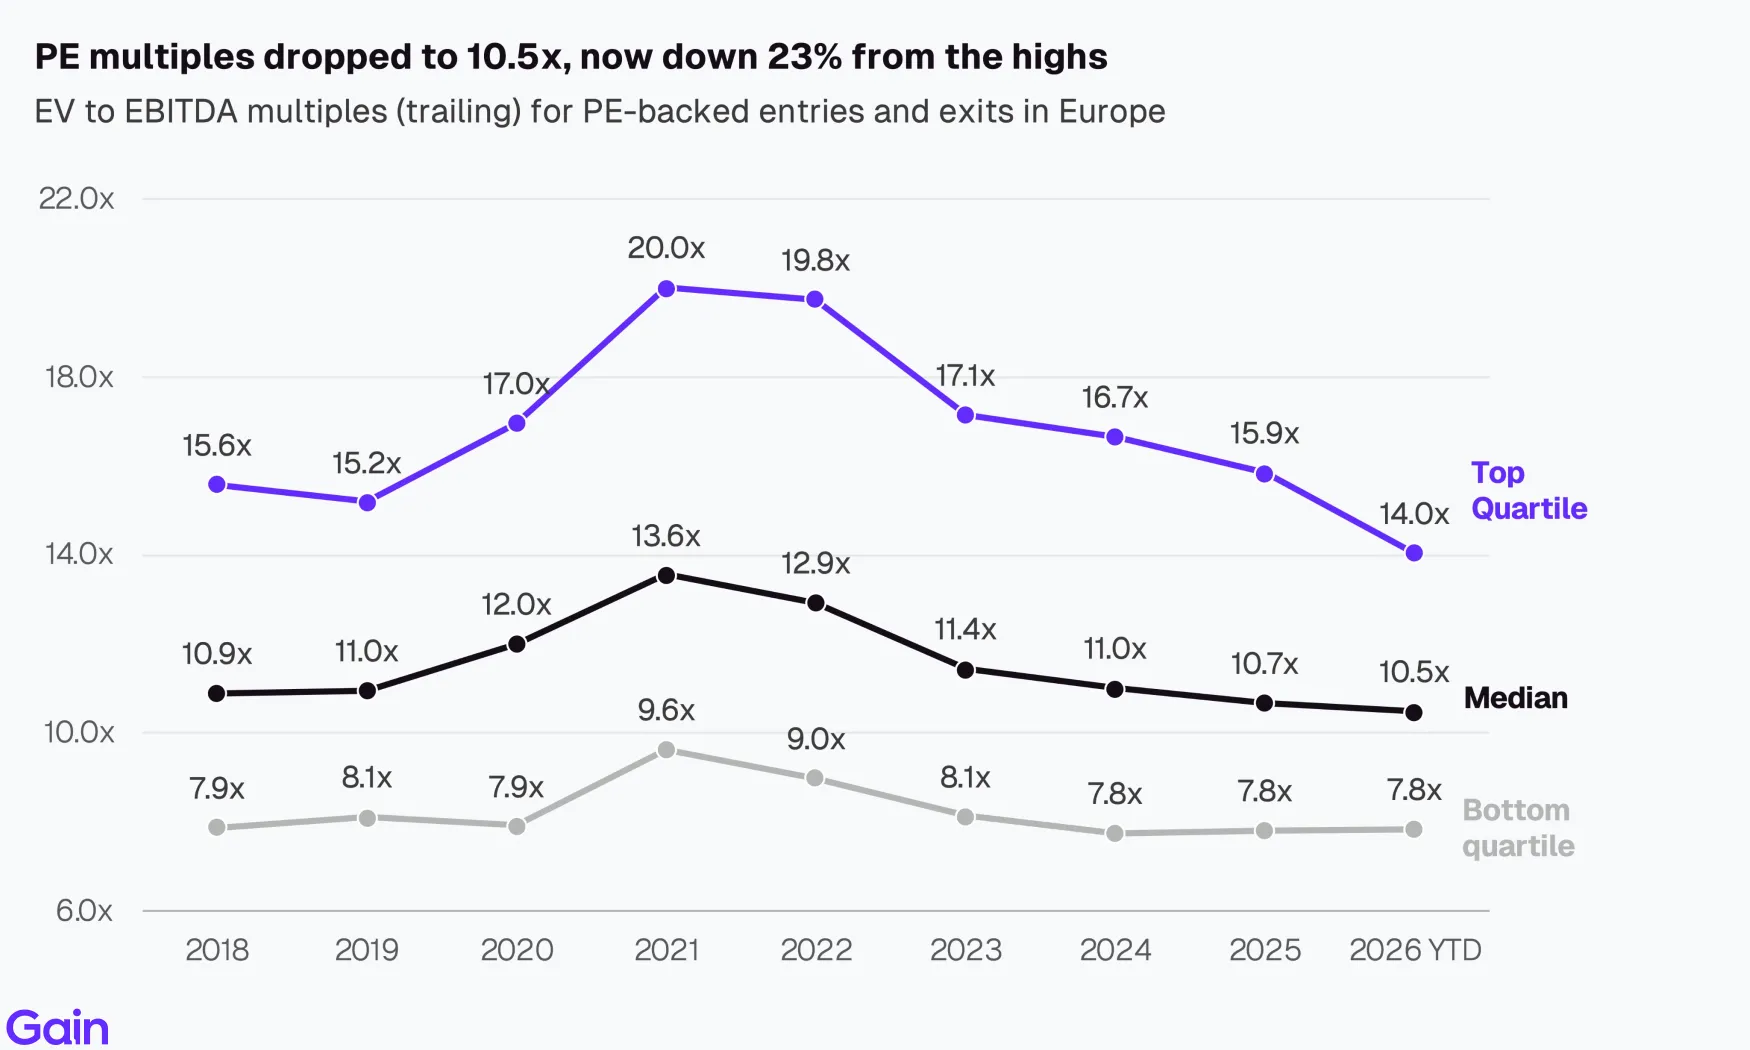
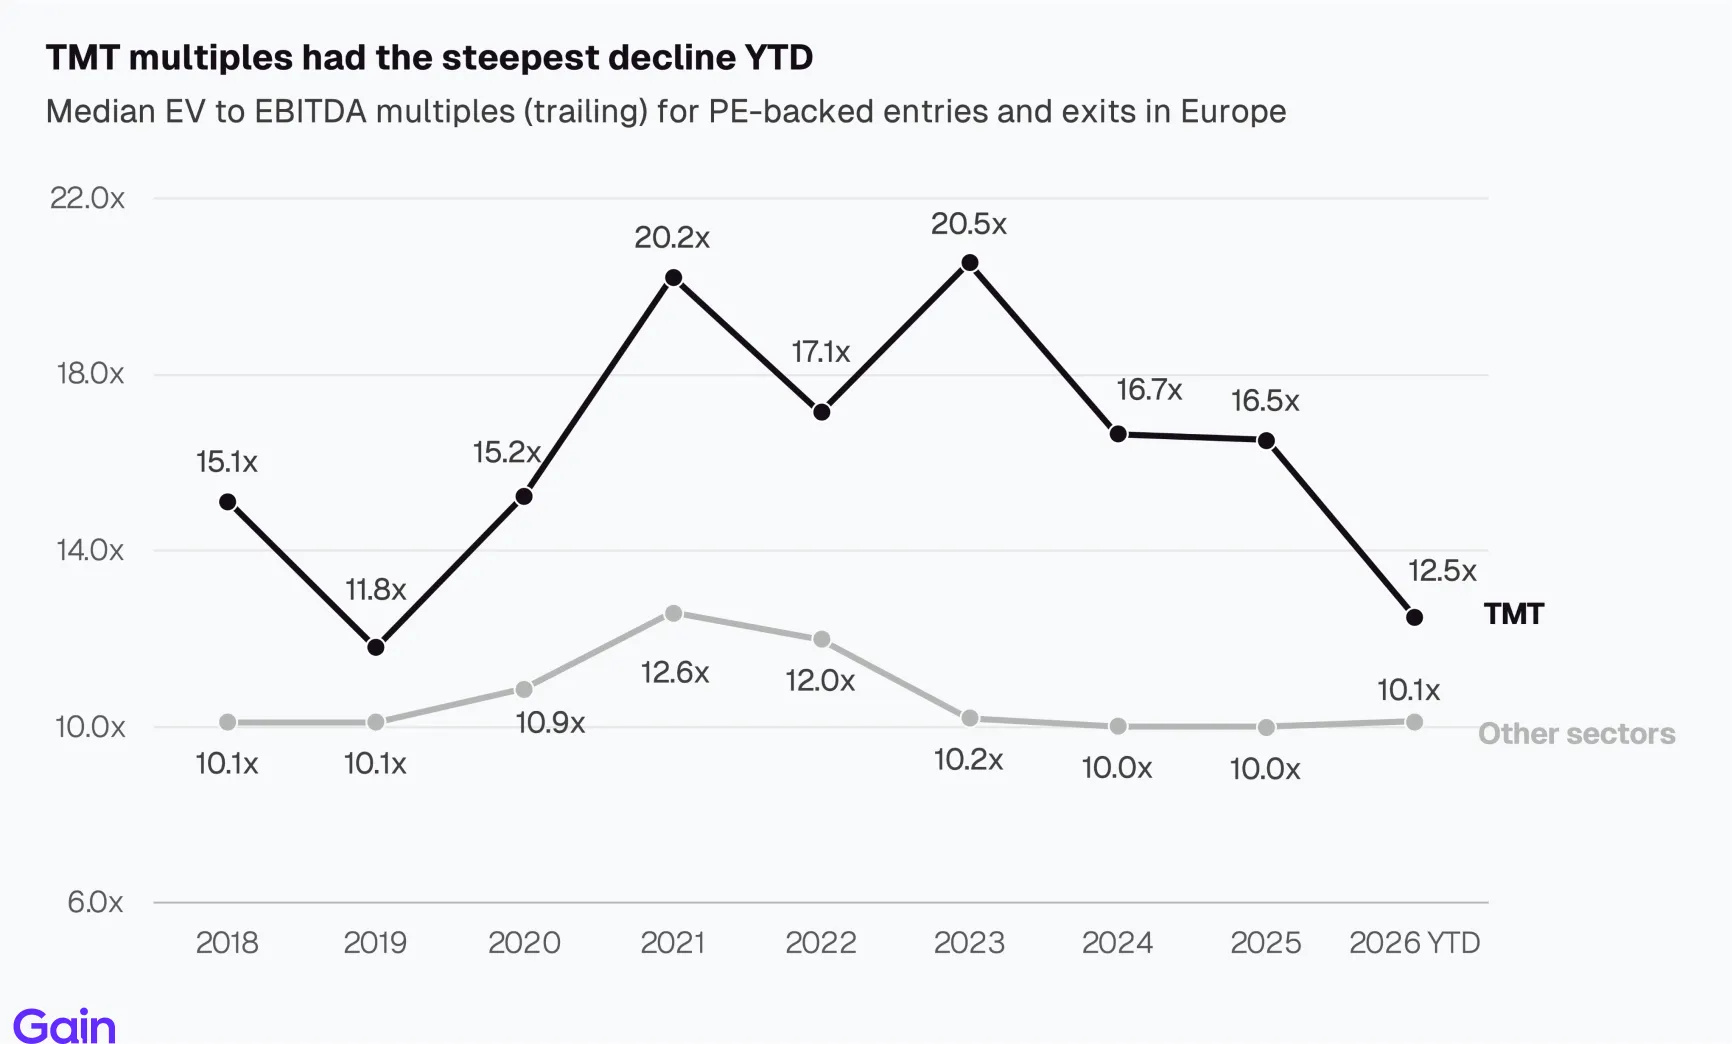
Multiples flatlined in 2026 (median of 10.5x). TMT recorded the sharpest valuation decline, while other sector multiples remained stable. Revenue growth for PE-backed assets rebounded from 2024 levels.
If you have any questions about the data or the report, do not hesitate to reach out to insights@gain.ai.



Chapter 01: Entries
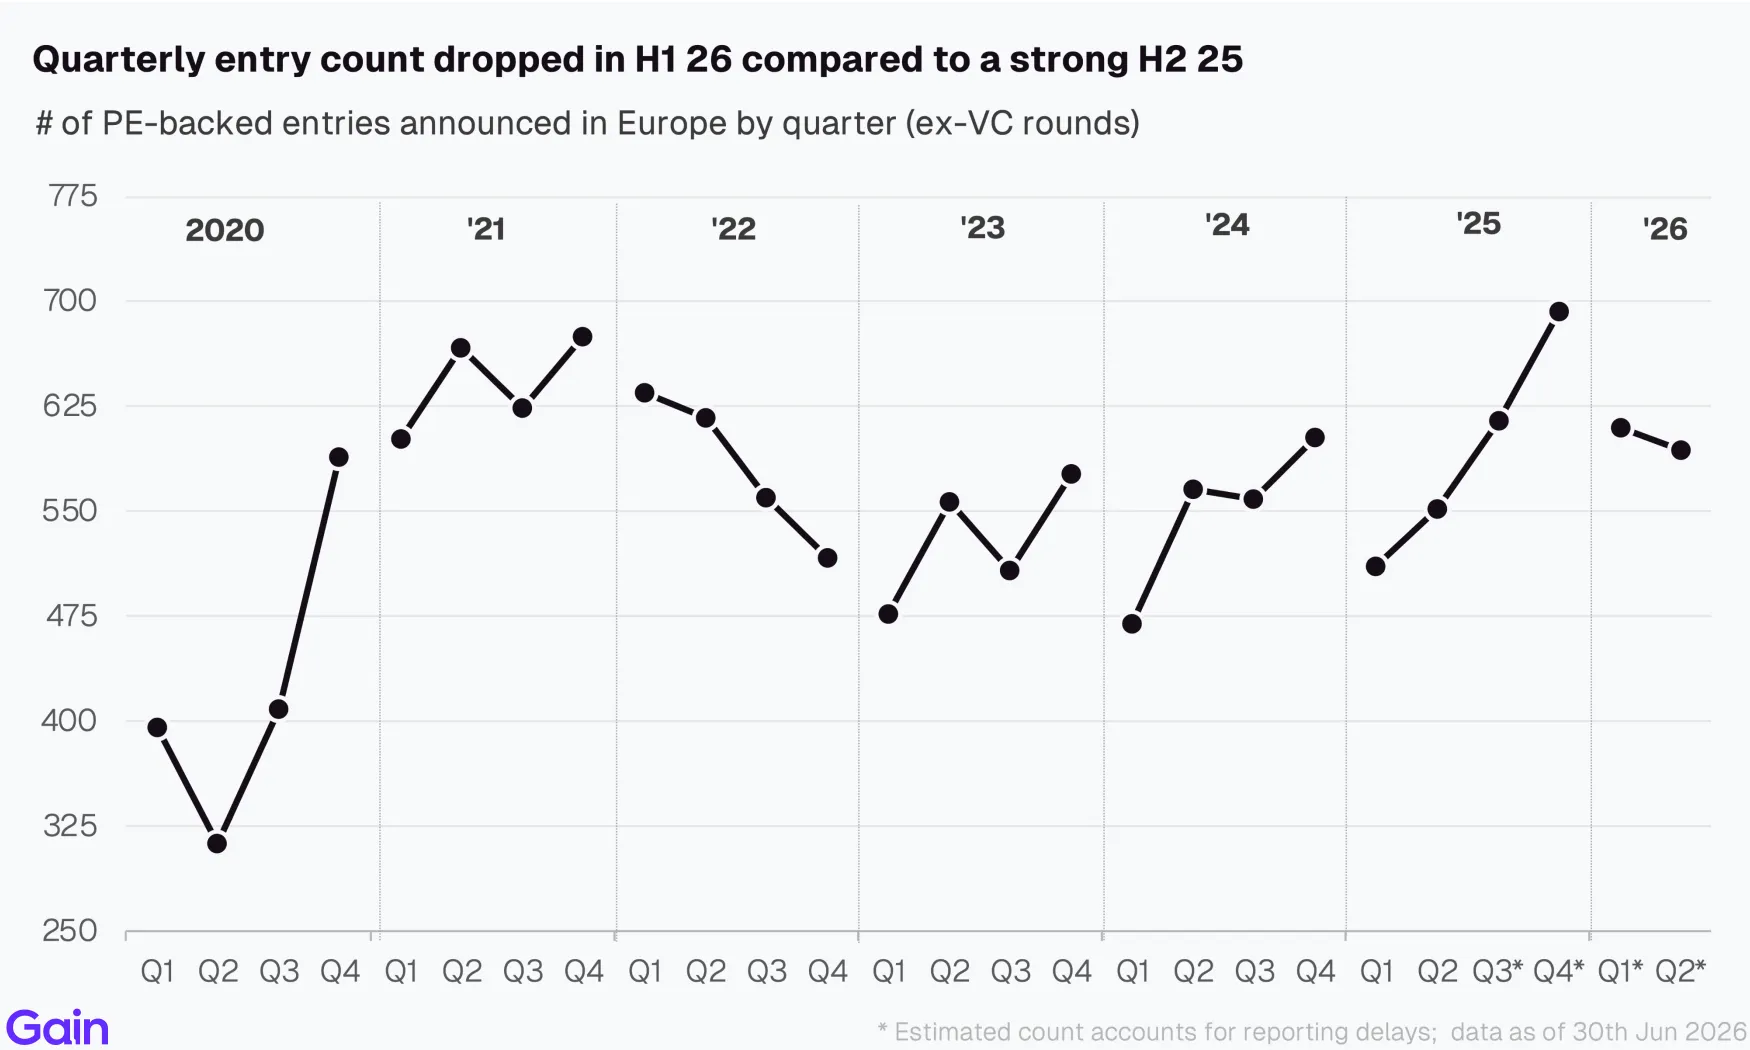
Annualised PE entry activity in Europe points to a broadly flat trend for 2026 (+2% YoY). Following a strong H2 2025, geopolitical uncertainty weighed on H1 2026 dealmaking, with quarterly entries declining 12% QoQ in Q1 and a further 3% in Q2.
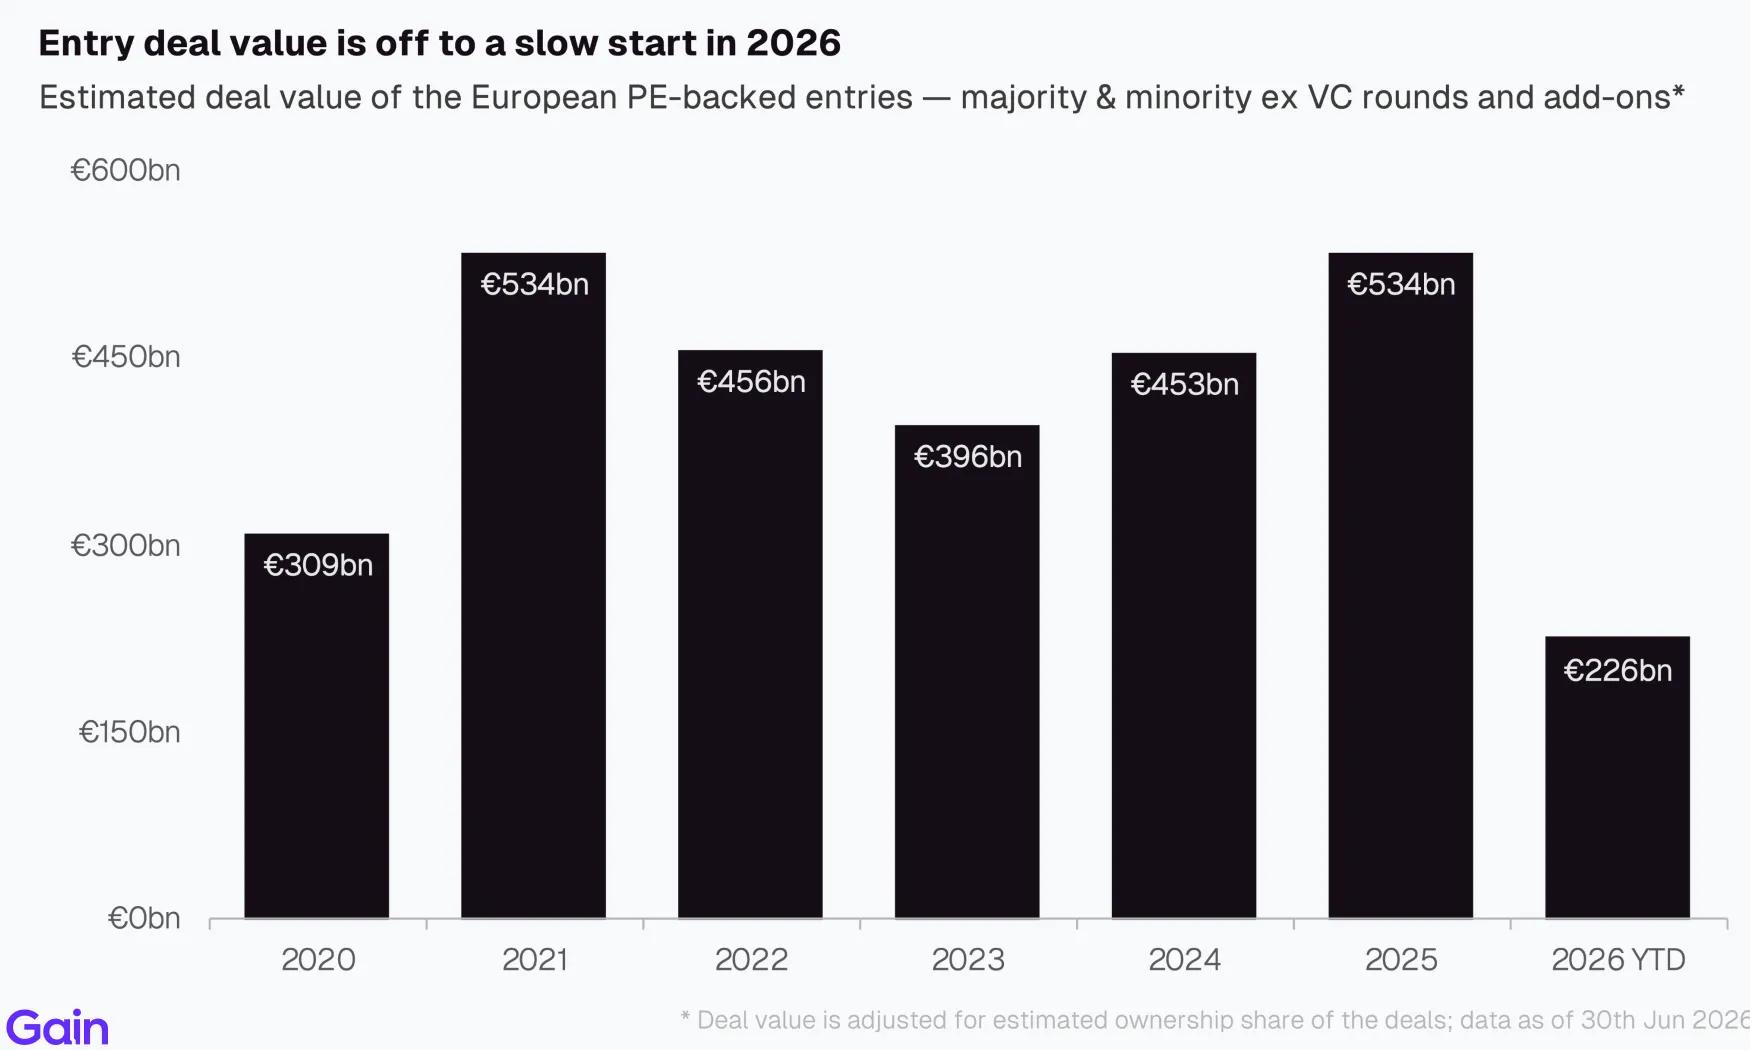
Entry deal value is off to a slow start in 2026. Following a record year for deal value in 2025, deal value dropped in H1 2026. A significant pickup in H2 2026 will be needed to match last year's levels.
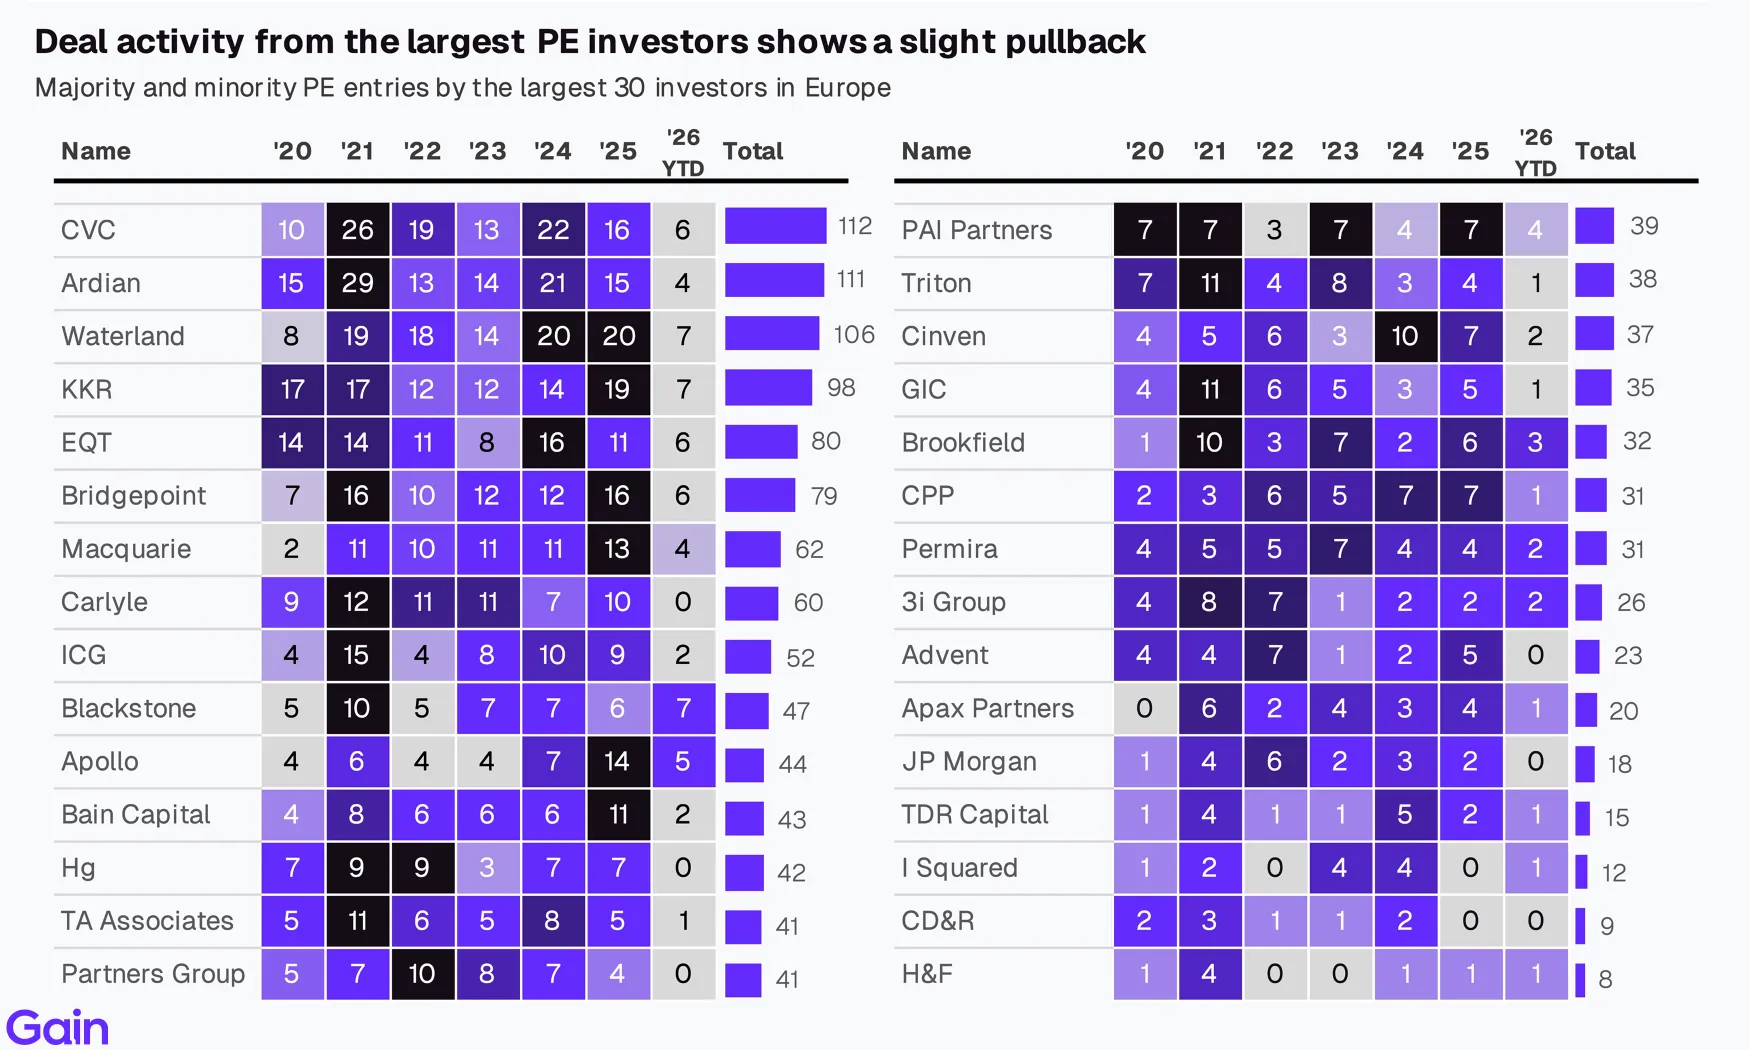
PE entry activity from the largest PE investors shows a slight pullback. Investors continue to remain cautious amid geopolitical uncertainty and elevated financing costs.
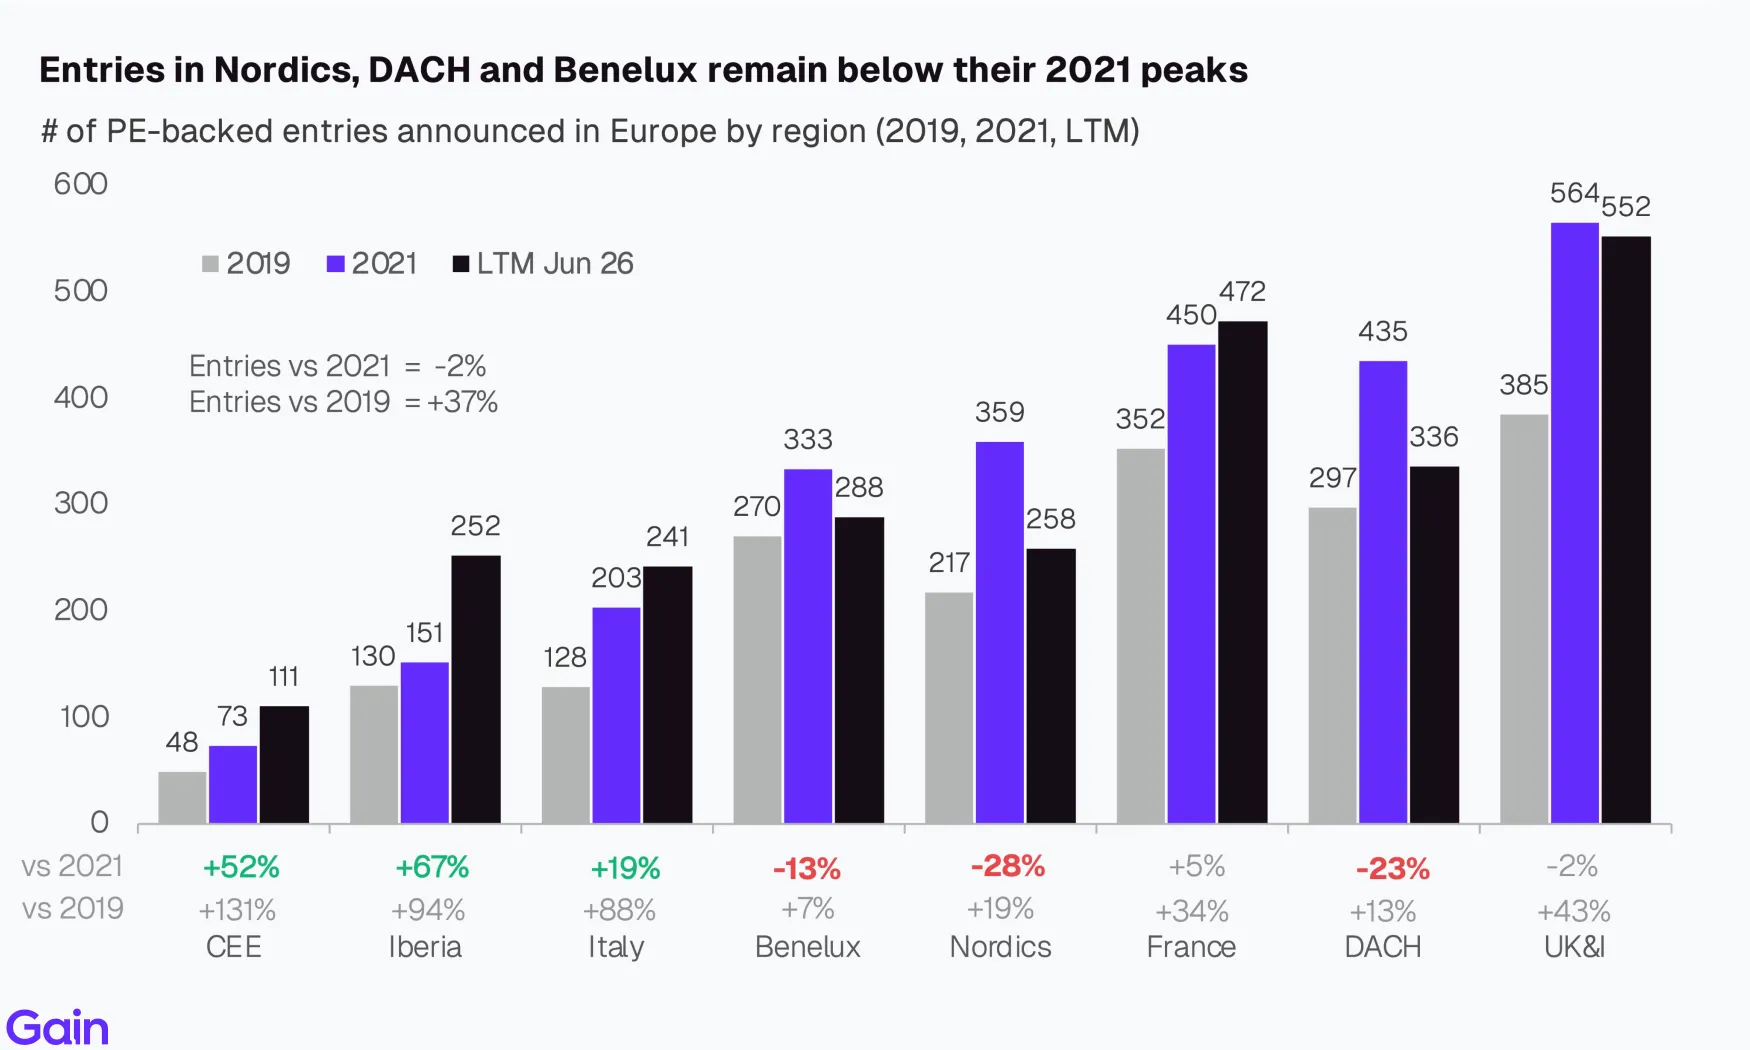
Science & Health (-23%) and Consumer (-16%) entries remain below 2021 peak levels. Slower growth and margin pressure continue to weigh on Consumer deal activity. Science & Health has been constrained by regulatory uncertainty, particularly in Germany. In contrast, Energy & Materials (+10%) has outperformed.

Large PE entries shifted towards Industrials (+9pp), Services (+4pp) and Energy (+4pp). AI-driven Energy investments, alongside stronger Services and Industrials activity, shifted the sector mix away from TMT.
Software PE deal activity fell to its lowest level since 2020. AI-related uncertainty remains a key overhang as investors assess whether it will expand software markets or disrupt incumbent business models.

Entries in the Nordics (-28%), DACH (-23%) and Benelux (-13%) remain well below their 2021 peaks. In contrast, Southern Europe and CEE continue to outperform, with entry activity remaining well above 2021 levels.
Chapter 02: Exits
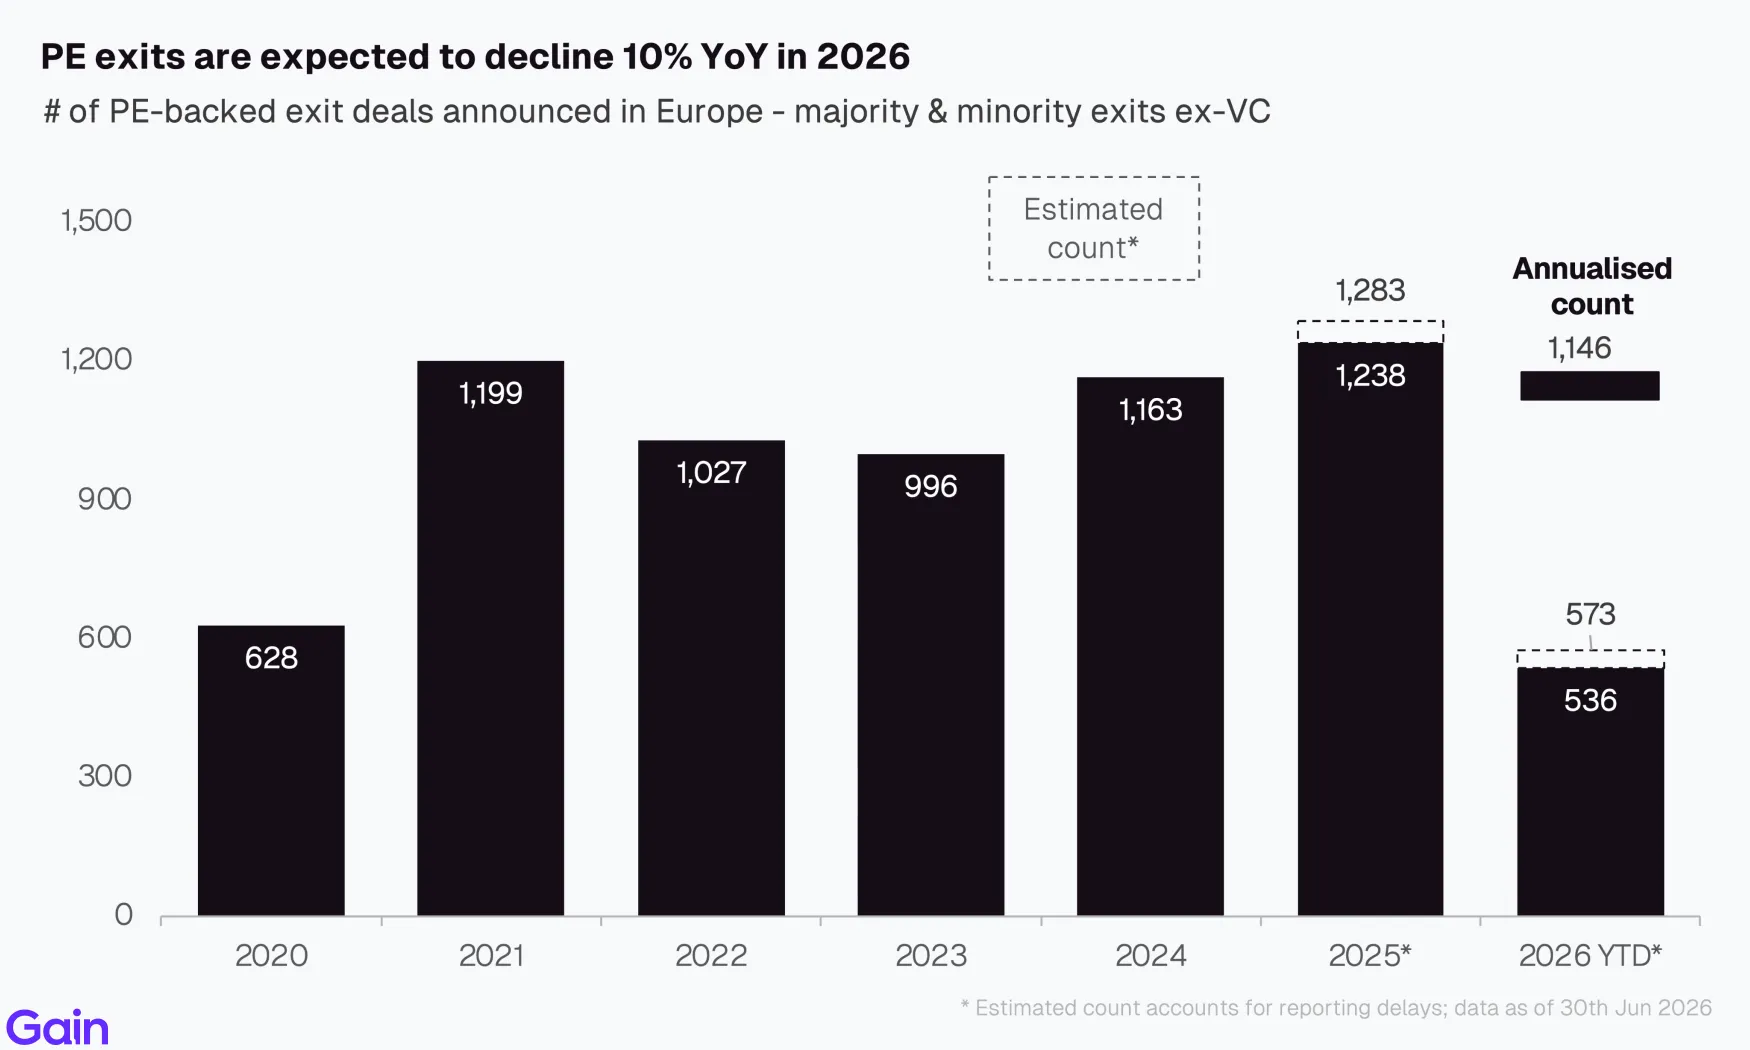
We expect PE exit activity in 2026 to decline 10% year-over-year. Exit activity softened more sharply than entries in H1, with quarterly exits declining -23% QoQ in Q1 and a further -6% in Q2, as sponsors continued to defer exits amid uncertain market conditions.
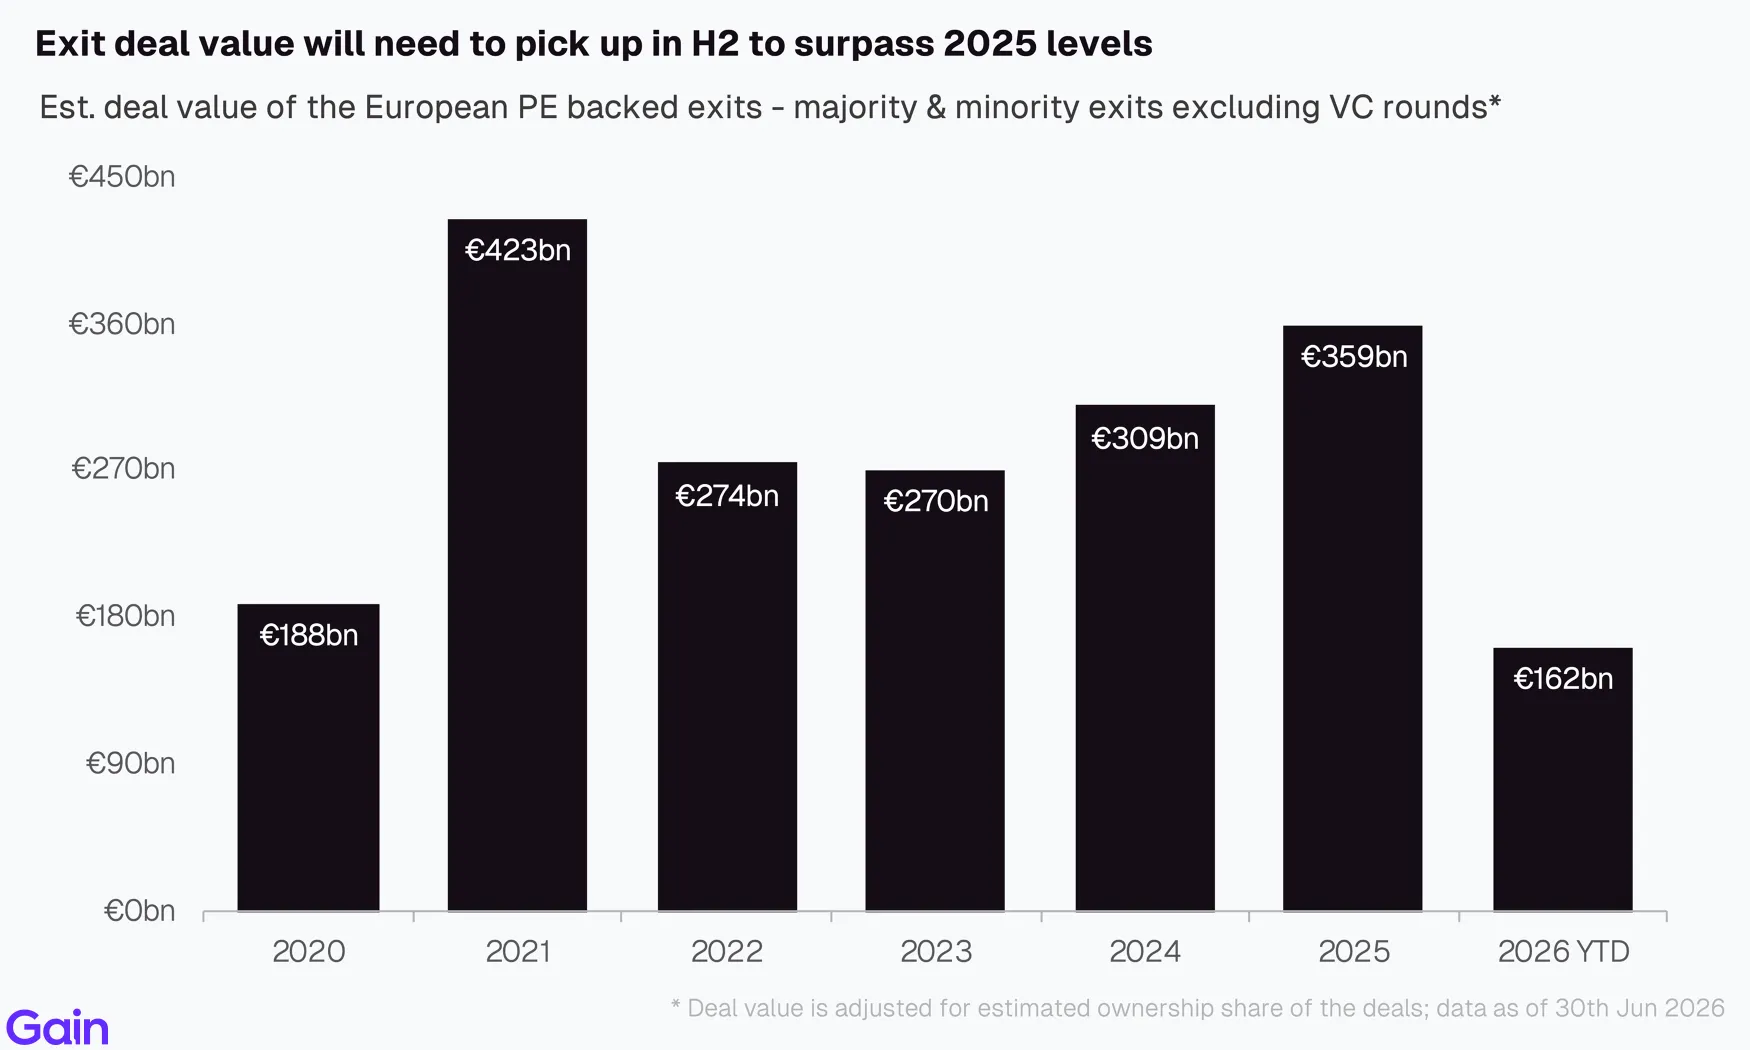
Exit deal value moderated in H1 2026 following a strong rebound in 2025. A significantly stronger H2 will be required to match or exceed last year's deal value.
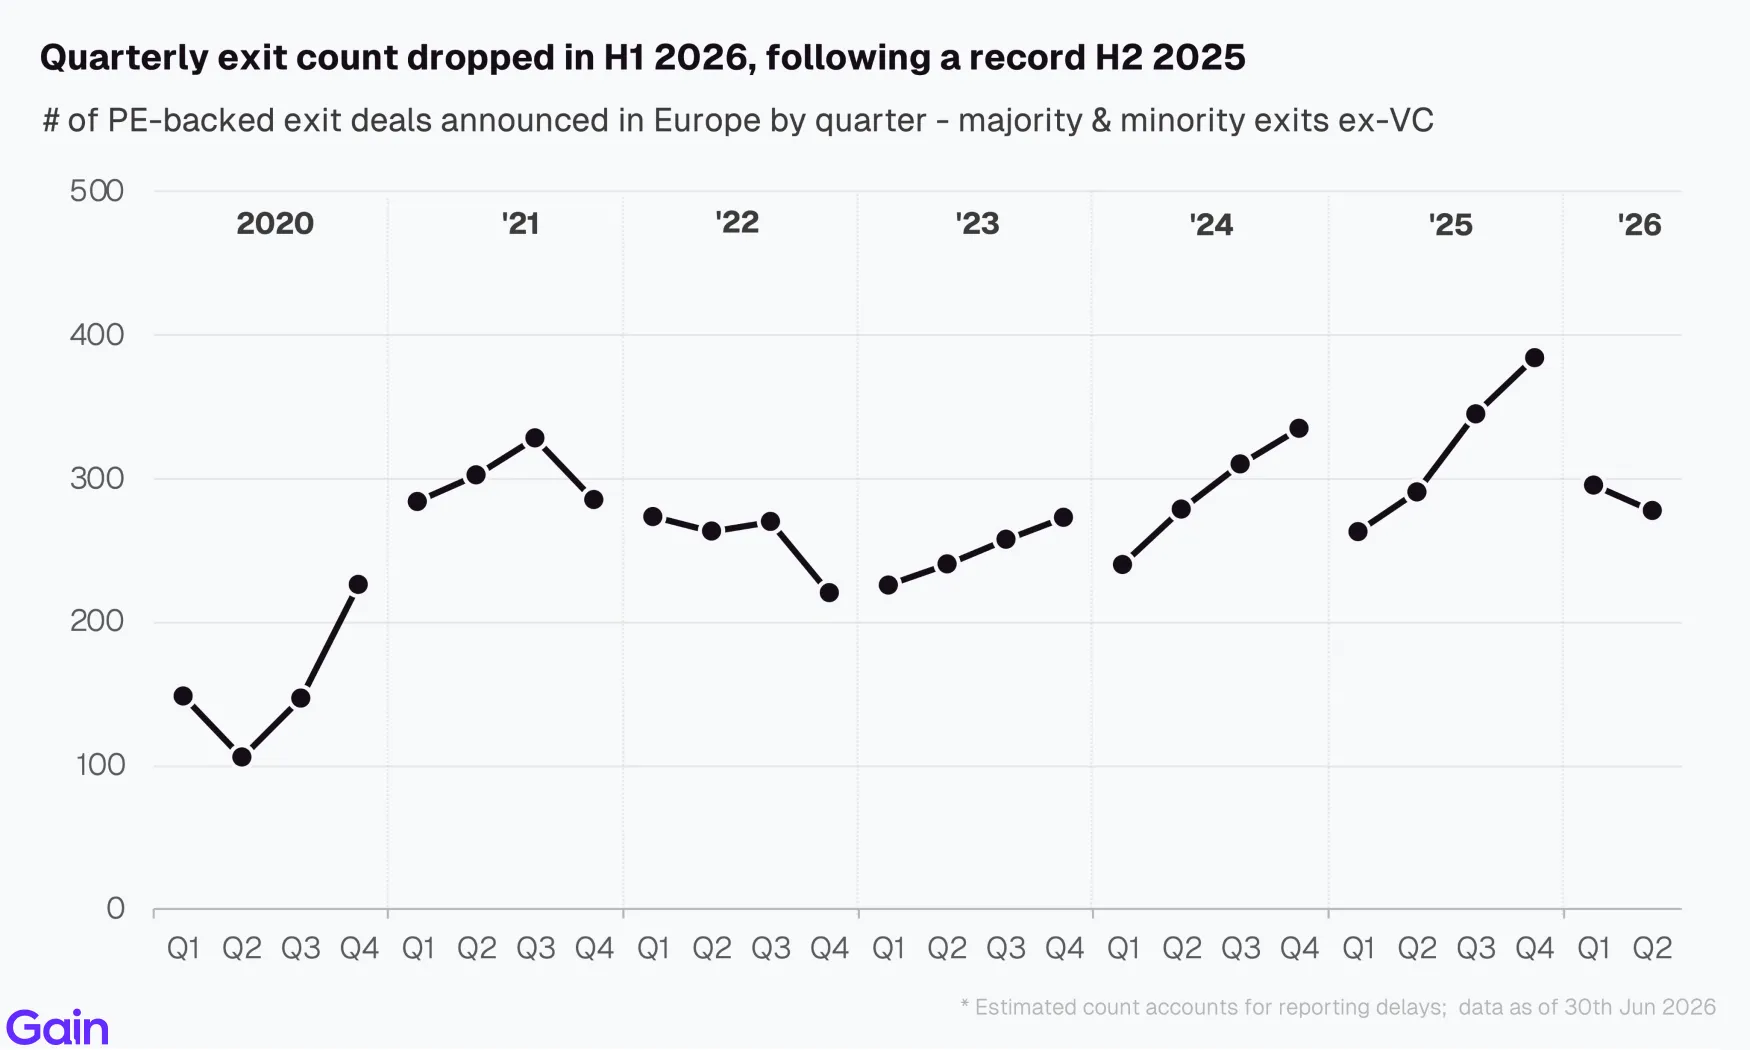
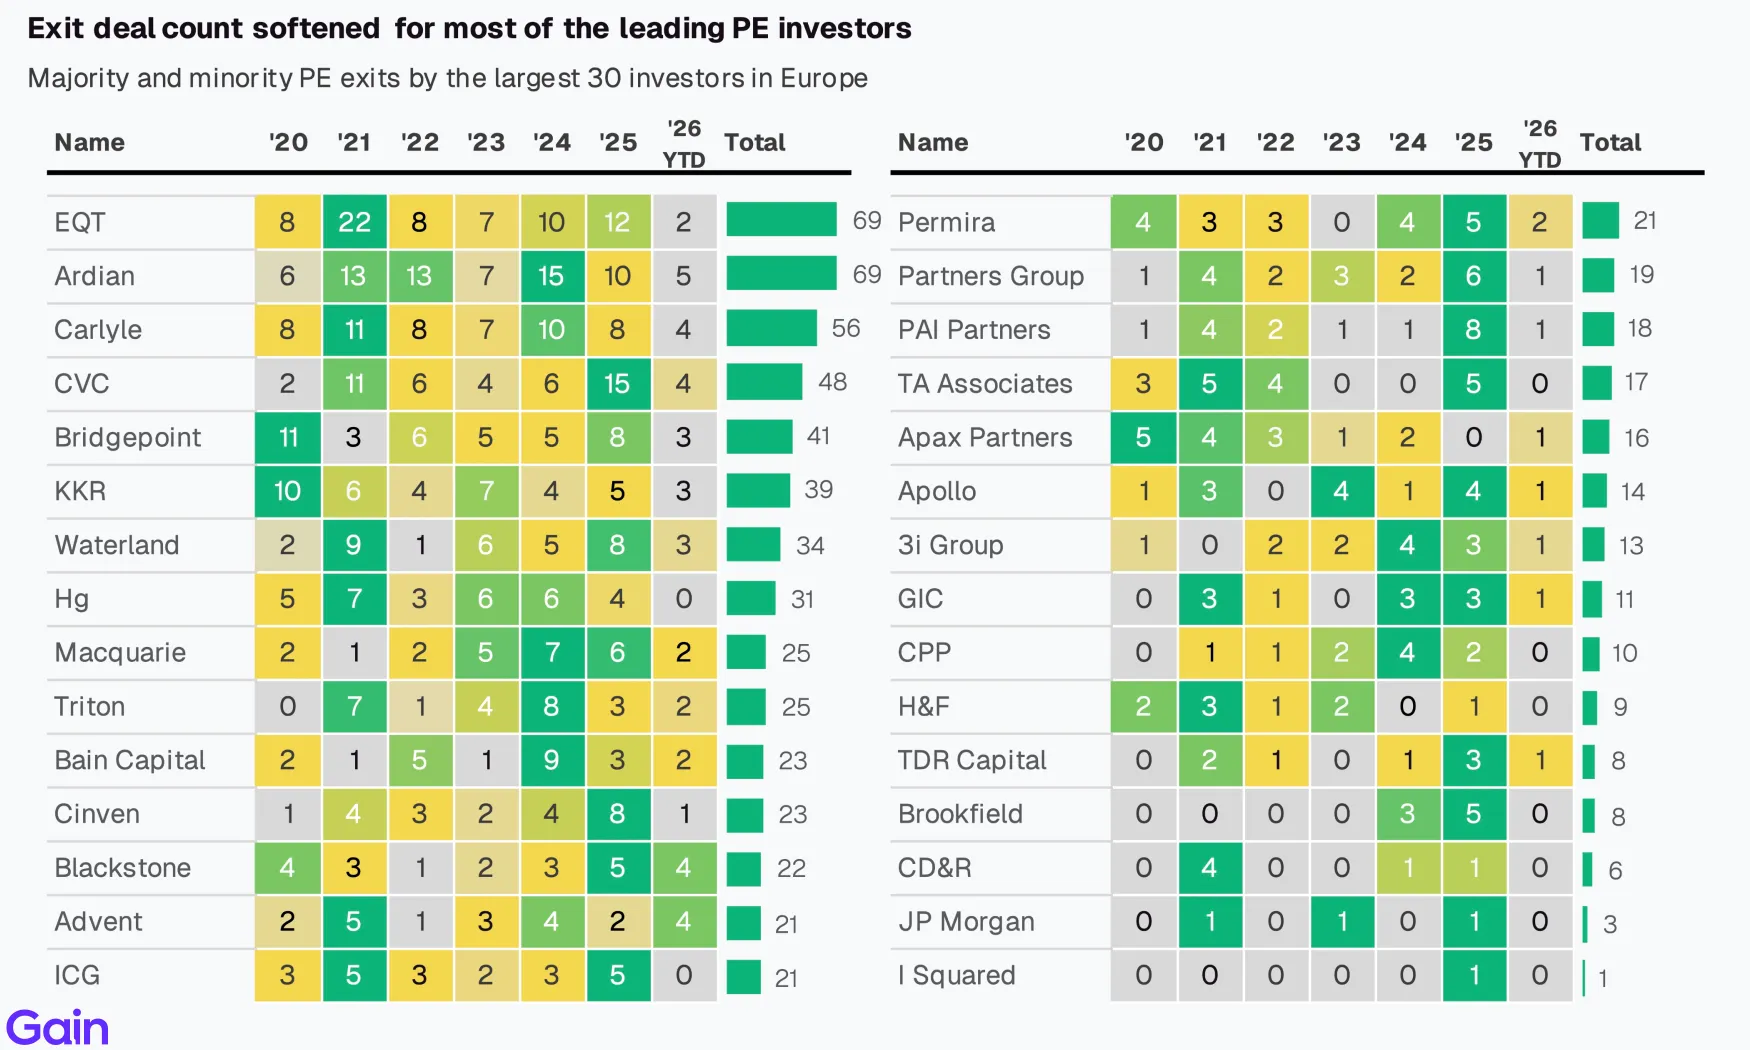
Exit deal count softened for most of the leading PE investors. Investors remain selective on exits amid subdued buyer appetite and continued valuation gaps.
Holding periods for PE assets rose yet again. The median company exiting in 2025 spent 5.8 years in the portfolio, up from 4.7 years in 2019. Notably, European assets continue to be held longer than their US peers. This is partly driven by a higher concentration in Industrials and Consumer sectors which have had slower exits.

Exits in Industrials and Consumer are most challenged, compared to the assets in the backlog (those held over 5 years). Both these sectors have seen growth and margins slow down, which have clouded the outlook for these assets. In comparison, exits are healthier in Financial Services.

By region, exits in DACH, Benelux and Nordics are most challenged. Lower exit rates relative to mature portfolios have led to a growing concentration of long-held assets.

Chapter 03: Buy-and-Build
Add-on activity is expected to be broadly flat in 2026. Amid a muted exit environment, sponsors have remained focused on portfolio value creation, with buy-and-build being the key strategy.

Chapter 04: Growth & Multiples
PE multiples dropped to 10.5x, now down 23% from 2021 peak levels. We don’t expect a multiple recovery this year, as interest rates remain elevated and buyer competition remains limited.
TMT recorded the sharpest valuation decline in 2026. Lower investor appetite for TMT assets weighed on valuations, while multiples across most other sectors remained broadly stable.
Methodology
The data for this report comes from Gain.
We define PE-backed entries as those in which a PE firm took a minority or majority stake. We define PE-backed exits as those in which a PE firm sold a minority or majority stake. We exclude any VC rounds from our analysis. Both entries and exits exclude aborted deals.
We only focused our analysis on assets HQ’d in Europe.
We estimate the deal count for the last 4 quarters based on prior deal history and the percentage of deals that are announced or added post-quarter close.
Our historical data might change as we add and update new deals to the platform.
For metric calculations, we only included assets that had a hand-curated profile on Gain (10+ hours of primary research). Where possible, we have used 2026 and last reported metrics. But in cases where numbers are still being reported, we have relied on metrics from previous years.
All EBITDA-related aggregates such as EBITDA margin and EV/EBITDA multiples exclude Financial Services from calculations.
Related Research
Discover our proprietary reports on investors, assets and PE deals.