
The State of European Private Equity
H1 2024

Executive Summary
Welcome to the inaugural edition of “The State of European Private Equity” report. In this report, we go deep into the PE deals landscape in Europe. We share insights on entries, exits, multiples, add-ons, holding periods, growth rates, margins and much more.
Here is a summary of our key findings:
Entries — Buyout deal activity in 2023 was the lowest it’s been in 6 years (down 32% from peak). Energy & Materials (-18%), Services (-27%) and Industrials (-25%) sectors proved to be more resilient. Q1 2024 data shows promise with the deal count exceeding both 2023 and pre-pandemic levels.
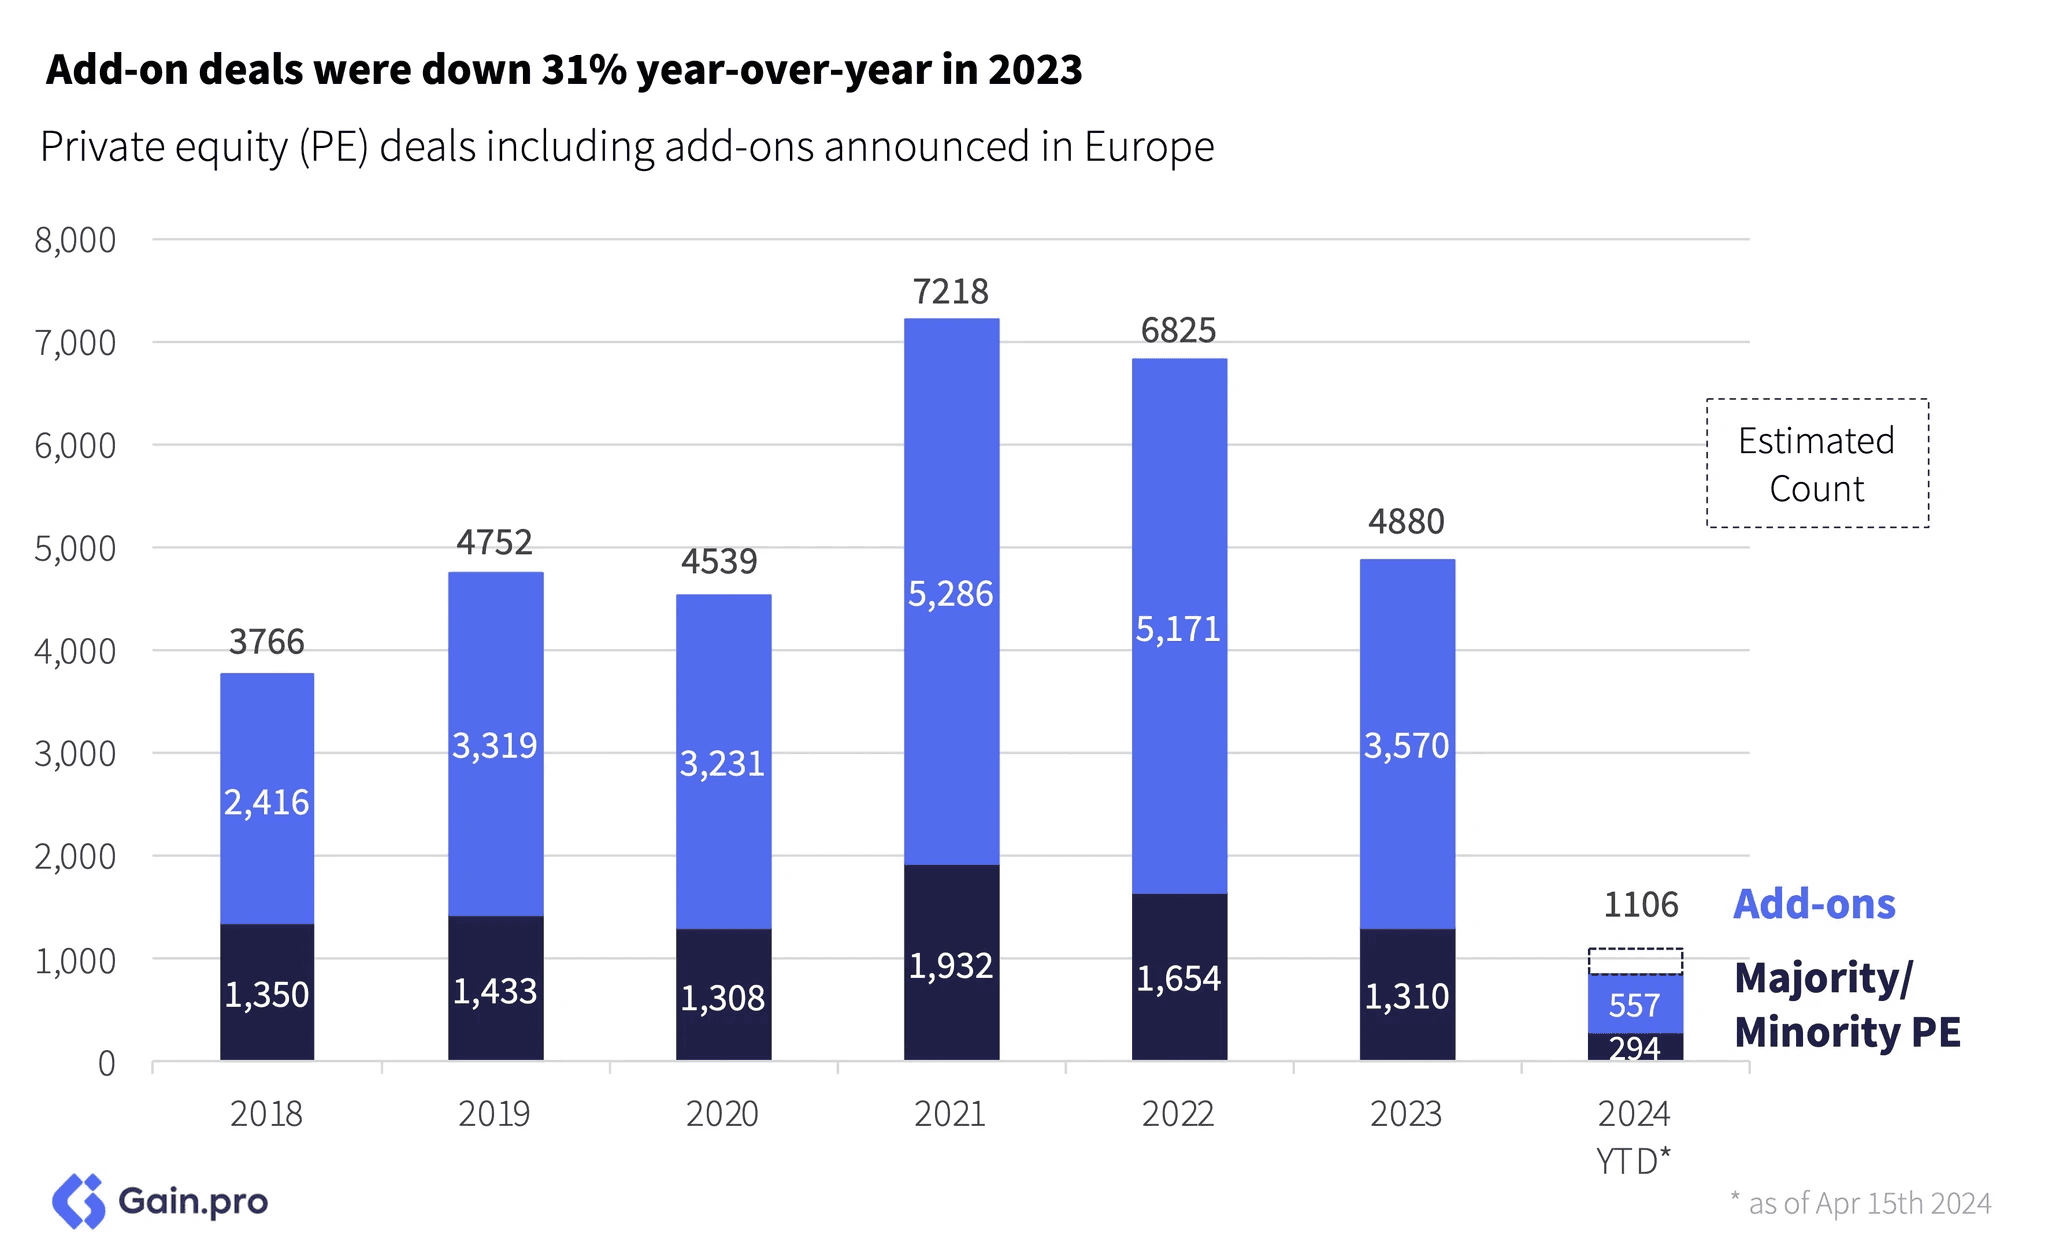
Add-ons — Add-on activity also took a hit in 2023 (down 31% YoY). Despite the decline, the ratio of add-ons to total PE deal activity remains near the decade-high. Close to half (47%) of PE-backed businesses employ a buy-and-build strategy (making at least one acquisition), with assets in Services and Financial Services leading the charge.
Exits: Exits slowed down meaningfully in 2023 but recent data suggests that exits have now stabilized. The current environment favors strategic buyers and it is no surprise that the share of strategic exits has risen from 33% in 2018 to 48% in 2023.
Holding Periods: Roughly 56% of assets that exited in 2023/24 stayed longer than 5 years in the portfolio. The average holding period is at an all-time high of 5.8 years vs. 4.9 years in 2020. By sector, Consumer, and by region, UK&I have the longest holding periods.
Multiples: Entry and exit multiples contracted sharply in 2023 (down 25-30% from the peak). TMT and Science & Health commanded a healthy premium vs. other sectors while the discount for add-on deals narrowed vs. platform multiples.
Growth and Margins: Revenue growth for PE-backed assets was the strongest in years. PE-backed assets grew 18.8% YoY in 2023 and EBITDA margins expanded too (up 170 bps in the last 7 years).
These insights barely scratch the surface. We can’t wait for you to go through the full report. If you have any questions do not hesitate to reach out to sid.jain@gain.pro.


Chapter 01: Entries
Overall Trend
Buyout deal activity in 2023 was the lowest it has been in 6 years. Entries were down 32% from their 2021 peak. The slowdown in entries can primarily be attributed to high interest rates which raised borrowing costs for PE sponsors. However, the most recent data from 2024 is starting to show promise.
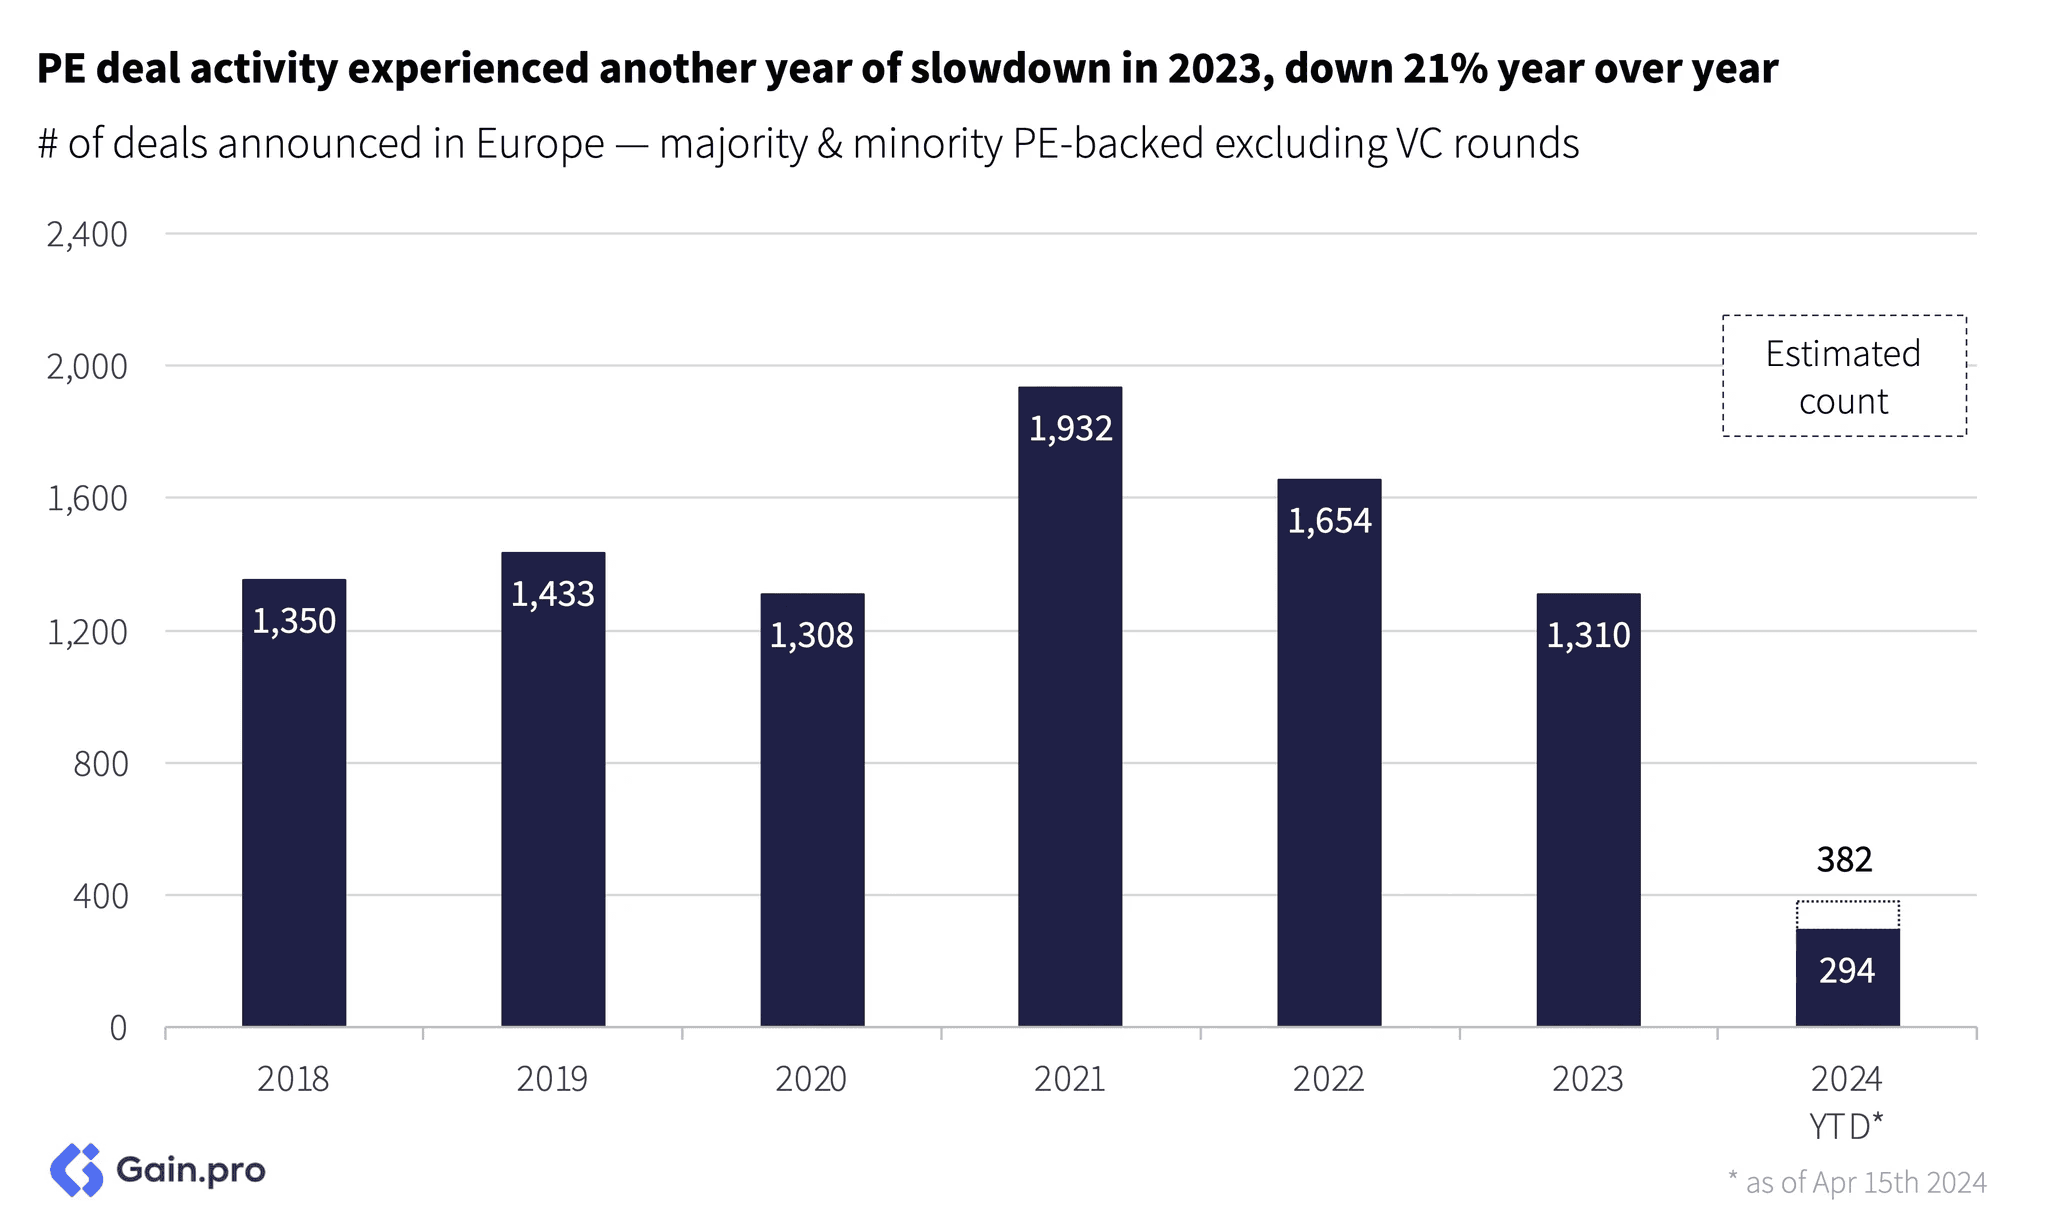
The estimated buyout deal count in Q1 2024 exceeded both 2023 and pre-pandemic levels. The market seems to be bottoming out. The 2023 deal count was stable across quarters (unlike the fall in 2022) and entries in 2024 seem to have continued at a similar pace.

Chapter 02: Buy-and-Build
Add-on Activity
In line with the overall market, add-on activity in 2023 also took a hit. Deals were down 31% YoY though they still outpaced pre-pandemic levels. By sector, Services accounted for the largest share of add-on deals (39%) followed by TMT (21%) and Industrials (13%).
Chapter 03: Exits
Exits slowed down meaningfully in 2023 and were down 33% from their 2021 peak. Higher interest rates, macro uncertainty, lower valuations and dormant IPO markets all contributed to this slowdown.
Chapter 04: Portfolio Stats
Revenue Growth
Growth for PE-backed assets is the strongest it has been in years. On average, PE-backed assets grew 18.8% YoY in 2023, well above their pre-pandemic averages. Over the last 5 years, the median PE business had a CAGR of 13.8%.

Methodology
The data for this report comes from Gain.pro.
We define PE-backed entries as those in which a PE firm took a minority or majority stake. We define PE-backed exits as those in which a PE firm sold a minority or majority stake. We exclude any VC rounds from our analysis. Both entries and exits also exclude live and aborted deals.
We only focused our analysis on assets HQ’d in Europe.
We estimate the deal count for the latest quarter based on prior deal history and the percent of deals that are announced or added post quarter close.
For metric calculations, we only included assets that had a hand-curated profile on Gain.pro (10+ hours primary research). Where possible, we have used 2023 metrics. But in cases where numbers are still being reported, we have relied on 2022 metrics.
All EBITDA related metrics such as EBITDA margin and EV/EBITDA multiples exclude Financial Services from calculations.
Related Research
Discover our proprietary reports on investors, assets and PE deals.