
2026 Edition
The Private Equity Value Creation Report

Executive Summary
What separates the best private equity deals from the rest? Where does value creation really come from, and how does it vary by deal type, sector, region and size? How have the drivers of value creation evolved over time?
These are just some of the questions that led us to analyze data from over 15,502 private equity investments globally for our latest “Private Equity Value Creation” report. Here's a summary of our key findings:
Revenue growth is the key driver of value creation. It accounted for 57% of value creation over the last decade. Its share has risen from 44% of value creation in 2019 to 75% in 2025. The share of multiple expansion, in contrast, has fallen from 46% to 8% as valuations have come down.
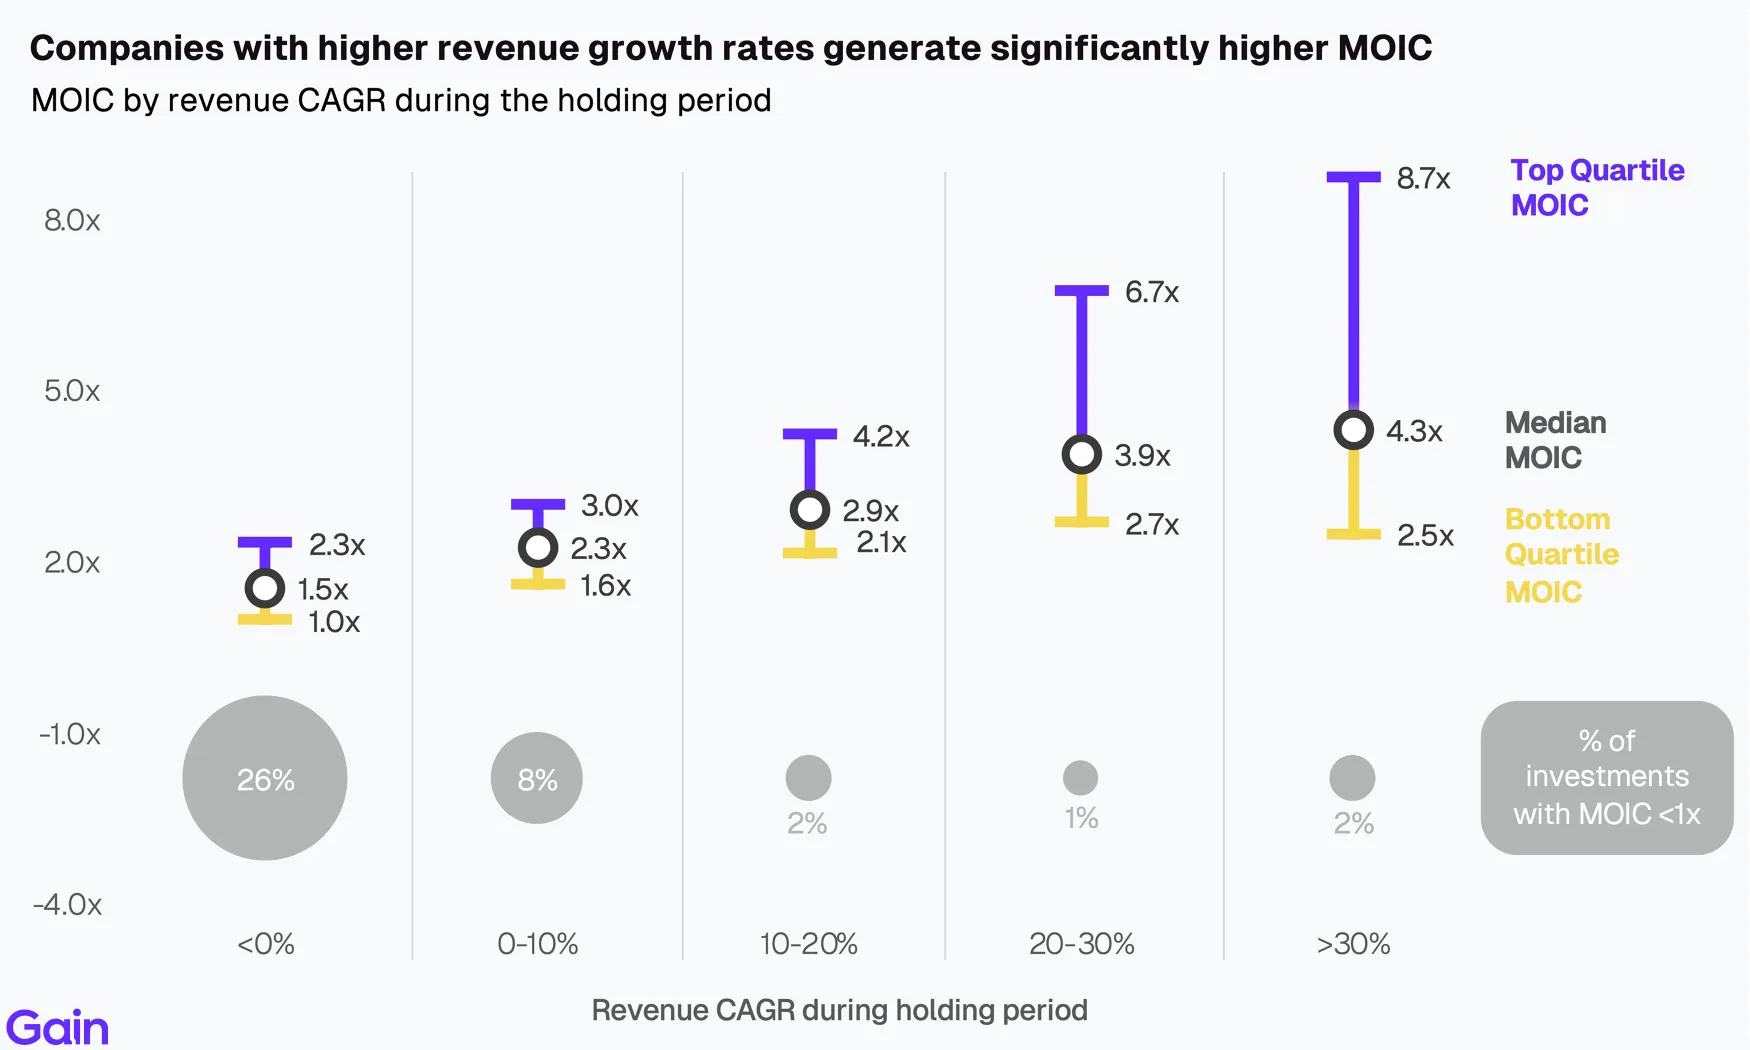
Companies with higher revenue growth generate significantly higher MOIC. Companies growing above 30% CAGR generate a median MOIC of 4.3x, almost double that of those growing 0–10% (2.3x). Growth also amplifies all other value creation drivers, with both multiples and margins expanding at a higher rate for those with stronger growth.
Margin expansion is strongest in businesses bought with a turnaround in mind. 78% of operationally challenged businesses (<0% EBITDA margin at entry) achieve margin expansion, with a median improvement of +1,290bps. In contrast, businesses with entry EBITDA margins of over 30% see a margin contraction (median of –290bps). Of all regions, DACH relies most on margin expansion (37%).
Large deals (>$1bn) rely more on margin expansion, while smaller and mid-sized deals focus more on revenue growth. Margin expansion is also particularly strong in public-to-private (+430bps). Family-to-Sponsor deals, in contrast, deliver the highest revenue growth (12.9% CAGR).
Multiple expansion is more common for businesses with lowest entry multiples. 94% of deals acquired at 0–6x EV/EBITDA achieve positive multiple expansion, with a median gain of +3.8x, while deals acquired above 15x typically experience a median contraction of –0.7x. MOIC is also highest for businesses with lowest entry multiples.
Buy-and-build is central to PE value creation. Companies with a more active buy-and-build strategy deliver higher returns across the board. When done right, buy-and-build bolsters all three value creation drivers: revenue growth, margin expansion, and multiple expansion.
Email any questions about the report or the data to insights@gain.ai.



Chapter 01: Overall Drivers of Value Creation
Overall Contribution
Revenue growth is the key driver of value creation. It accounts for 57% of value creation over the last decade. Its share has risen from 44% of value creation in 2019 to 75% in 2025. The share of multiple expansion, in contrast, has fallen from 46% in 2019 to 8% last year, as valuations have come down. Looking ahead, we expect revenue growth to remain the primary driver of value creation, especially as interest rates still remain high and multiples show no signs of recovery.

Revenue Growth
Companies with higher revenue growth generate significantly higher MOIC. Companies growing above 30% CAGR generate a median MOIC of 4.3x, almost double that of those growing 0–10% (2.3x). Loss rates also fall from 26% for businesses with negative-growth to just 1–2% for those growing above 10%.
Fast-growing companies also command a 30% to 70% higher exit multiple than slower-growing ones. This relationship holds across assets of all sizes and sectors.

Chapter 02: By Deal Size
Large deals (>$1bn) rely more on margin expansion, while smaller and mid-sized deals focus more on revenue growth. Deals above $1bn in EV get 29% of value creation from margin expansion, over double the share seen in smaller deals. Revenue growth, in contrast, contributes to the lion’s share of value creation (~60%) for smaller to mid-sized deals.

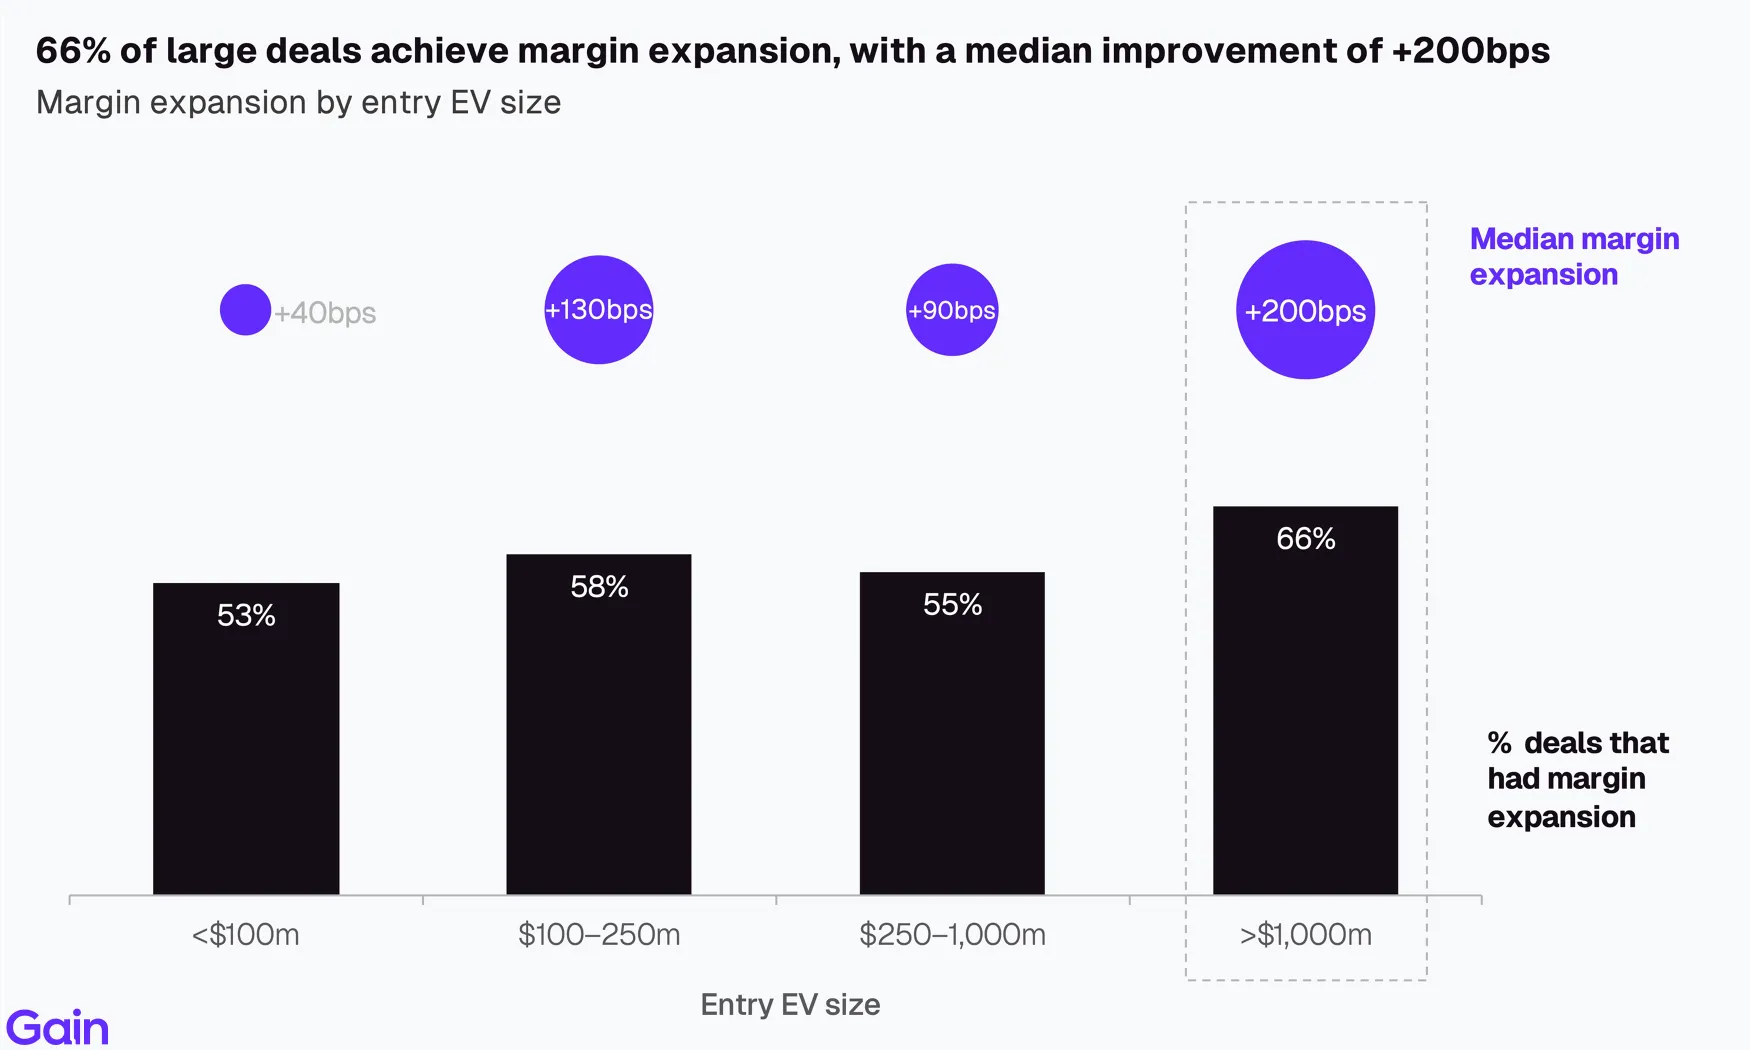
66% of large deals (>$1bn) achieve margin expansion (median of +200bps). This is expected, as large businesses often have more opportunities for cost optimizations. In contrast, smaller companies (<$100m) typically only see a modest improvement in margin (+40bps), with sponsors primarily prioritizing growth.





Smaller deals (<$100m) tend to show faster growth, with a median revenue CAGR of 11.2% (vs. a median of 6.5% for deals above $1bn). Smaller firms have more opportunities to expand product lines and enter new markets. In contrast, large companies are typically more mature with limited organic growth opportunities.

Chapter 03: By Deal Type
Compared to other deal types, margin expansion contributes a higher share of value creation in public-to-private deals (36%) and carve-outs (25%). In contrast, revenue growth dominates in family-to-sponsor (59%) and sponsor-to-sponsor deals (61%).

72% of public-to-private deals achieve margin expansion, with a median improvement of +430bps, the highest of any deal type. Carve-outs follow suit at +180bps, with 64% of deals achieving margin expansion. Public-to-private targets are also typically larger (median revenue of $420m). Given the scale, margin expansion becomes more impactful. Private ownership also gives sponsors greater flexibility to implement operational transformations outside the scrutiny of public markets.

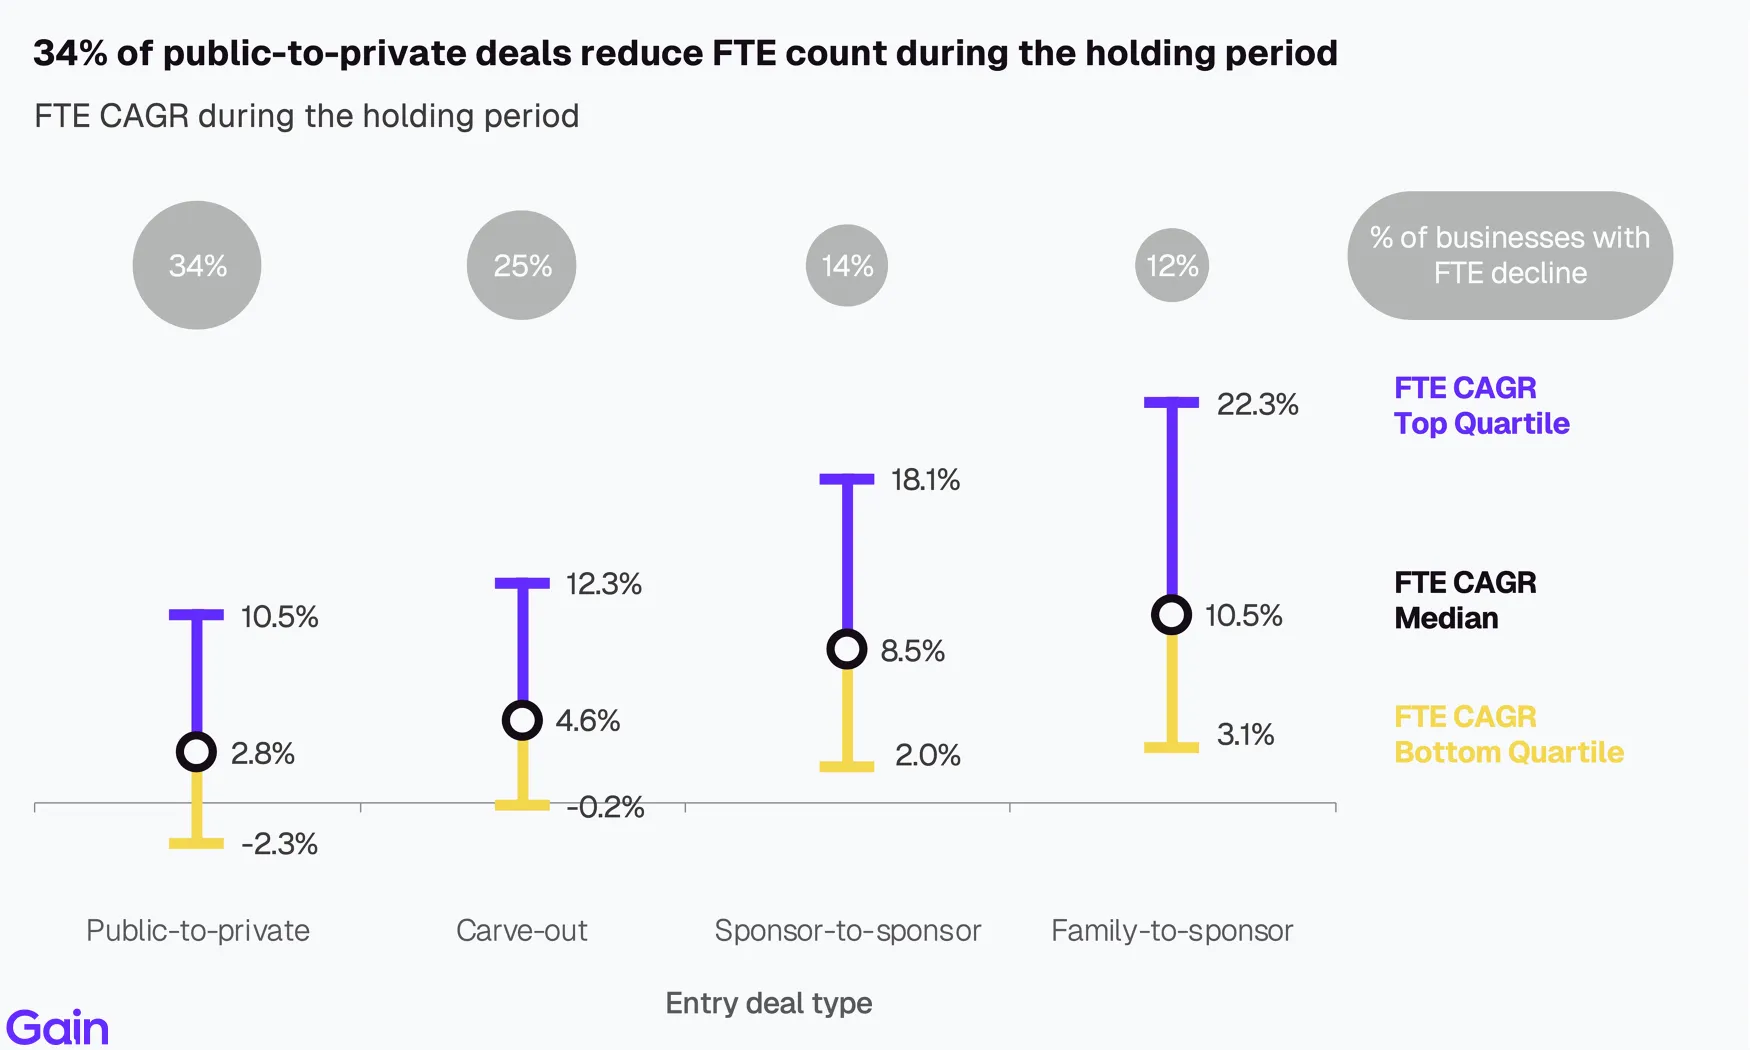
34% of public-to-private deals go through FTE reduction during the holding period. These businesses typically undergo a reset post-acquisition. This includes both cost optimizations and divestiture of non-core units, which are more common in public-to-private deals.
Chapter 04: By Sector
Consumer (66%) and Services (62%) rely most on revenue growth for value creation. In contrast, Industrials rely more on margin expansion (29%) while Science & Health (32%), Energy & Materials (31%) and TMT (30%) rely more on multiple expansion. TMT in particular has seen strong growth which has led to the re-rating in the sector.

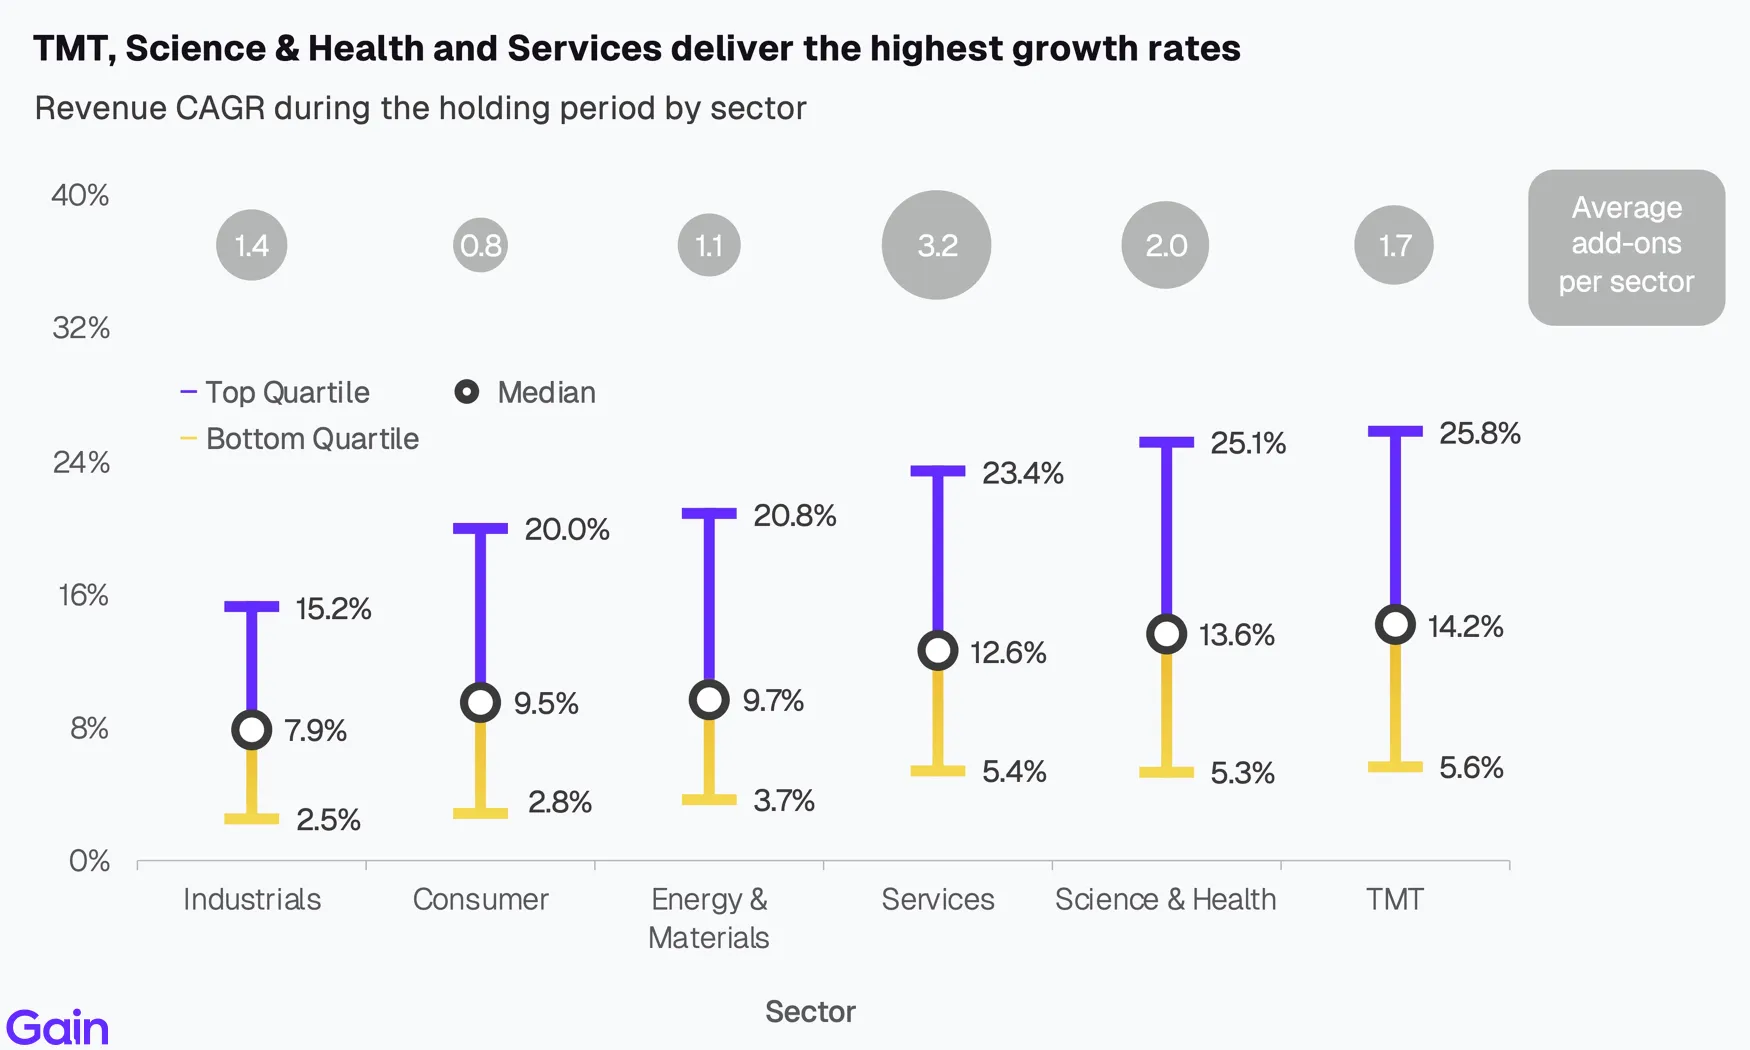
TMT, Science & Health, and Services deliver the highest growth rates. In addition to organic growth, they are also more active in buy-and-build. Traditional sectors such as Industrials, Consumer and Energy & Materials show materially slower growth.
TMT (+6.9x), Science & Health (+4.0x), and Services (+2.8x) have the highest multiple expansion, supported by strong demand and growth rates. Traditional sectors such as Consumer and Industrials, in contrast, show minimal expansion. Looking ahead, we expect TMT multiples to come under pressure, as AI resets valuation multiples.

Chapter 05: By Region
France (68%), Iberia (65%), and Italy (64%) rely most on revenue growth. In contrast, DACH relies most on margin expansion (37%) while Nordics has the highest contribution from multiple expansion (41%).
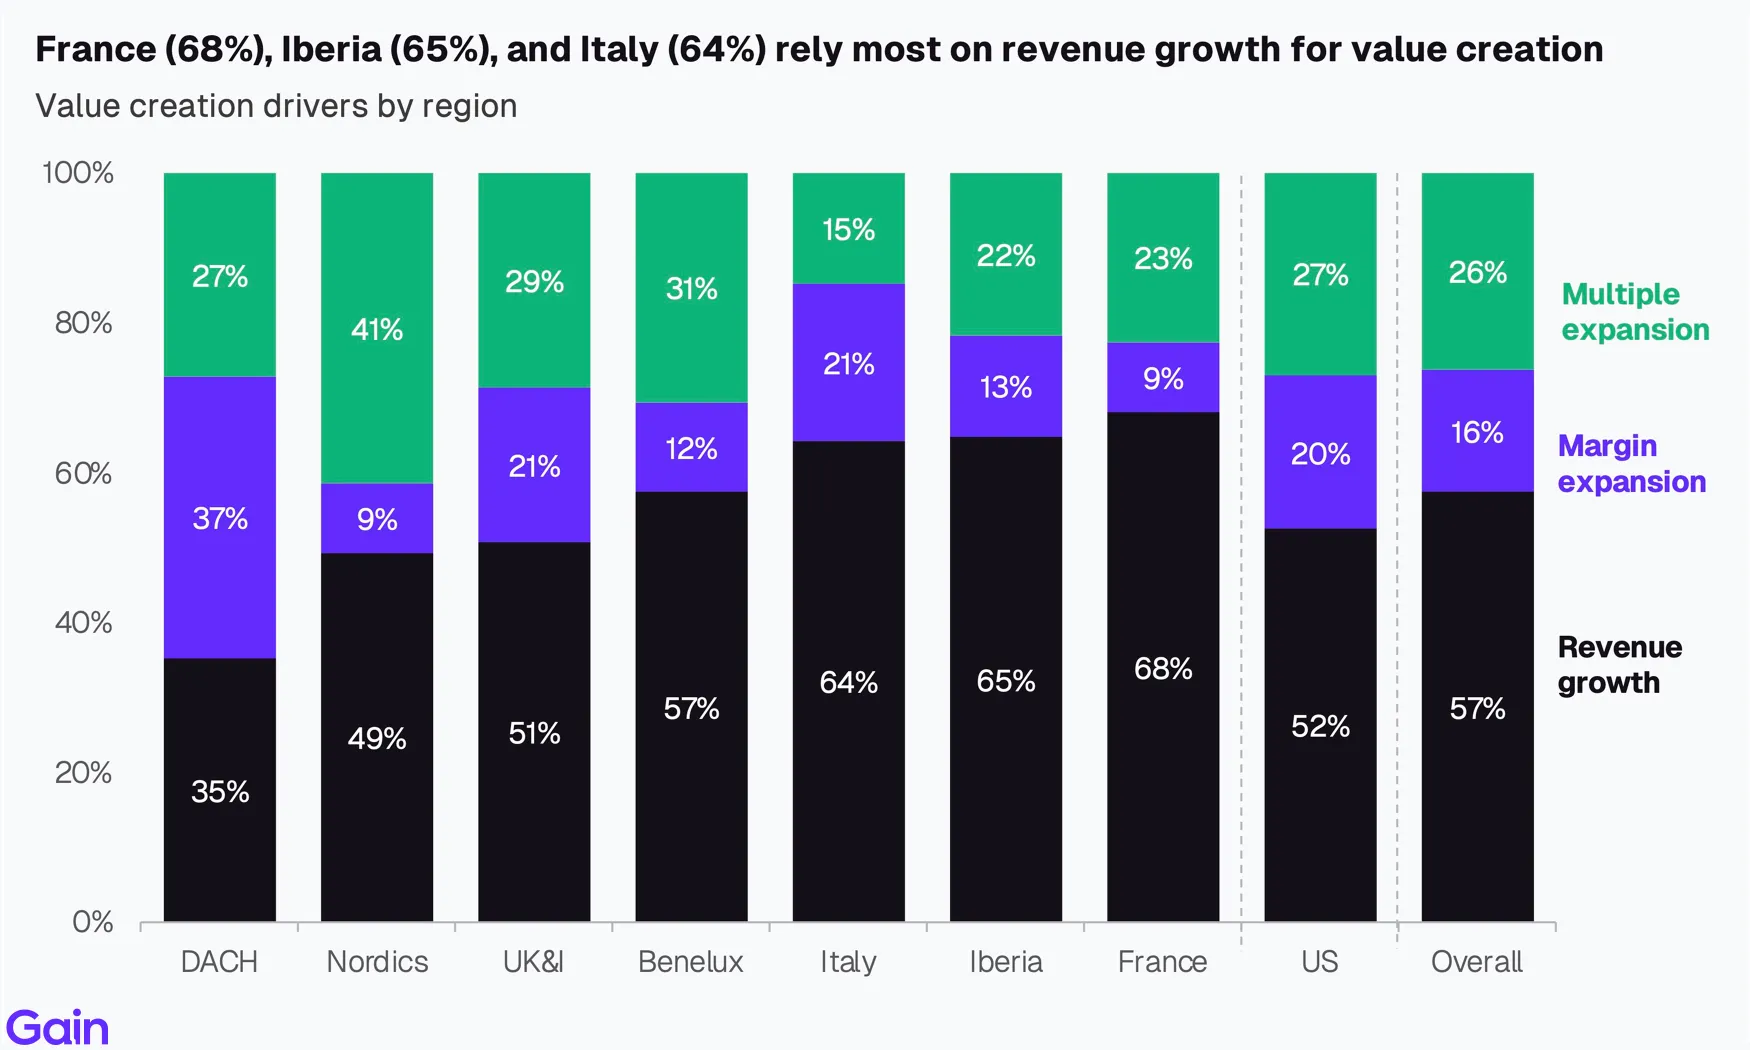
Nordics recorded the highest median revenue CAGR at 13.8%, followed by the US (12.3%) and UK&I (11.8%). TMT is the largest sector in all three regions, which has partly driven this strong growth. DACH in contrast, is the slowest growing region at 7.1%, roughly half that of Nordics, driven by its more Industrials heavy exposure (slowest-growing sector at 7.9% median CAGR).

The Nordics deliver the highest MOIC (3.3x) of any region, supported by strong revenue growth (13.8% CAGR). In contrast, DACH records the lowest MOIC (2.2x), reflecting its higher exposure to lower MOIC sectors such as Industrials (28% of assets).

Chapter 06: By Holding Period
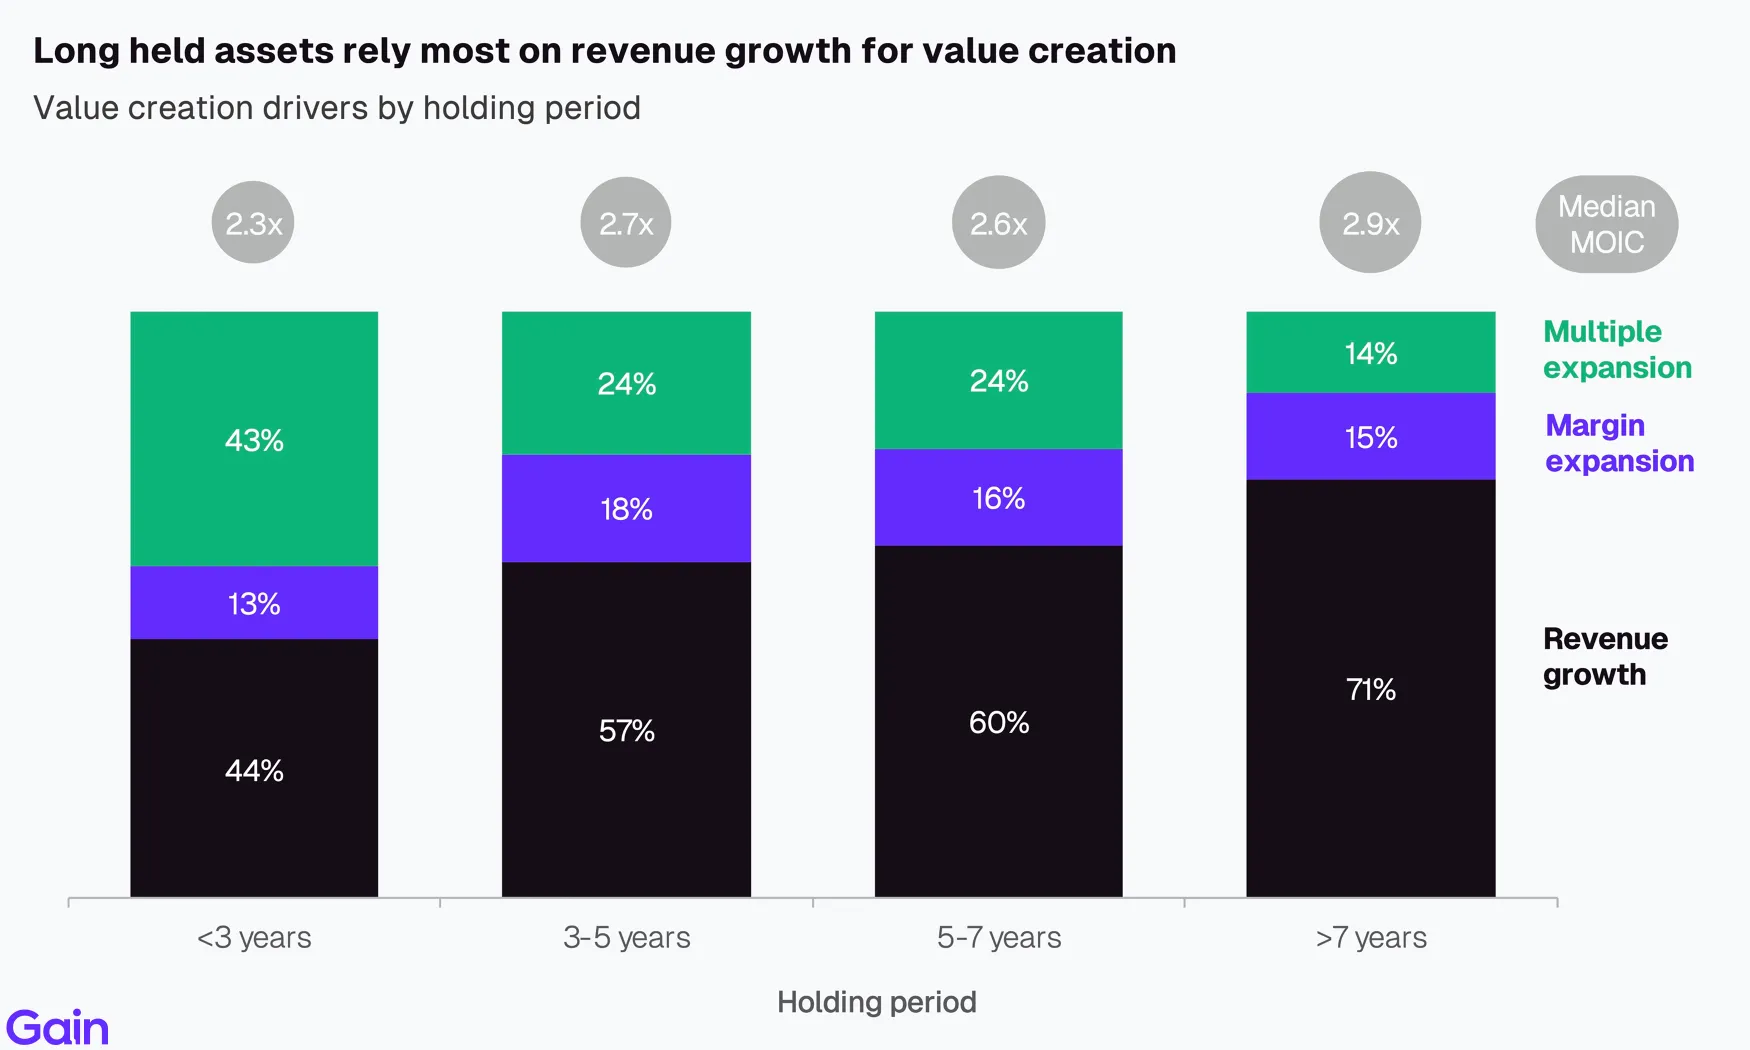
Companies that are held longer (>7 years) are usually the best performing or the worst. High-quality businesses are often held longer to continue to execute on value creation strategies such as buy-and-build, geographic expansion, and operational transformation. In contrast, underperforming assets may remain in portfolios as sponsors look for turnarounds or wait for more favourable exit conditions.

The longer you hold an investment, the lower the IRR despite higher absolute returns. For example, doubling your money in 2 years delivers a 41% IRR, while tripling it in 8 years yields only a 15% IRR. This creates a trade-off between maximising MOIC and IRR. Once investments clear their return hurdles, GPs may favour letting winners run, while LPs must weigh the additional MOIC against the cost of keeping capital tied up.

Longer-held investments rely increasingly on revenue growth rather than multiple expansion to create value. As investments mature, sponsors have greater opportunity to execute buy-and-build strategies, expand internationally, and compound growth.
Chapter 07: Buy-and-Build
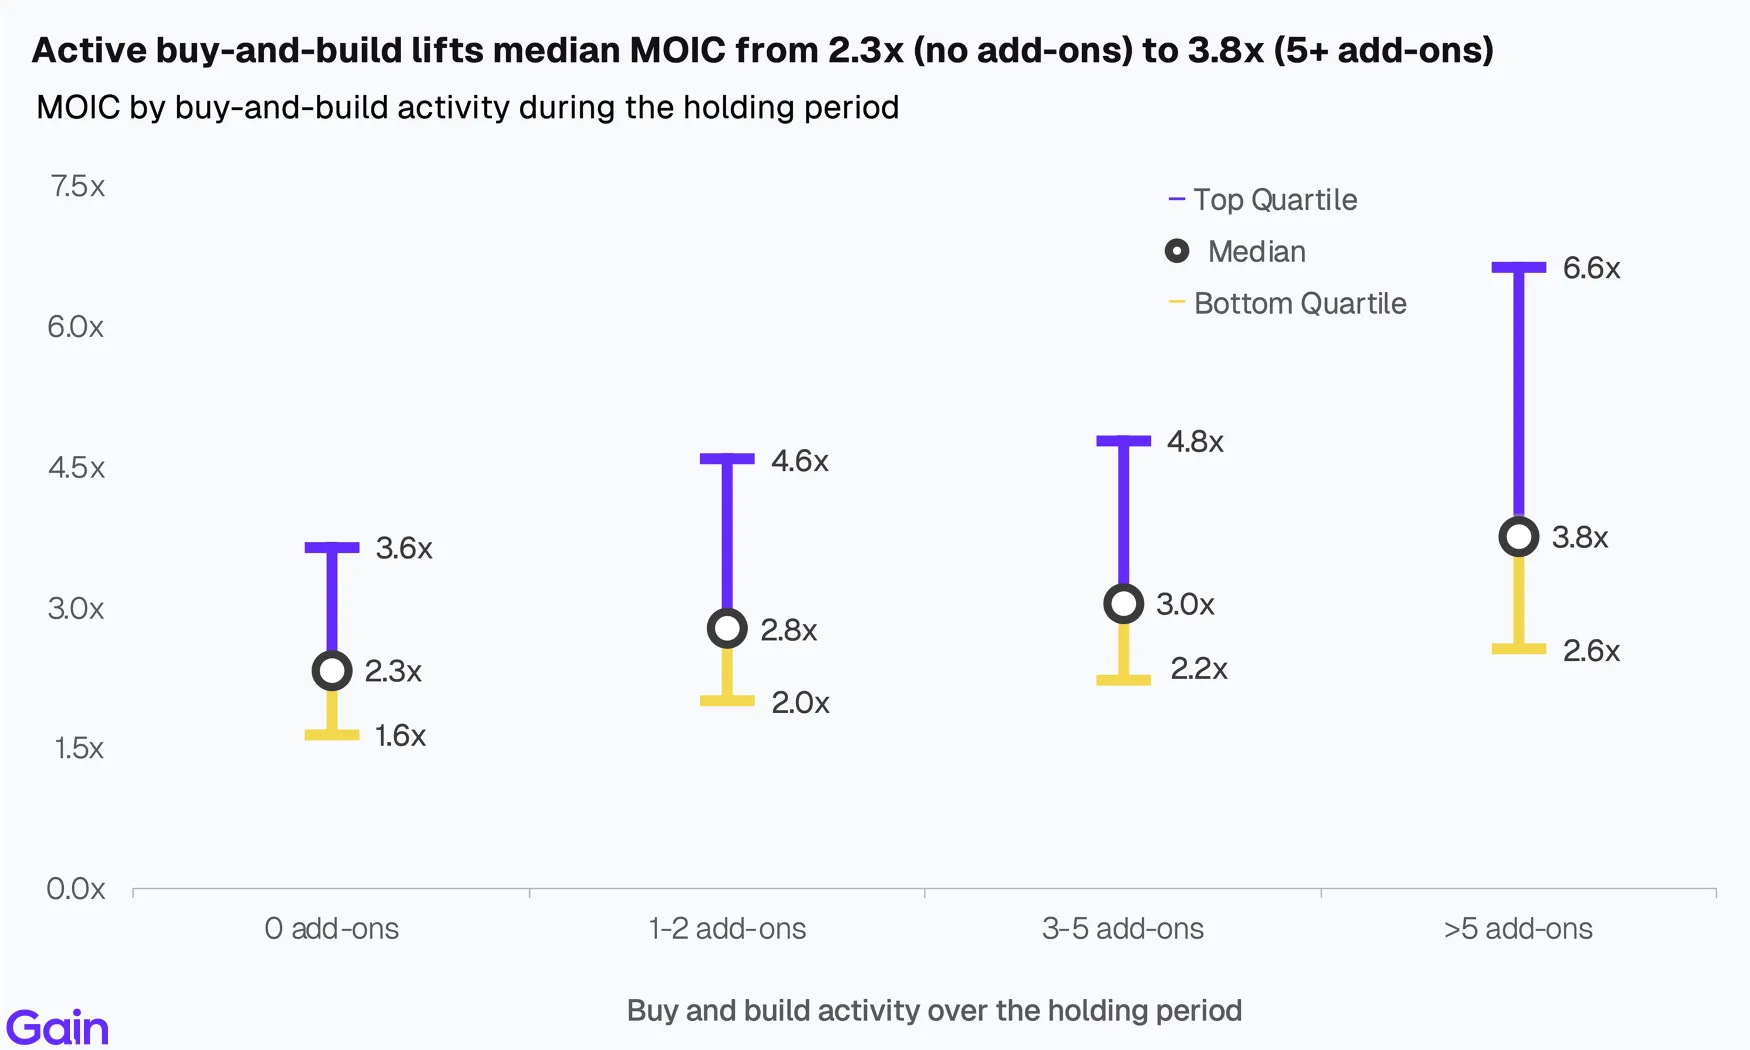
Companies with an active buy-and-build strategy consistently deliver higher revenue growth. Those with over 5 acquisitions during the holding period grow at over 18% CAGR vs. 8% for those without. While this growth is mainly inorganic, M&A activity also helps accelerate organic performance by cross-selling opportunities, and shared capabilities across the platform.

As buy-and-build activity increases, growth accounts for a greater share of value creation. As sponsors complete more acquisitions, returns become less dependent on multiple expansion (30% to 19%) and are increasingly driven by growth. Successful integration still remains key, as poorly executed acquisitions can often destroy value.

Active buy-and-build strategies drive higher returns across all performance quartiles. Median MOIC increases from 2.3x for businesses without add-ons to 3.8x for those completing more than five acquisitions.
Methodology
The data for this report comes from Gain. Our analysis covers over 15,502 private equity investments and exits globally over time. We include all transactions that led to liquidity, including partial exits.
We use the Shapley method of value decomposition to calculate the percentages for value creation drivers (revenue growth, margin expansion, and multiple expansion). We calculate each component's contribution across 6 permutations and average the results. This ensures that interaction effects are accounted for and that no component is favored due to sequencing.
For value creation analysis, we also exclude outliers and only analyze the data where all entry and exit metrics are available and there is positive total value creation.
We calculate MOIC as the ratio of exit equity value to entry equity value. Where equity values are not available, we estimate them using debt estimates at entry and exit.
All EBITDA-related aggregates, such as EBITDA margin and EV/EBITDA multiples, exclude Financial Services from calculations unless stated otherwise. EV/EBITDA multiples are based on trailing figures, while EBITDA margins represent the last reported values.
Our dataset relies on publicly available deal sources, and as such, there might be an upward bias to our MOIC figures as the best-performing deals are typically reported more frequently than others.
Related Research
Discover our proprietary reports on investors, assets and PE deals.