Comparing Private Equity and Independently Held Businesses
Analyzing the business performance of PE-backed and independently held assets based on data from over 15,400 companies in Europe
2024

Executive Summary
Welcome to the Private Equity vs. Independently Held report. In this report, we study over 15,400 businesses and 3,400 deals in Europe to compare the business performance of majority PE-backed assets with independently held businesses (also known as familyowned or privately-owned). Four insights stand out in our research.
Assets owned by PE outperform those independently held. On average, majority PE-backed assets grow their revenue ~3-5% faster per year, with EBITDA margins being 3-5% higher as well. Both CAPEX and FTE growth rates are higher for PE-backed businesses too.
PE-backed businesses do more M&A which boosts overall growth rates and margins. 48% of PE-backed businesses carry out add-on acquisitions, while only 27% of independently held businesses do so. M&A boosts overall growth rate by 2-3x for the acquirers.
PE-backed investments are tilted more towards TMT and Services. PE firms overweight sectors that are high growth, resilient and have plenty of M&A opportunities. They underweight Industrials and Consumer compared to the wider independently held asset pool.
PE firms acquire best-in-class independently held businesses. PE firms acquire businesses that grow at least 2x faster than the wider independently held asset pool. These businesses also have higher margins and higher growth rates compared to their portfolio holdings. Waterland, Carlyle, H.I.G. Capital and Oaktree Capital rank as the leading buyers of independently held businesses.

Chapter 01: Company Characteristics
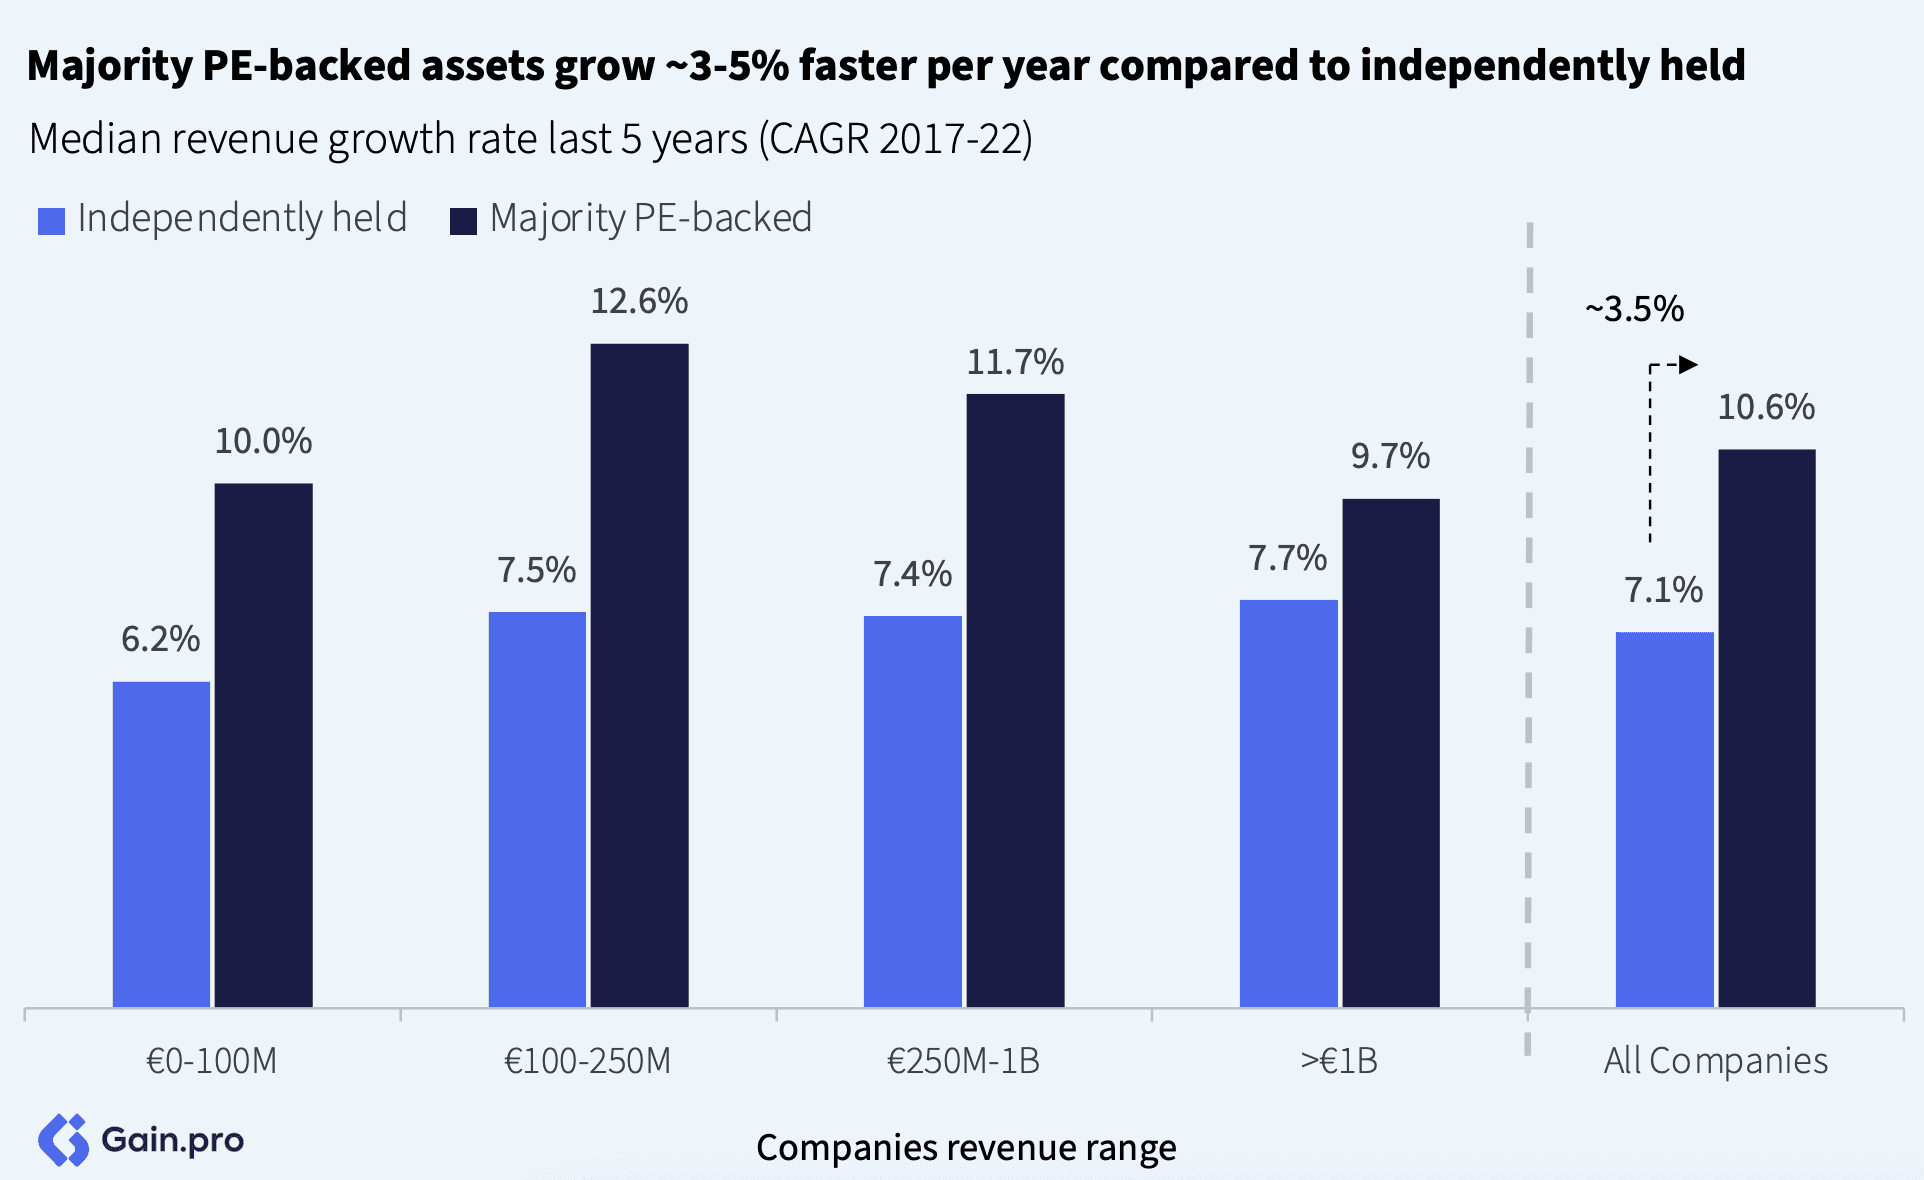
PE-backed assets grow their revenue faster
On average, majority PE-backed assets grow their revenue ~3-5% faster per year compared to independently held assets. This is true for companies of all sizes – big or small. As companies become larger (>€1bn revenue), the growth delta narrows down.
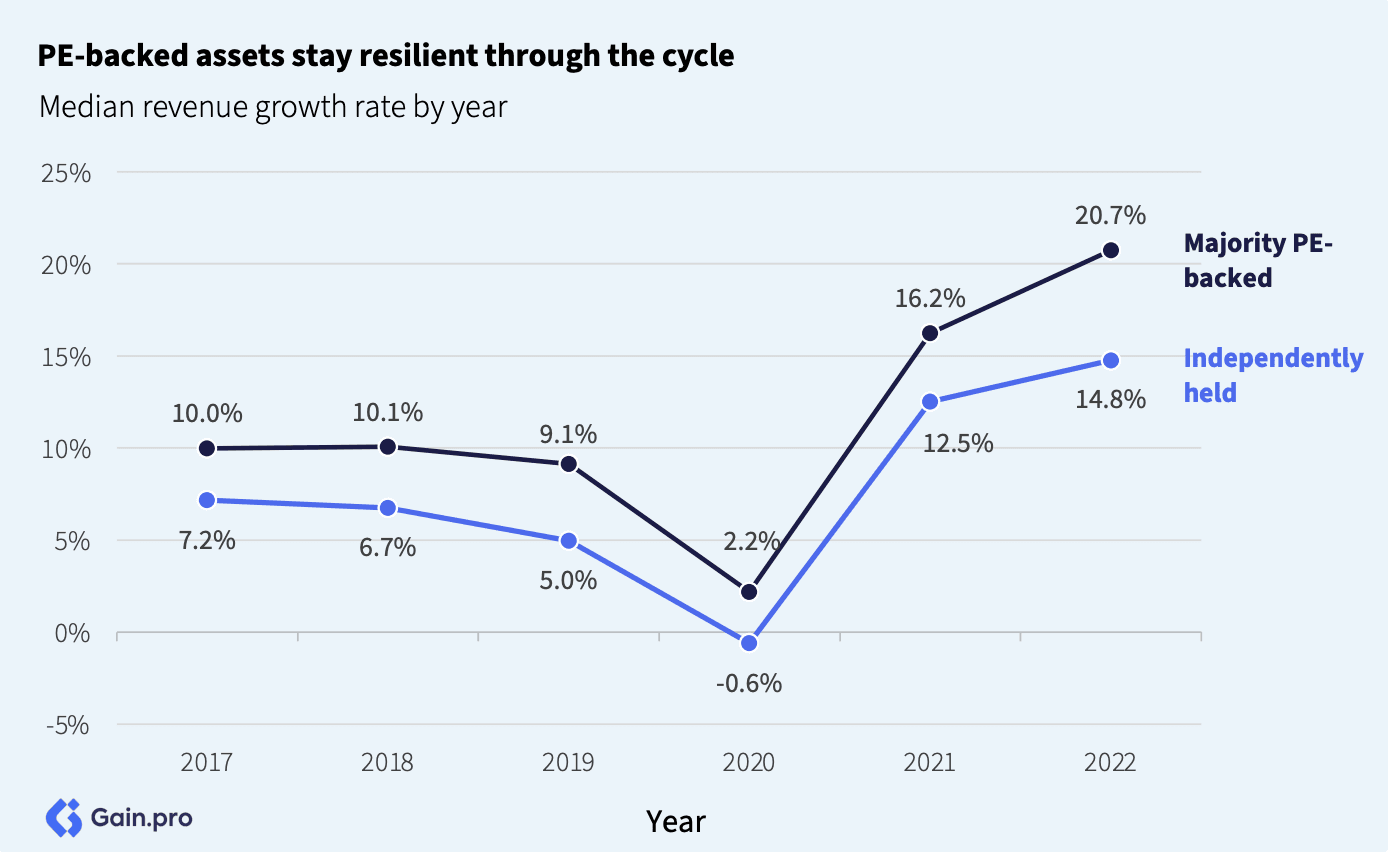
Regardless of the macro, PE-backed assets grow faster
Regardless of the macro landscape, majority PE-backed companies grow faster than independently held firms. PE firms usually have a more aggressive growth agenda and continue to invest through the cycle.
Chapter 02: Sector Trends
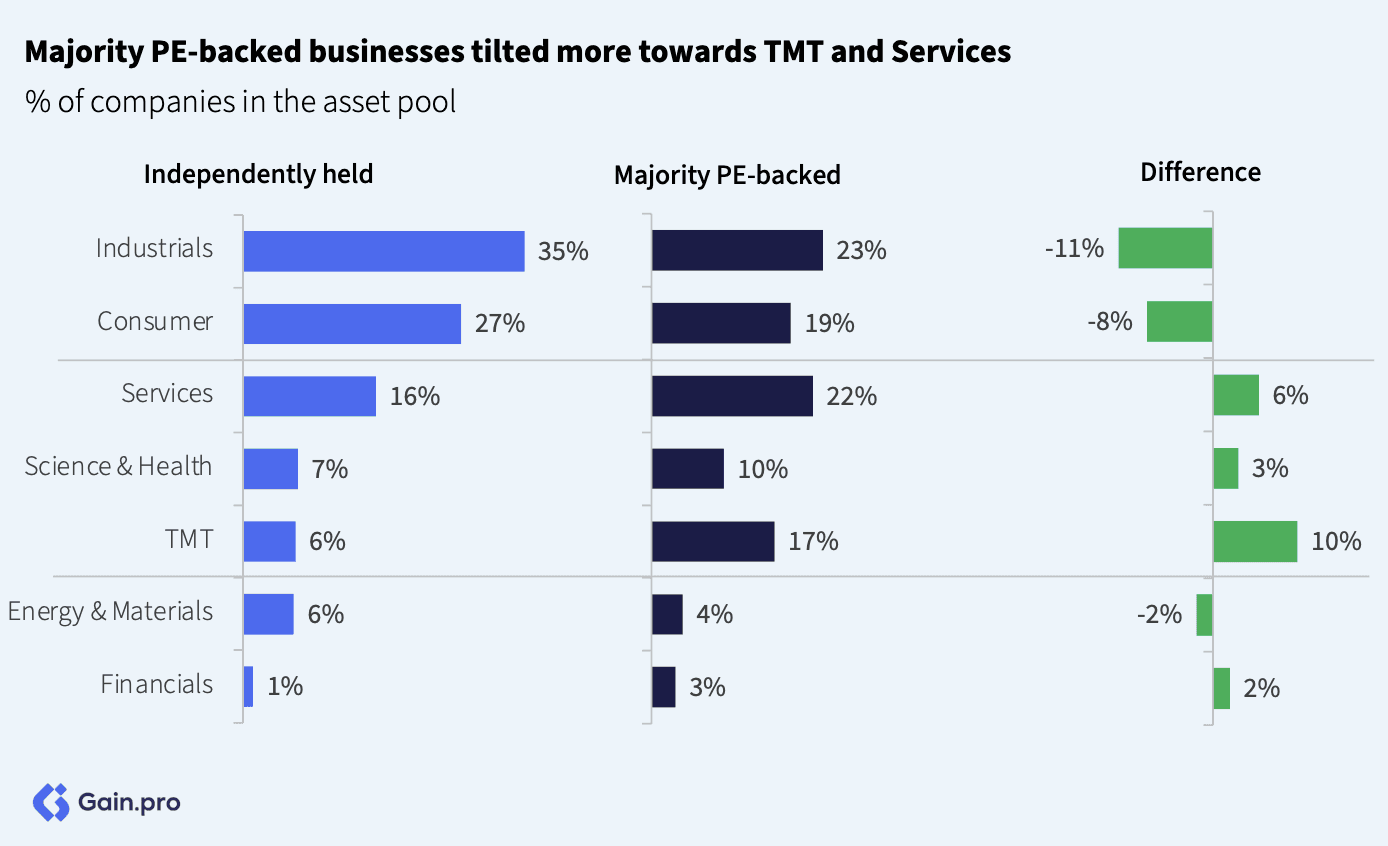
PE-backed investments are tilted towards TMT and Services
Compared to independently held assets, majority PE-backed assets are tilted more towards TMT and Services. This is expected as PE firms want to invest in sectors that are high growth and more resilient. As you would expect, they underweight lower margin sectors (such as Industrials) that are cyclical, have less M&A opportunities while also being less cash generative.
Growth delta is highest in TMT, Science & Health and Services
By sector, PE-backed assets in TMT, Science & Health and Services have the highest growth delta vs. independently held. PE firms generally invest in businesses with a higher growth rate and they then further accelerate growth using M&A and cross-border sales.

Chapter 03: Acquiring an Independently Held Business
Primary deals are smaller in size and happen at lower valuations
Deals where a PE buys an independently held business (primary deals) are roughly half the size of deals where a PE buys an asset from another investor (sponsor to sponsor deals).
The median EBITDA at acquisition for primary deals is roughly 60% lower. Primary deals also happen at lower valuations (10% cheaper).
Note: We define primary deal as a deal where a PE firm acquires a majority stake in an independently held business. Sponsor to sponsor deal is a deal where a PE firm acquires a majority stake in a firm owned by another investor.

Chapter 04: Leading Primary Deal Investors
Top 30 primary deal investors in Europe by EV acquired (1/2)
Waterland, Carlyle, H.I.G. Capital and Oaktree Capital are the leading buyers of independently held businesses (primary deals). We rank investors by EV acquired in the last 5 years, only including investors with at least 3 primary deals and at least 50% of their deals being primary.

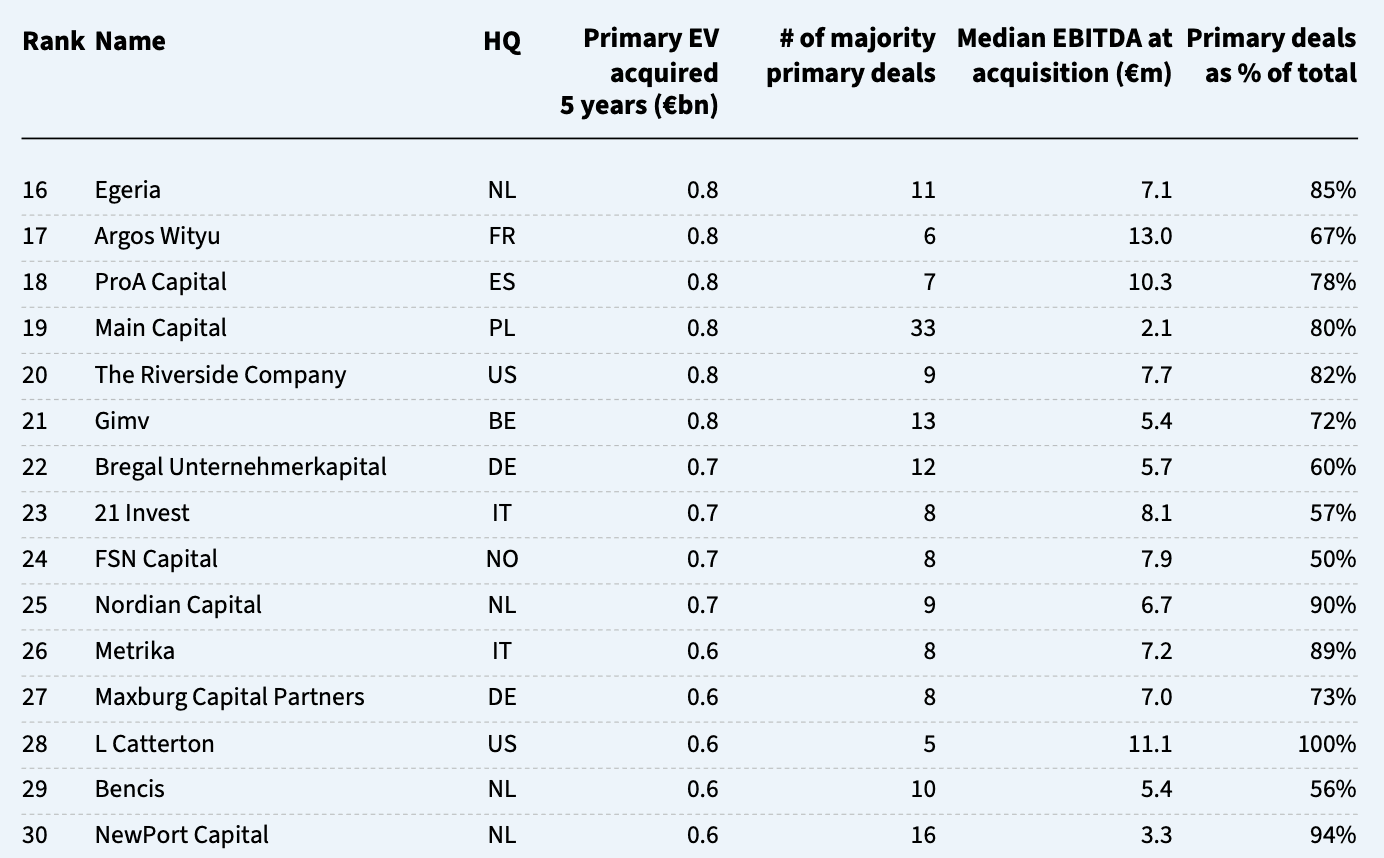
Top 30 primary deal investors in Europe by EV acquired (2/2)
US and German investors make up for the largest share of primary deal investors in our top 30 ranking. They bag 6 of the top 30 spots each. Investors based in Netherlands and UK follow suit with each of them bagging 3 spots in our top 30 ranking.
Methodology
Data: The data for the analysis comes from Gain.pro. Unless stated otherwise, we used data over the last 6 years from 2017-2022. For the calculations, we only included assets that had a hand-curated profile on Gain.pro (10+ hours primary research). Our focus for this analysis were assets HQ’d in Europe only.
Definitions: Independently held businesses, also otherwise known as “privately owned” or “family owned” are businesses that haven’t received any outside equity funding. Majority PE-backed businesses are businesses where a single or multiple PE firms own a majority stake. Primary PE deals are deals where a PE firm acquires a majority stake in an independently held business.
Post Acquisition Metrics: To remove any sample bias, we only included companies that had financial metrics present both at and postacquisition.
Investor Ranking: We take the last 5 years of deal data, including only those investors who have executed at least 3 primary deal transactions, with primary deals constituting at least 50% of their overall transactions. We then rank investors based on the total enterprise value (EV) acquired. We get the EV acquired by multiplying the number of deals by median EBITDA at acquisition and a market multiple. The median portfolio EBITDA calculation only includes companies with at least 2 positive EBITDA values.
Related Research
Discover our proprietary reports on investors, assets and PE deals.