The Private Equity Value Creation Report
From Entry to Exit: How Do PE Firms Create Value?
2025

Executive Summary
What separates the best private equity deals from the rest? Which sectors consistently outperform, and why? How has value creation changed over the years?
These are just some of the questions that led us to analyze data from over 10,000 private equity investments globally for our latest “Private Equity Value Creation” report. Here's a summary of our key findings:
Revenue growth is the largest driver of PE value creation, contributing on average 54% of value creation. Multiple expansion contributes significantly at 32%, while margin expansion plays a smaller role at 14%. Given the recent downward pressure on multiples, revenue growth has become an even more critical driver of success.
Buy-and-build is central to PE value creation. Companies with a more active buy-and-build strategy deliver higher returns across all performance quartiles. When done right, buy-and-build bolsters all three value creation drivers: revenue growth, margin expansion, and multiple expansion.
Companies with higher revenue growth rates generate significantly higher investment returns. Growth amplifies other value drivers as well, particularly exit multiples. Fast-growing companies typically command 30-50% higher multiples at exit.
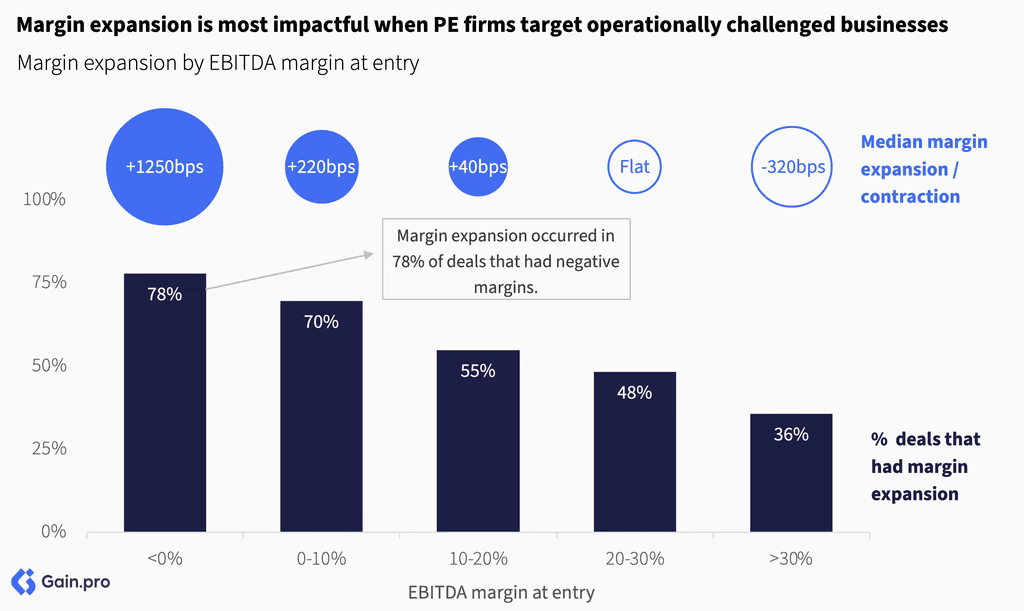
Margin expansion is most impactful when PE firms target operationally challenged businesses rather than already-efficient businesses. 78% of deals with negative entry EBITDA margins achieved margin expansion.
Multiple expansion is more common for smaller deals under $100M EV. This reflects both lower initial valuations and uplift as companies achieve scale. By sector, TMT, Science & Health, and Services see the largest multiple expansion.
If you have any questions about the data or the report, do not hesitate to reach out to insights@gain.ai.


Chapter 01: Value Creation Drivers
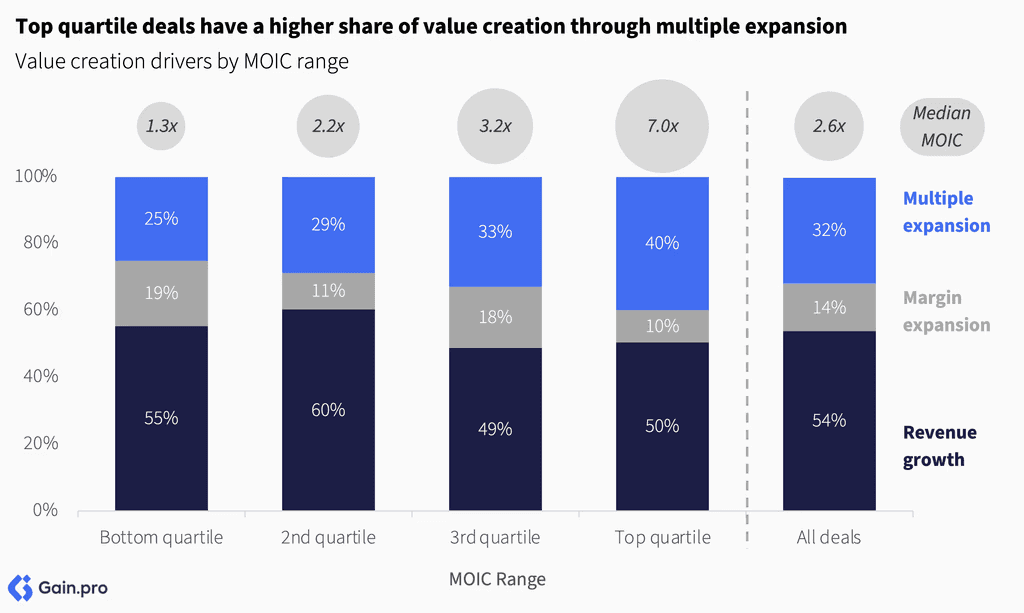
Revenue growth is the largest driver of PE value creation. On average, it accounts for 54% of value creation for PE deals. Multiple expansion contributes significantly at 32%, while margin expansion plays a smaller role at 14%.

Multiple expansion's contribution to value creation has declined in recent years. It contributed to ~40-45% of returns in 2019-21, driven by higher exit multiples and attractive entry valuations. However, as exit multiples have come down, revenue growth has clearly become the primary driver of value creation (~65-70%). We expect revenue growth to remain the key driver going forward as multiples remain under pressure in this higher-for-longer interest rate environment.

Top quartile deals have a higher share of value creation through multiple expansion. On average, they realize 40% of their value through multiple expansion compared to just 25% for bottom quartile deals. While growth is paramount, this shows that entry valuations matter too.
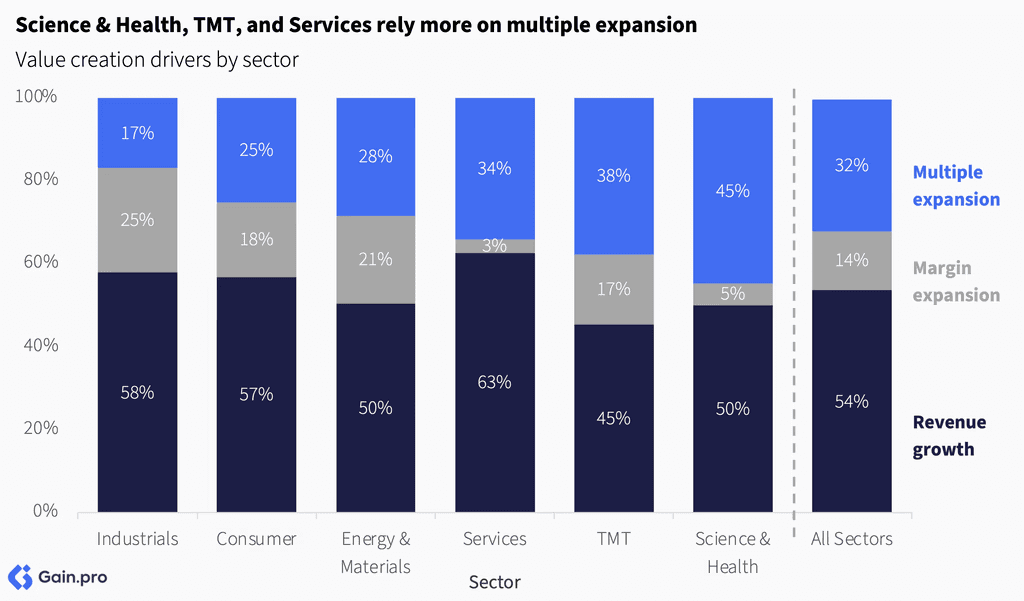
By sector, Science & Health, TMT, and Services rely more on multiple expansion. Valuations in these high-growth, high-margin sectors have risen in the last few years as more capital flowed in, driving multiple expansion. In contrast, Industrials, Consumer, and the Energy & Materials sectors have seen moderate levels of multiple expansion, with more value created through revenue growth and margin expansion. Despite these differences, revenue growth remains the largest component of value creation across all sectors.
Compared to other deal types, margin expansion drives a higher share of value creation in public-to-private deals. These deals involve mature, scaled companies that offer the greatest potential for cost optimization and operational improvements. Similarly, carve-outs show higher margin expansion versus other deal types as they typically involve non-core and underinvested units. In comparison, sponsor-to-sponsor and family-to-sponsor deals rely more on revenue growth, with family businesses also offering some potential for margin expansion.

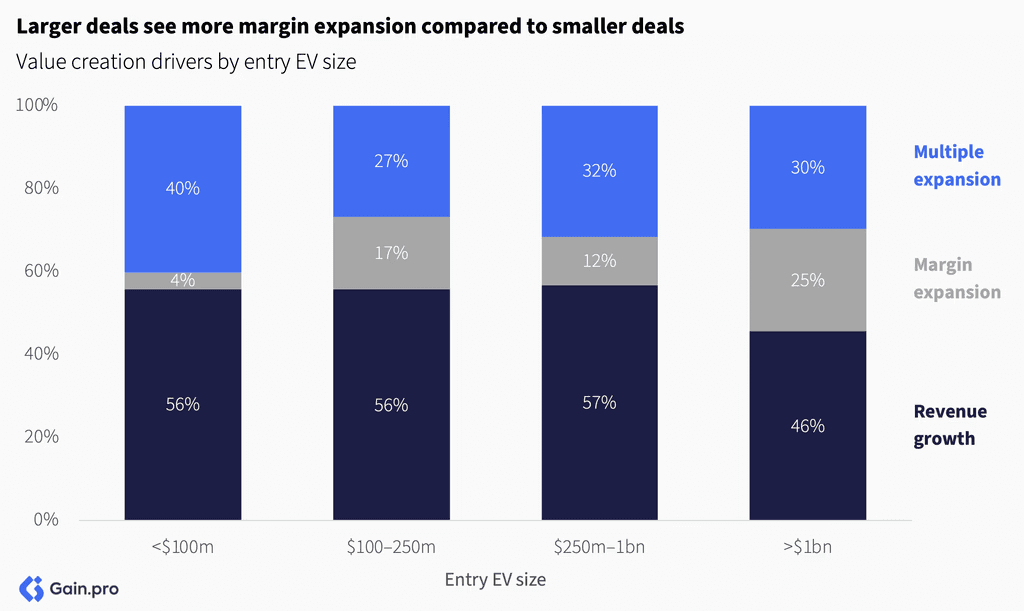
Larger deals see more margin expansion compared to smaller deals. Scale provides greater opportunities for cost optimizations and operational improvements. In contrast, smaller deals tend to create more value through revenue growth and multiple expansion.
Revenue growth accounts for a larger share of value creation for longer held assets. Shorter exits, in contrast, are more heavily influenced by valuations and market timing. Often, these shorter exits stem from strategic buyers or other financial sponsors who missed the initial acquisition opportunity and subsequently make premium offers to acquire these assets.

Company in Spotlight

Location
United States
Industry
Building Materials
Owner(s)


CHI Overhead Doors is a US-based manufacturer of residential, commercial, and industrial garage doors. It offers a wide range of products including insulated, rolling steel, and high-performance rubber and vinyl doors. Headquartered in Arthur, Illinois, the company serves the wholesale building materials market through a dealer-focused model, with an emphasis on product customization and shorter lead times.
Founded in 1981, CHI's private equity journey began in 2002 with Long Point Capital, followed by successive ownership under JLL Partners (2004–2011) and FFL Partners (2011–2015). However, the company's most transformative chapter commenced in 2015 when KKR acquired a majority stake for $685 million, structured as 40% equity and 60% debt.
KKR's acquisition marked a fundamental shift in CHI's operational philosophy. It brought in new leadership, established clear priorities, and introduced rigorous process orientation throughout the organization.
Most importantly, KKR democratized equity ownership across the entire workforce. Prior to KKR's ownership, only 18 of the company's 800 employees held equity stakes. Post-acquisition, all 800 employees—including over 600 hourly wage workers—received equity participation.
Under KKR, workplace safety and conditions improved dramatically, with incident rates declining by 50%. The company abandoned traditional seasonal hiring and firing practices in favor of a through-the-cycle approach to employee retention, creating job security and workforce stability.
In addition to this, KKR and CHI worked through multiple levers to expand sales and margins. The company focused on marketing using more sophisticated online and data-driven sales tools, and prioritized regions and customer profiles where CHI was most profitable. They renegotiated contracts and introduced lean manufacturing and Kaizen principles. The company also expanded capacity by opening a new plant.
These initiatives resulted in strong financial performance. By 2022, CHI's EBITDA had grown more than 3.5x from $61 million to $229 million, while EBITDA margins expanded over 1400 bps from 20.5% to 35%. The company achieved 2.2x organic revenue growth over the investment period, with employee engagement surging from 30% to 84%, and working capital as a percentage of sales declining from 12% to 3%.
In June 2022, KKR executed one of its most successful exits, selling CHI to Nucor Corporation for $3.0 billion at a 13x EBITDA multiple. The transaction generated exceptional returns with a gross MOIC of 9.8x and IRR of 42.3% (net 8.0x and 36.2% respectively).
The employee ownership structure ensured that value creation was broadly shared. Employees averaged approximately $175,000 in equity payouts, with tenured employees and some truck drivers earning substantially more (~$800,000).
Chapter 02: Returns and Loss Rates
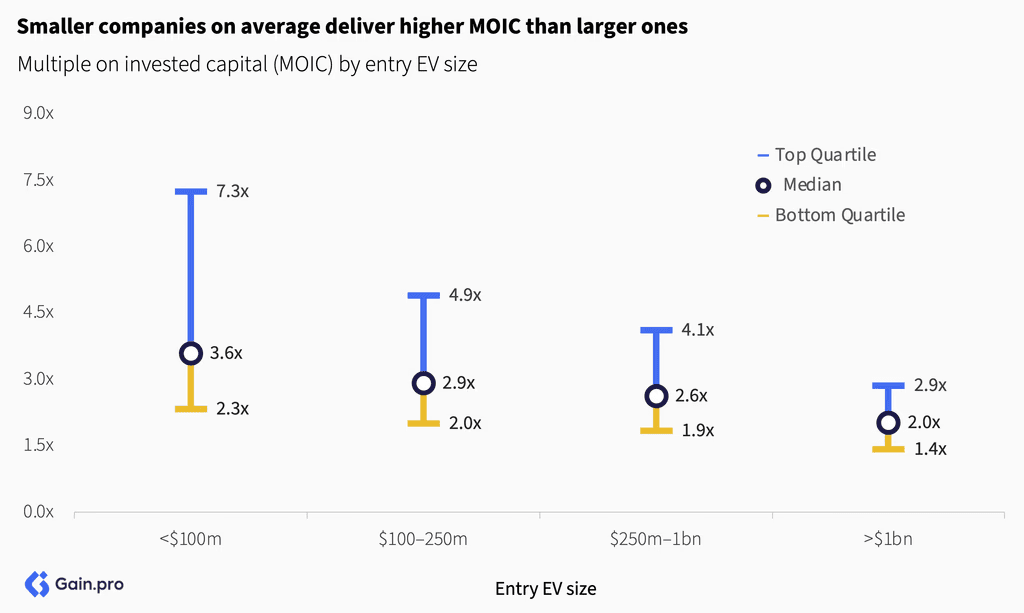
Smaller businesses on average deliver higher MOIC compared to larger ones. They benefit from higher growth rates and lower entry multiples compared to large, mature enterprises. On the other hand, larger deals do offer more predictable returns with less variance compared to smaller deals.
By sector, MOIC is highest in TMT (median of 3.1x), followed by Science & Health (2.7x), and Services (2.6x). These three sectors are among the fastest-growing, with strong investor appetite. On the other hand, Energy & Materials and Industrials show more modest returns. These capital-intensive sectors also tend to have longer holding periods (~1 year longer on average).

By deal type, MOIC is highest in family-to-sponsor deals (2.9x). These businesses are typically in their earlier stages of growth and on average have lower entry valuations. Sponsor-to-sponsor deals, on the other hand, offer slightly lower returns (2.7x) but more predictable outcomes, while carve-outs deliver the lowest returns (2.3x) of all deal types.

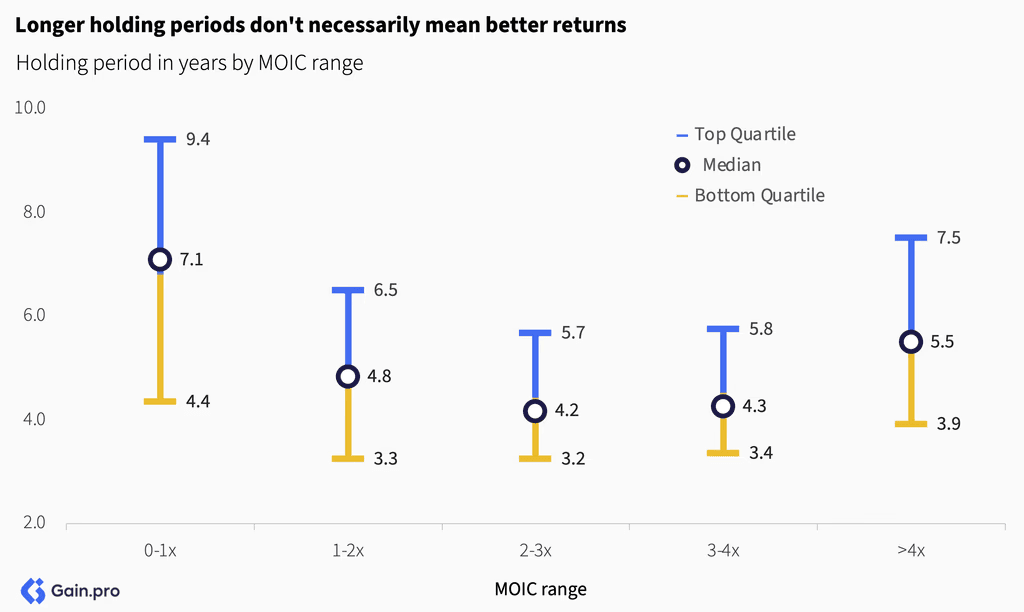
Companies held longer are usually the best performers or the worst. Investors hold onto the best-performing assets for greater upside but also hold the worst, trying to fix the business or hoping for a market turnaround, though exits often become difficult for these struggling investments.

The longer you hold an investment, the lower the IRR despite higher absolute returns. For example, doubling your money in 2 years delivers a 41% IRR, while tripling it in 8 years yields only 15% IRR. This creates a fundamental tradeoff between a higher MOIC and a higher IRR, and whether you let your winners run.

Company in Spotlight

Location
France
Industry
Biotechnology
Owner(s)


Polyplus is a developer and manufacturer of bioreagents, specializing in transfection reagents used to deliver nucleic acids (DNA, mRNA, siRNA, RNP) into target cells. Its in vitro and in vivo products are applied in cell and gene therapy (CGT), immunotherapy, and vaccine development — including gene expression, RNA interference, genome editing, protein delivery, and viral vector production.
The company’s private equity journey began in 2016 when ARCHIMED’s MED I fund acquired a 90% stake, valuing the business at under €10m. In 2020, it sold half of its position to Warburg Pincus at a €550m valuation, realizing a ~70x MOIC. The remaining stake was split across MED I, successor fund MED II, and the PolyMED continuation vehicle. In 2023, Polyplus was sold to strategic buyer Sartorius Stedim at a €2.4bn EV, marking a >300x MOIC for MED I and >4.5x returns for MED II, PolyMED, and Warburg Pincus.
Founded in 2001 as a University of Strasbourg spin-off, Polyplus initially served academic labs with research-grade reagents. Post-ARCHIMED, the company was transformed into a commercial bioprocessing leader with a fast-growing CGT client base. It accelerated product development, expanded to the U.S. market, ramped up GMP-compliant manufacturing and increased direct sales. Between 2016 and 2023, Polyplus grew EBITDA by ~130x and revenue from ~€5m to over €75m.
Companies with negative revenue growth had the highest loss rate at ~25%, while companies with higher growth rates (>10% CAGR) had much lower loss rates at ~2%. This makes intuitive sense since declining revenue makes companies less attractive to potential buyers, resulting in more challenging exits, multiple contraction, and longer holding periods.

By sector, loss rates are highest in Industrials (9%), Consumer (8%), and Services (7%). TMT has the lowest loss rates at 5%. By subsector, Retail (Consumer) shows the highest loss rates at 12%, impacted by the structural shift to e-commerce, COVID, high fixed costs, and intense competitive pressures.

By deal type, loss rates are highest in carve-outs (11%) and public-to-private (9%) deals. These higher loss rates reflect slower growth, concentration in cyclical sectors such as Industrials and Energy & Materials, and operational complexities. In contrast, family-to-sponsor (6%) and sponsor-to-sponsor (5%) have lower loss rates in part due to higher growth rates within these deal types.

Longer holding periods don't necessarily mean better returns. In fact, we see a barbell effect in assets held the longest. They include the biggest winners and the biggest losers, while those held in the 3-6 year range tend to cluster around more predictable, moderate returns
Chapter 03: Revenue Growth
Companies with higher revenue growth rates generate significantly better investment returns compared to slower growing ones. The median MOIC for companies growing >30% CAGR is 4.0x. It nearly halves to 2.3x for companies growing in the 0-10% range, with significant downside risk for those with negative growth.

Higher growth also drives value creation through an increase in multiple. Fast-growing companies typically command 30-50% higher multiples at exit, driving an uplift in valuation. This is true across assets of all sizes and sectors.

Not just that, companies with positive revenue growth are more likely to achieve margin expansion too. 58% of growing companies experience margin expansion (median of +130bps) versus only 44% of companies with negative growth. This makes intuitive sense — growing companies benefit from operating leverage as revenues scale faster than costs.

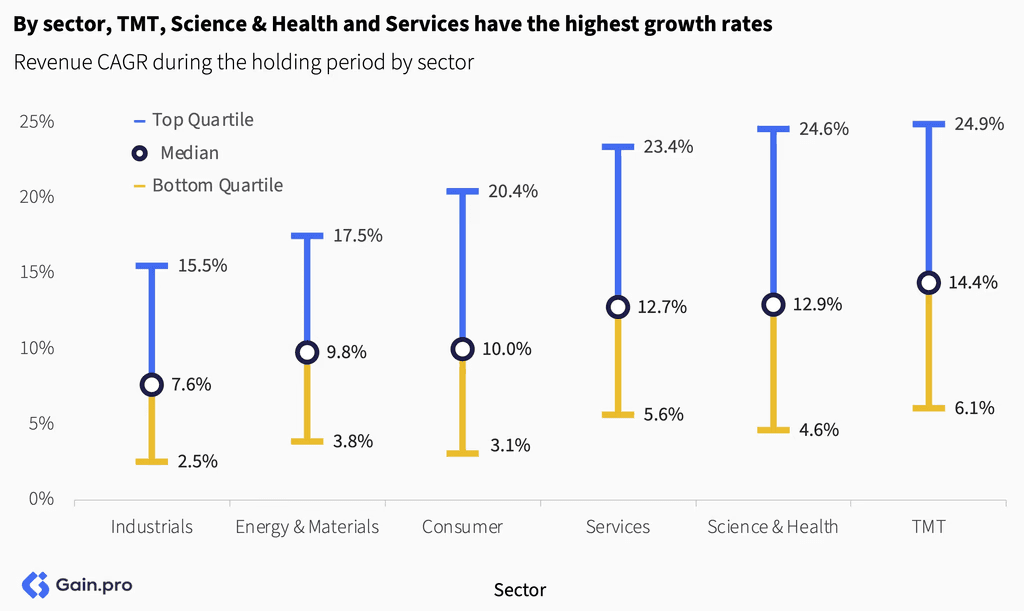
By sector, TMT, Science & Health, and Services have the highest growth rates, while traditional sectors with larger, asset-heavy operations such as Industrials, Energy & Materials, and Consumer showcase slower growth. At the subsector level, Software, Professional Services, and Healthcare Services lead, in contrast to slower-growing Consumer Goods, Food, Retail, and Manufacturing.
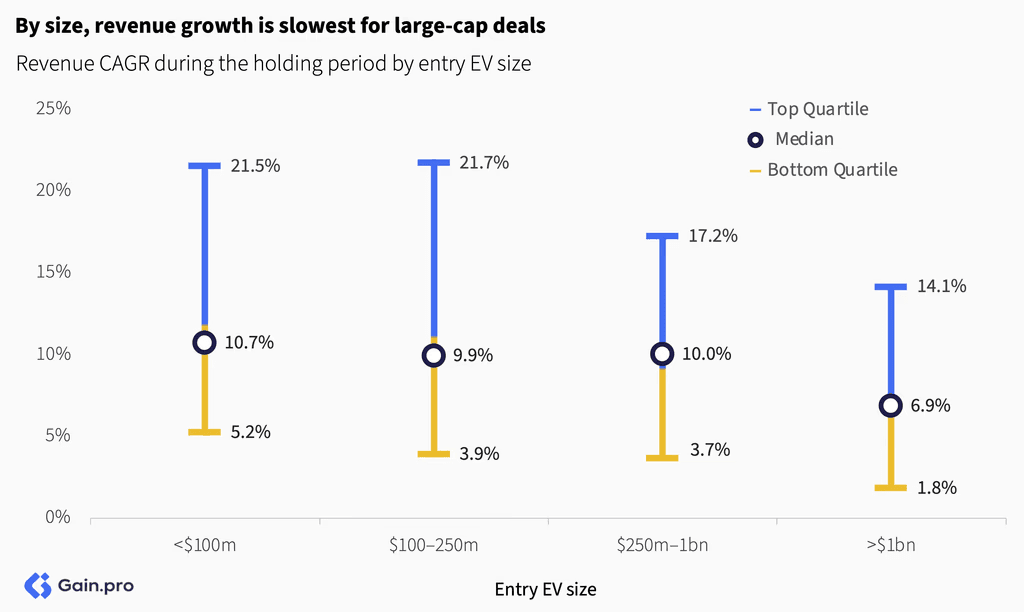
By size, revenue growth is slowest for large-cap deals. Median CAGR drops from 10% for sub-$1bn entries to 6.9% for deals >$1bn. Since revenue growth is the largest value driver, slower growth directly limits the return potential for these deals.
By deal type, revenue growth is strongest in family-to-sponsor deals. Family-owned businesses often have untapped growth potential (M&A, geographic expansion, new markets) and hence tend to scale faster. Public-to-private deals, on the other hand, are often the largest and grow more slowly. Carve-outs also lag, often reflecting mature business units in Industrials and Energy & Materials.

Company in Spotlight

Location
Netherlands
Industry
Retail
Owner(s)

Action is a non-food discount retailer offering simple, functional products at very low price points. The company sources directly from manufacturers and suppliers across Asia and Europe. It's rotating assortment has approximately 6,000 SKUs with around two-thirds of the products priced below €2. Action targets mass-market consumers focused on convenience and affordability.
Action was founded in 1993. In 2011, it was acquired by 3i Group for c. €650m at an c. 8x EBITDA multiple, Partners Group invested alongside 3i in a minority capacity. In 2019, 3i's Eurofund V and Partners Group sold their stakes, with Hellman & Friedman joining as a minority investor. The deal valued the company at €10.3 billion. As of FY2025, 3i’s stake in the business stands at ~58%.
3i’s 2011 entry marked the beginning of a long-term investment strategy that prioritized operational value creation and selective liquidity events over a traditional exit path. As of March 2025, it had received >€5.5 billion across nine dividend recapitalizations, including c. €1.9 billion in FY2025. Since initial investment, 3i has achieved a reported gross money multiple of ~159x (or well over 40% IRR). Further, Action contributed 32% of 3i’s gross investment return, based on the opening portfolio value. As of the same date, 3i’s stake was valued at ~€21 billion, or 76% of the firm’s private equity NAV (18.5x multiple applied to c.€2.3bn run-rate EBITDA).
Action’s financial and operational profile has changed substantially over the holding period. Revenue increased from approximately €600 million in 2010 to ~€14 billion in 2024, implying a 25% CAGR. EBITDA rose from ~€70 million to more than €2.1 billion (29% CAGR). The company expanded from 245 stores in Benelux to ~2,900 locations across 13 countries, with the majority of sales now generated internationally. Further, annual store openings increased from 20–25 prior to 3i’s investment to 352 in 2024. Supporting this expansion, the company built out a pan-European logistics footprint comprising 15 distribution centers and 3 cross-docking hubs. Its sourcing model also evolved—from a Netherlands-only base to direct procurement operations in Asia.
Action stands out as a rare case of long-term private equity ownership delivering sustained, large-scale value creation. Its growth trajectory, strategic reinvestment, and consistent operational execution make it a widely cited example of high-conviction investing. With a ~159x money multiple at this scale, Action is considered by many to be the most successful private equity investments in Europe—and potentially worldwide.
Chapter 04: Margin Expansion
Private equity firms target best-in-class family-owned businesses. PE firms today are mainly geared towards acquiring successful businesses and scaling them rather than acquiring underperforming businesses and turning them around. This is the reason why we don't see a higher contribution of margin expansion broadly. There isn't much room to operationally improve a top-quartile business.

Margin expansion is most impactful when PE firms target operationally challenged businesses rather than already-efficient businesses. 78% of deals with negative EBITDA margins achieved margin expansion (median +1250bps), while businesses with high EBITDA margins (>30%) typically saw margin contraction.
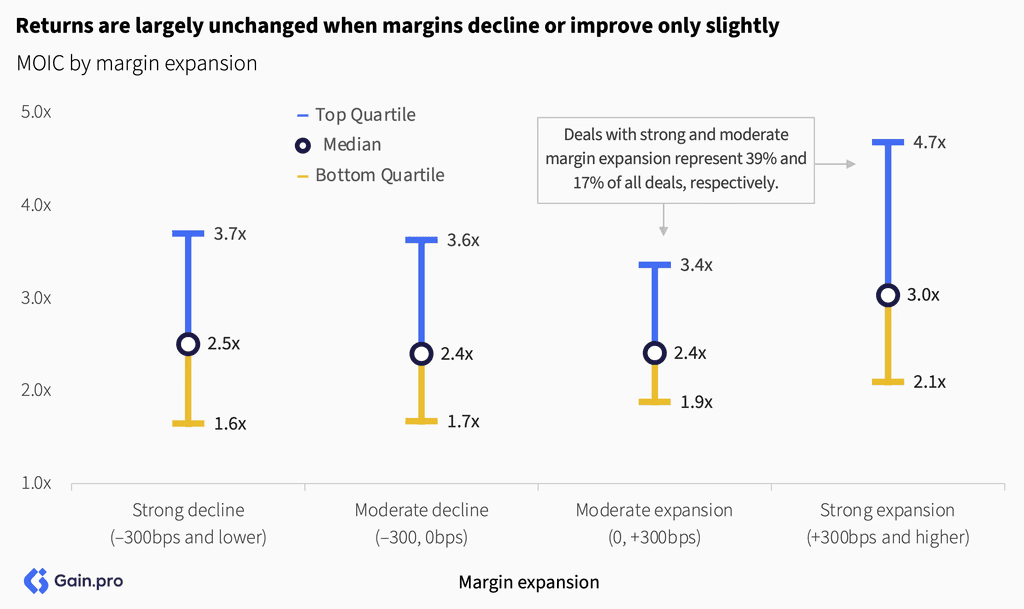
It's only when companies improve their EBITDA margins significantly (300+ basis points) that we see meaningfully higher returns. Returns are largely unchanged when margins decline or improve only slightly.
Divestitures boost margins. PE-owned businesses that divest underperforming units have a higher median margin expansion of +240bps vs. +70bps for those without. Multiple expansion is higher too (+3.3x vs. +2.5x). This divestiture activity is more common among larger businesses, with 23% of PE-owned businesses over $1bn revenue undertaking divestitures.

Large businesses ($1bn+ EV) deliver more margin expansion. They have more opportunities to spread fixed costs across a larger revenue base, and any operational improvements carried out at scale have a larger impact. In contrast, smaller companies (<$100M EV) show no margin improvement, as growth remains their top focus.

By sector, margin expansion is the highest in Energy & Materials, Industrials, TMT, and Science & Health. Energy & Materials and Industrials particularly benefit from their larger scale and asset-heavy nature, which creates more opportunities for operational optimizations. At the subsector level, the margin expansion is the highest in Leisure (+460bps), Biotech (+380bps), Chemicals (+310bps), and Education (+280bps), reflecting more opportunities for cost optimizations.

Margin expansion is strongest in public-to-private deals. These deals are typically large with inefficiencies that private equity can address without public market scrutiny and the pressure of quarterly earnings. As these transformations can often take time to fully materialize, public-to-private deals are held about a year longer on average compared to other deal types.

Contrary to common belief, most businesses grow their headcount during PE ownership. Only in large public-to-private deals do we see a significant portion (33%) of businesses reduce employee count. These companies often undergo a one-time operational reset, streamlining processes and reducing administrative layers.

Chapter 05: Multiple Expansion
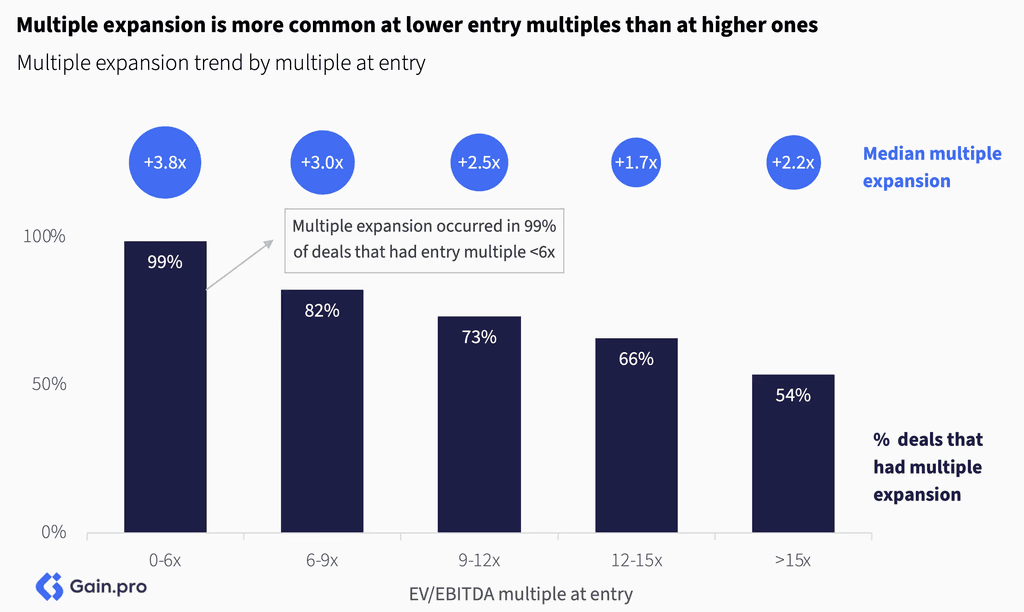
MOIC is highest for businesses with lower entry multiples. As entry multiples increase, the MOIC decreases and becomes more consistent. Finding attractively priced deals is not easy, as they typically occur only in the smallest transactions or during market dislocations (e.g., 2009). As multiples have expanded, such opportunities have become increasingly rare.

Multiple expansion is more common at lower entry multiples than at higher ones. 99% of all deals bought in the 0-6x EV/EBITDA range experienced positive multiple expansion, compared to only 54% of those purchased above 15x EV/EBITDA. The magnitude of expansion is also higher at lower entry multiples.
Multiple expansion varies by sector, with TMT, Science & Health, and Services seeing the largest expansion due to strong sponsor demand and higher growth rates. Traditional sectors such as Consumer and Industrials show minimal expansion, reflecting slower growth rates and limited competition for these assets.

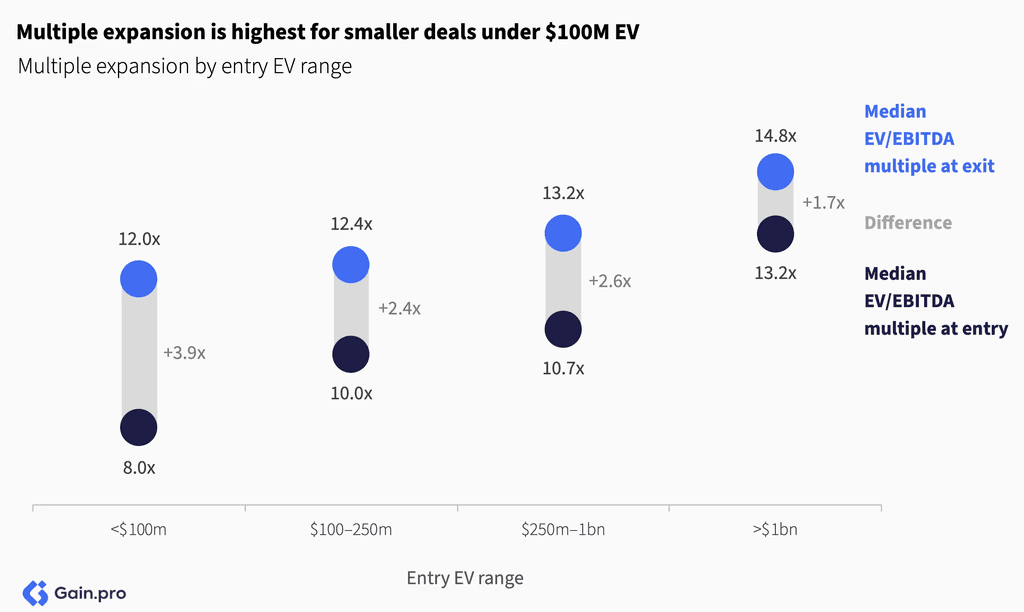
Multiple expansion is highest for smaller deals under $100M EV. This reflects both lower initial valuations and re-rating as assets achieve scale. Larger assets, on the other hand, experience lower expansion, constrained in part by higher entry valuations.
Public-to-private transactions deliver the highest multiple expansion (+3.5x), largely driven by discounted entry valuations and subsequent re-rating at exit following operational improvements. Carve-outs show the least multiple expansion, reflecting their concentration in sectors such as Industrials, which offer limited scope for valuation uplift. Family-to-sponsor and sponsor-to-sponsor deals both show similar levels of multiple expansion (~+2.7x).

Company in Spotlight

Location
United States
Industry
Financial Software
Owner(s)


Adenza, is a US based financial software provider offering mission-critical, cloud-enabled solutions across trading, risk, treasury, collateral, compliance, and regulatory reporting. It was formed in 2021, when Thoma Bravo acquired a majority stake in Calypso for $3.7bn and merged it with AxiomSL (acquired by Thoma Bravo in 2020 for ~$2bn).
Calypso Technology, the precedent company, was founded in 1997 as a cross-asset trading and risk management platform. Its private equity journey began in 2016 when Bridgepoint acquired a majority stake along with a minorty stake from Summit Partners. Under their ownership, Calypso's revenue base grew from $201m to $264m (2016 to 2020) and EBITDA grew from $80m to $142m (2016 to 2020). Thoma Bravo acquired a majority stake in March 2021 for an estimated EV of $3.7bn.
AxiomSL, meanwhile, offered cloud-based regulatory and risk reporting software,for major financial institutions. Thoma Bravo acquired a controlling stake in late 2020 for ~$2bn, attracted by the company’s strong market position, cloud-native architecture, and >20% organic growth rate.
AxiomSL and Calypso served distinct but complementary roles in the capital markets stack: Calypso offers front-office trading, collateral, and risk management plaform while AxiomSL enables post-trade risk and regulatory reporting. Thoma Bravo saw a strategic opportunity to unify these functions into a seamless, front-to-back capital markets platform. Despite the challenges posed by the pandemic, the integration was completed in six months, creating Adenza. The combination unlocked end-to-end data flow, accelerating cross-selling opportunties, pricing leverage, and cloud adoption — firmly establishing Adenza as a leading vertical SaaS platform in financial services.
By 2023, Adenza had established a solid financial profile—generating approximately $590m in revenue with a 58% EBITDA margin, 18% ARR growth, 98% gross retention, and 115% net retention. In June 2023, Thoma Bravo exited the business by selling a majority stake to Nasdaq at a $10.5 billion enterprise value—nearly doubling its estimated combined investment of ~$5.7 billion in AxiomSL and Calypso. The transaction implied ~18x revenue and ~31x EBITDA multiples. Thoma Bravo retained a 15% equity stake in Nasdaq and joined its board as part of its transaction.
Chapter 06: Buy-and-Build
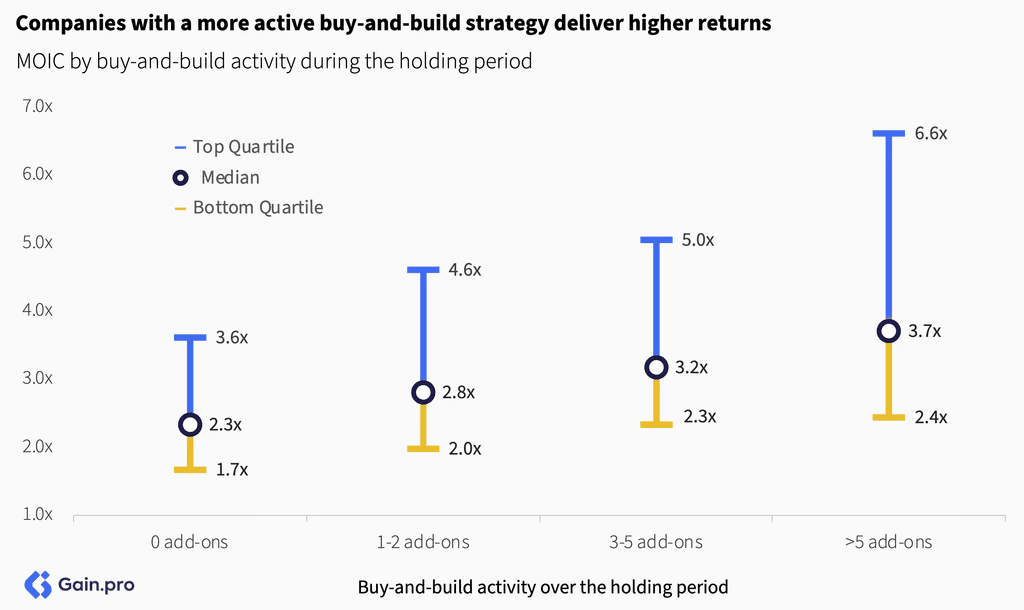
Companies with a more active buy-and-build strategy deliver higher returns across all performance quartiles. The median MOIC grows from 2.3x (no add-ons) to 3.7x (>5 add-ons). Buy-and-build strategies drive better returns by positively impacting all three value creation levers: revenue growth, margin expansion, and multiple expansion.
Buy-and-build works at any size but the uplift is strongest in small platforms. Smaller platforms benefit disproportionately from multiple expansion and accelerated revenue growth, starting from a lower base.

Companies with a more active buy-and-build strategy drive higher value creation through revenue growth. The reliance on multiple expansion decreases progressively, making these investments less susceptible to market downturns. However, successful integration and execution quality are important. Poorly executed acquisitions can destroy value regardless of strategy.

Revenue growth rates are higher for businesses with a more active buy-and-build strategy. Companies with over 5 acquisitions during the holding period grow at over 15% CAGR vs. 8% for those without. While this growth is partly inorganic, it drives scale and further organic growth through cross-selling opportunities and shared capabilities.

Margin expansion is the highest for those with a very active buy-and-build strategy (>5 add-ons over the holding period). Standalone platforms and small-to-medium buy-and-build platforms show more modest levels of margin improvement. We hypothesize that serial acquirers develop better integration capabilities over time, enabling them to extract greater cost efficiencies and synergies from each successive deal.

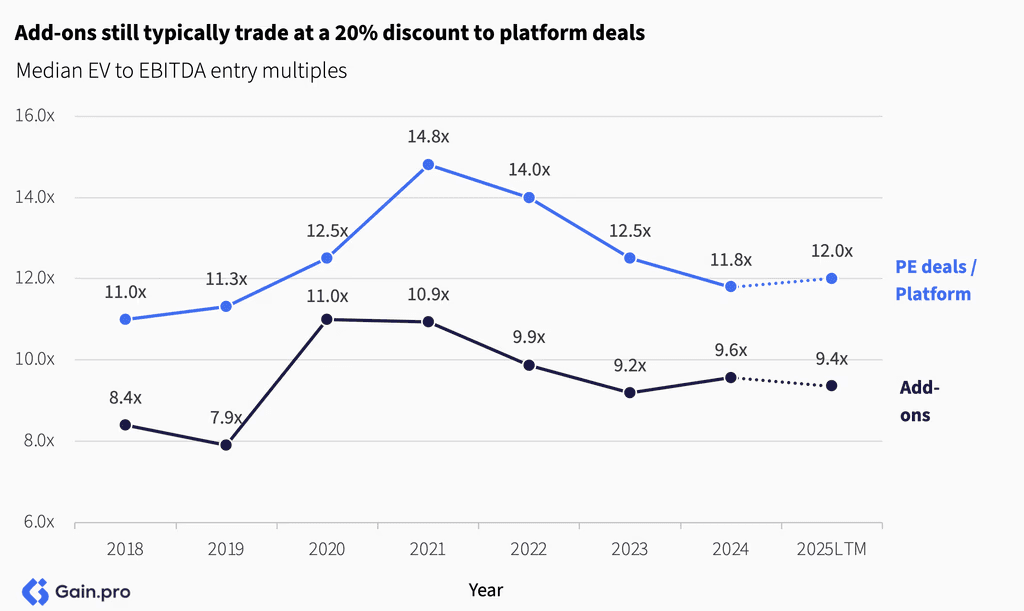
The multiple arbitrage strategy continues to work. Add-ons still typically trade at a 20% discount to platform deals due to their smaller size. PE firms acquire these smaller assets at lower valuations, integrate them to achieve scale, and benefit from the multiple uplift at exit.
Multiple expansion is higher for those with an active buy-and-build strategy (+3.5x on average vs. +1.8x for standalone investments). Buy-and-build strategies drive both revenue growth and scale, which leads to a higher multiple at exit.

Company in Spotlight

Location
Norway
Industry
Software
Owner(s)


Visma is a provider of business management software solutions focused on SMEs. The group’s business model revolves around developing cloud-based platforms for accounting, payroll, ERP, HR, and other administrative workflows, serving over two million clients across 33 countries.
Founded in 1996 through the merger of three Norwegian software firms, Visma was listed on the Oslo Stock Exchange before Hg took the company private in 2006. Since then, Visma’s enterprise value has grown from €550m to €19bn by 2023.
Visma’s sustained value creation has been driven by one of the most aggressive buy-and-build strategies in European software. Since 2002, the group has completed over 300 acquisitions. In recent years, Visma has maintained a steady pace of 30–40 add-ons annually, including 33 completed in 2024 alone.
The group integrates new acquisitions through a decentralized structure, with founders often choosing to stay with Visma. On average, 70% are still with Visma five years post-acquisition. Visma found that most companies go on to accelerate both revenue growth and margins under the new umbrella brand.
Visma today is majority-owned by Hg, with minority stakes held by ICG, TPG Capital, GIC, Warburg Pincus, CPP Investments, General Atlantic, and the management team, and is on track for one of the largest European IPOs.
Buy-and-build has gained popularity over the years. In 2025, 65% of deals exited had a buy-and-build component (up from 53% in 2020). 15% of businesses were serial consolidators, completing 5 or more deals during the holding period (up from 7% in 2020). This trend has been partly enabled by LP liquidity solutions such as single-asset continuation vehicles, which have allowed more time for consolidation strategies to work.

By sector, Financial Services and Services are the most active for buy-and-build. We see market fragmentation along with complexities in capturing organic growth as the key reasons for increased add-on activity in these sectors. In Financial Services, many asset managers and insurers pursue M&A to shore up their AUM and market share. Within Services, the biggest consolidators are in the Technical and Professional Services subsectors.

Methodology
The data for this report comes from Gain.pro. Our analysis covers over 10,000 private equity investments and exits globally over time. We include all transactions that led to liquidity, including partial exits.
We use the Shapley method of value decomposition to calculate the percentages for value creation drivers (revenue growth, margin expansion, and multiple expansion). We calculate each component's contribution across 6 permutations and average the results. This ensures that interaction effects are accounted for and that no component is favored due to sequencing.
For value creation analysis, we also exclude outliers and only analyze the data where all entry and exit metrics are available and there is positive total value creation.
We calculate MOIC as the ratio of exit equity value to entry equity value. Where equity values are not available, we estimate them using debt estimates at entry and exit.
Our dataset relies on publicly available deal sources, and as such, there might be an upward bias to our MOIC figures as the best-performing deals are typically reported more frequently than others.
All EBITDA-related aggregates, such as EBITDA margin and EV/EBITDA multiples, exclude Financial Services from calculations unless stated otherwise. EV/EBITDA multiples are based on trailing figures, while EBITDA margins represent the last reported values.
Related Research
Discover our proprietary reports on investors, assets and PE deals.