Executive Summary
In this report, we go deep into the PE landscape in Europe. We share insights on entries, exits, multiples, add-ons, holding periods, growth rates, margins and much more. Here is a summary of our key findings:
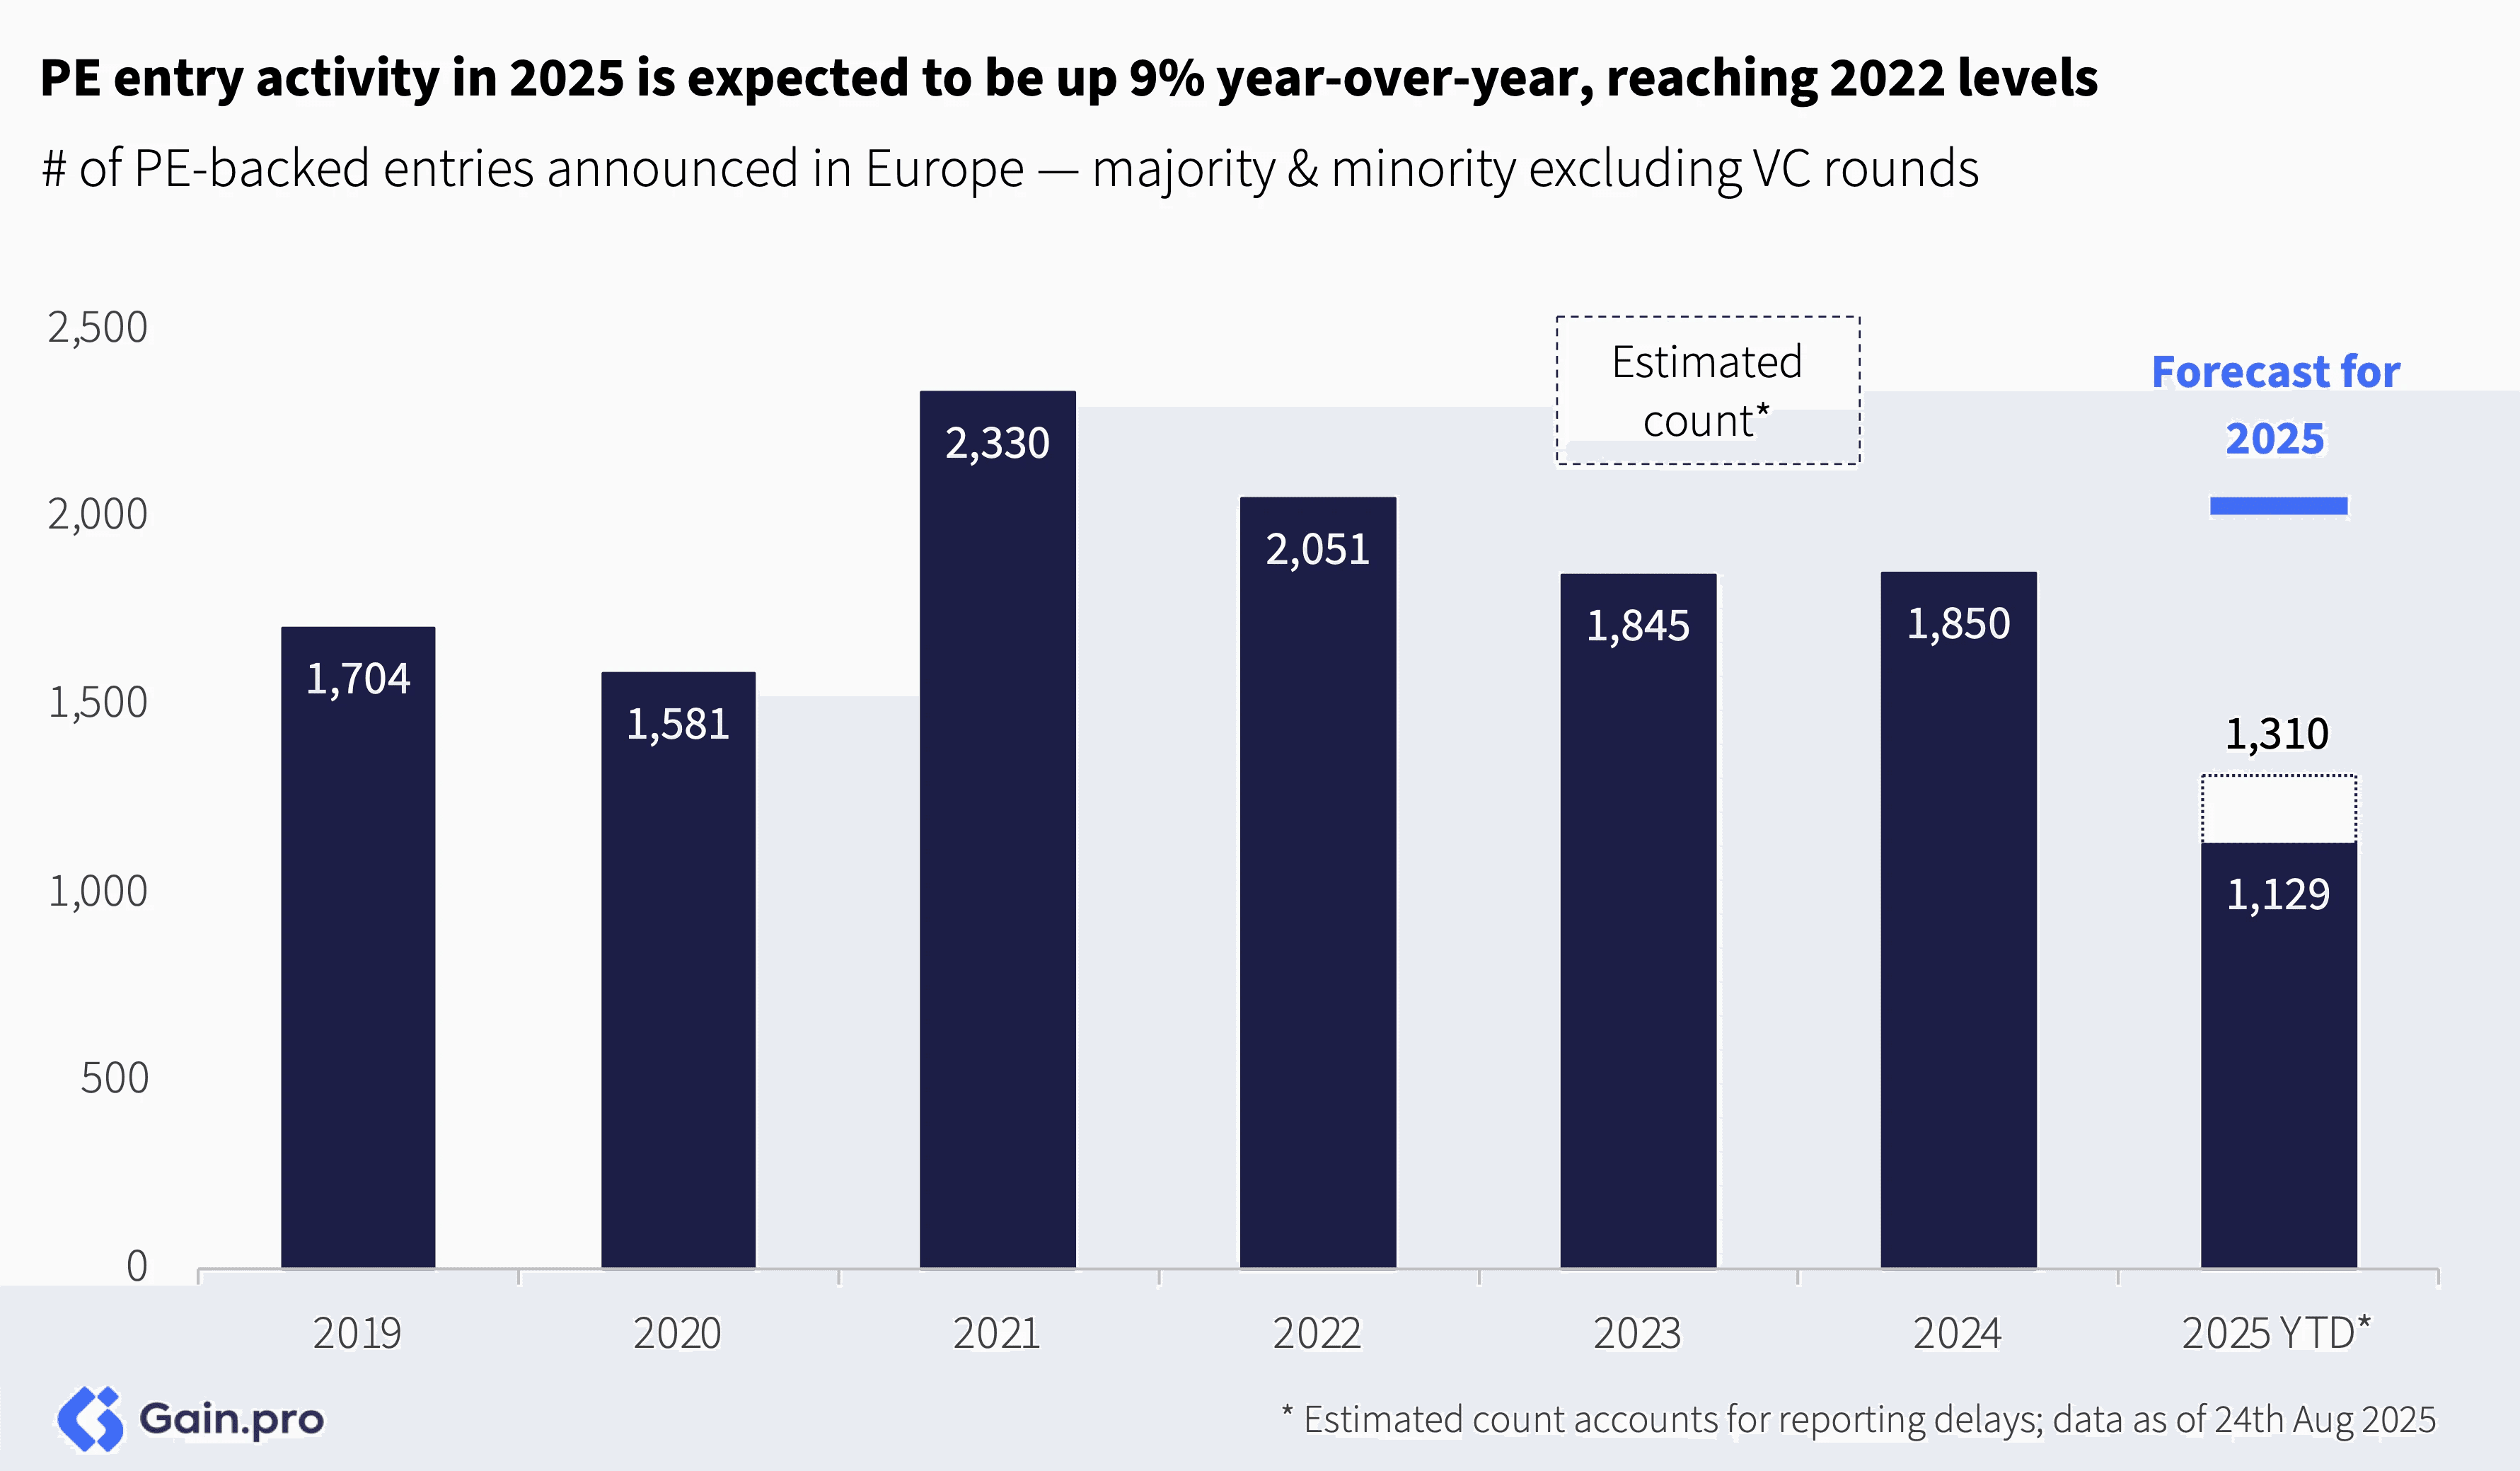
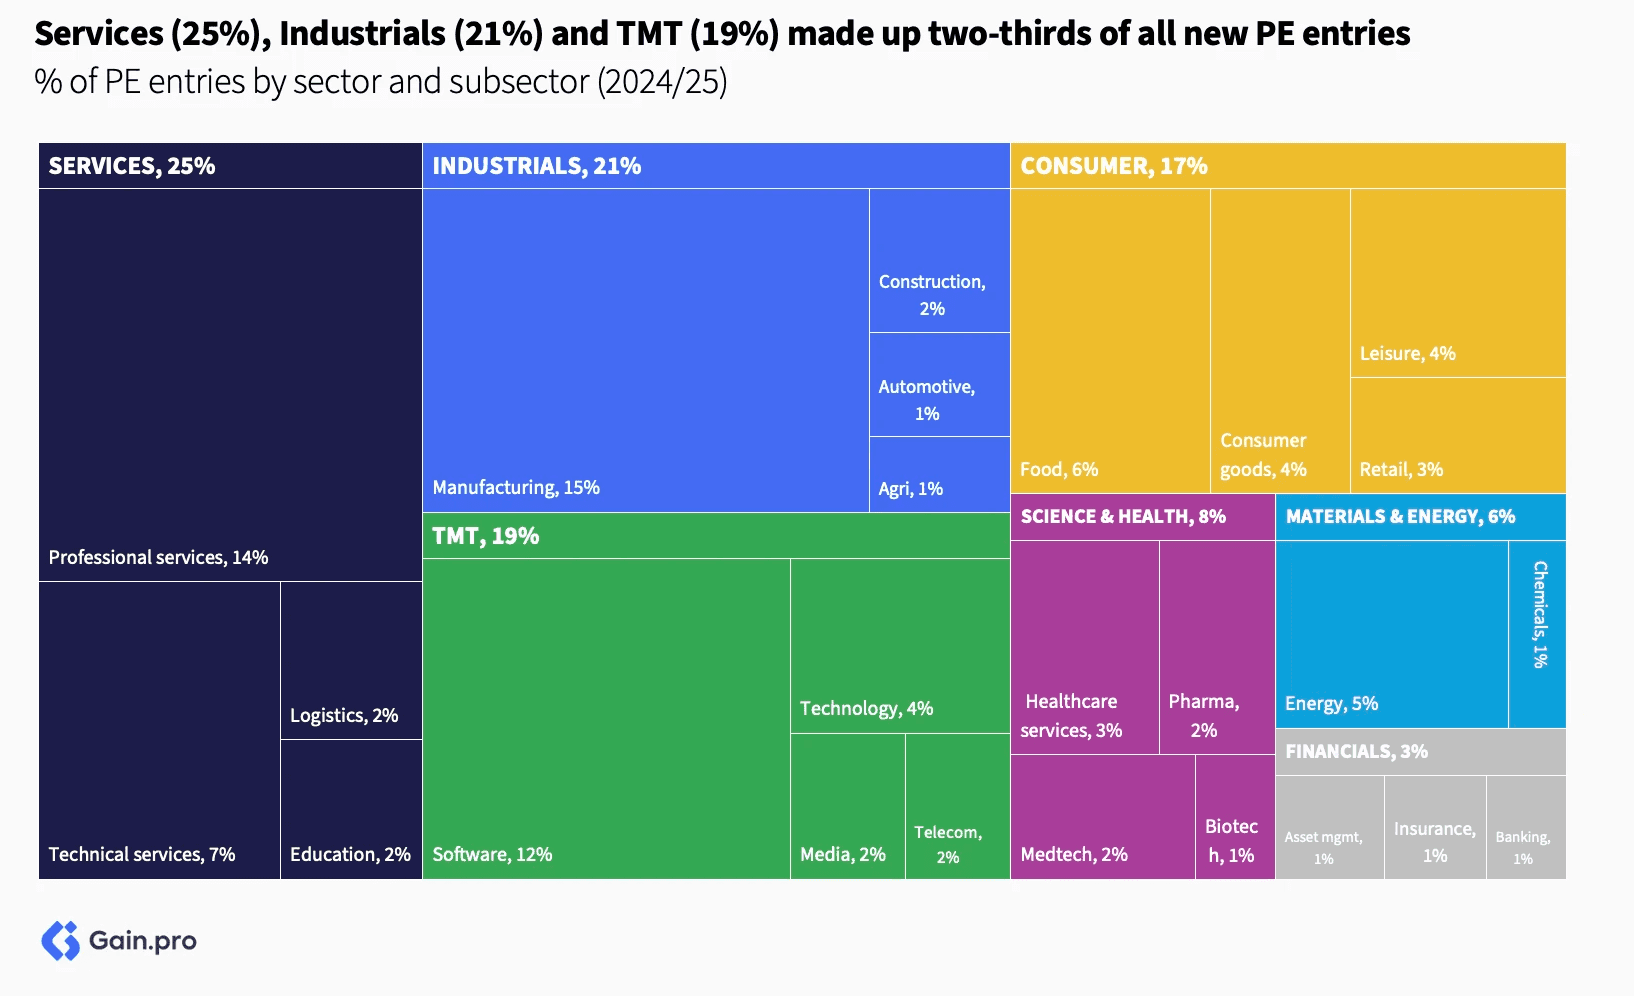
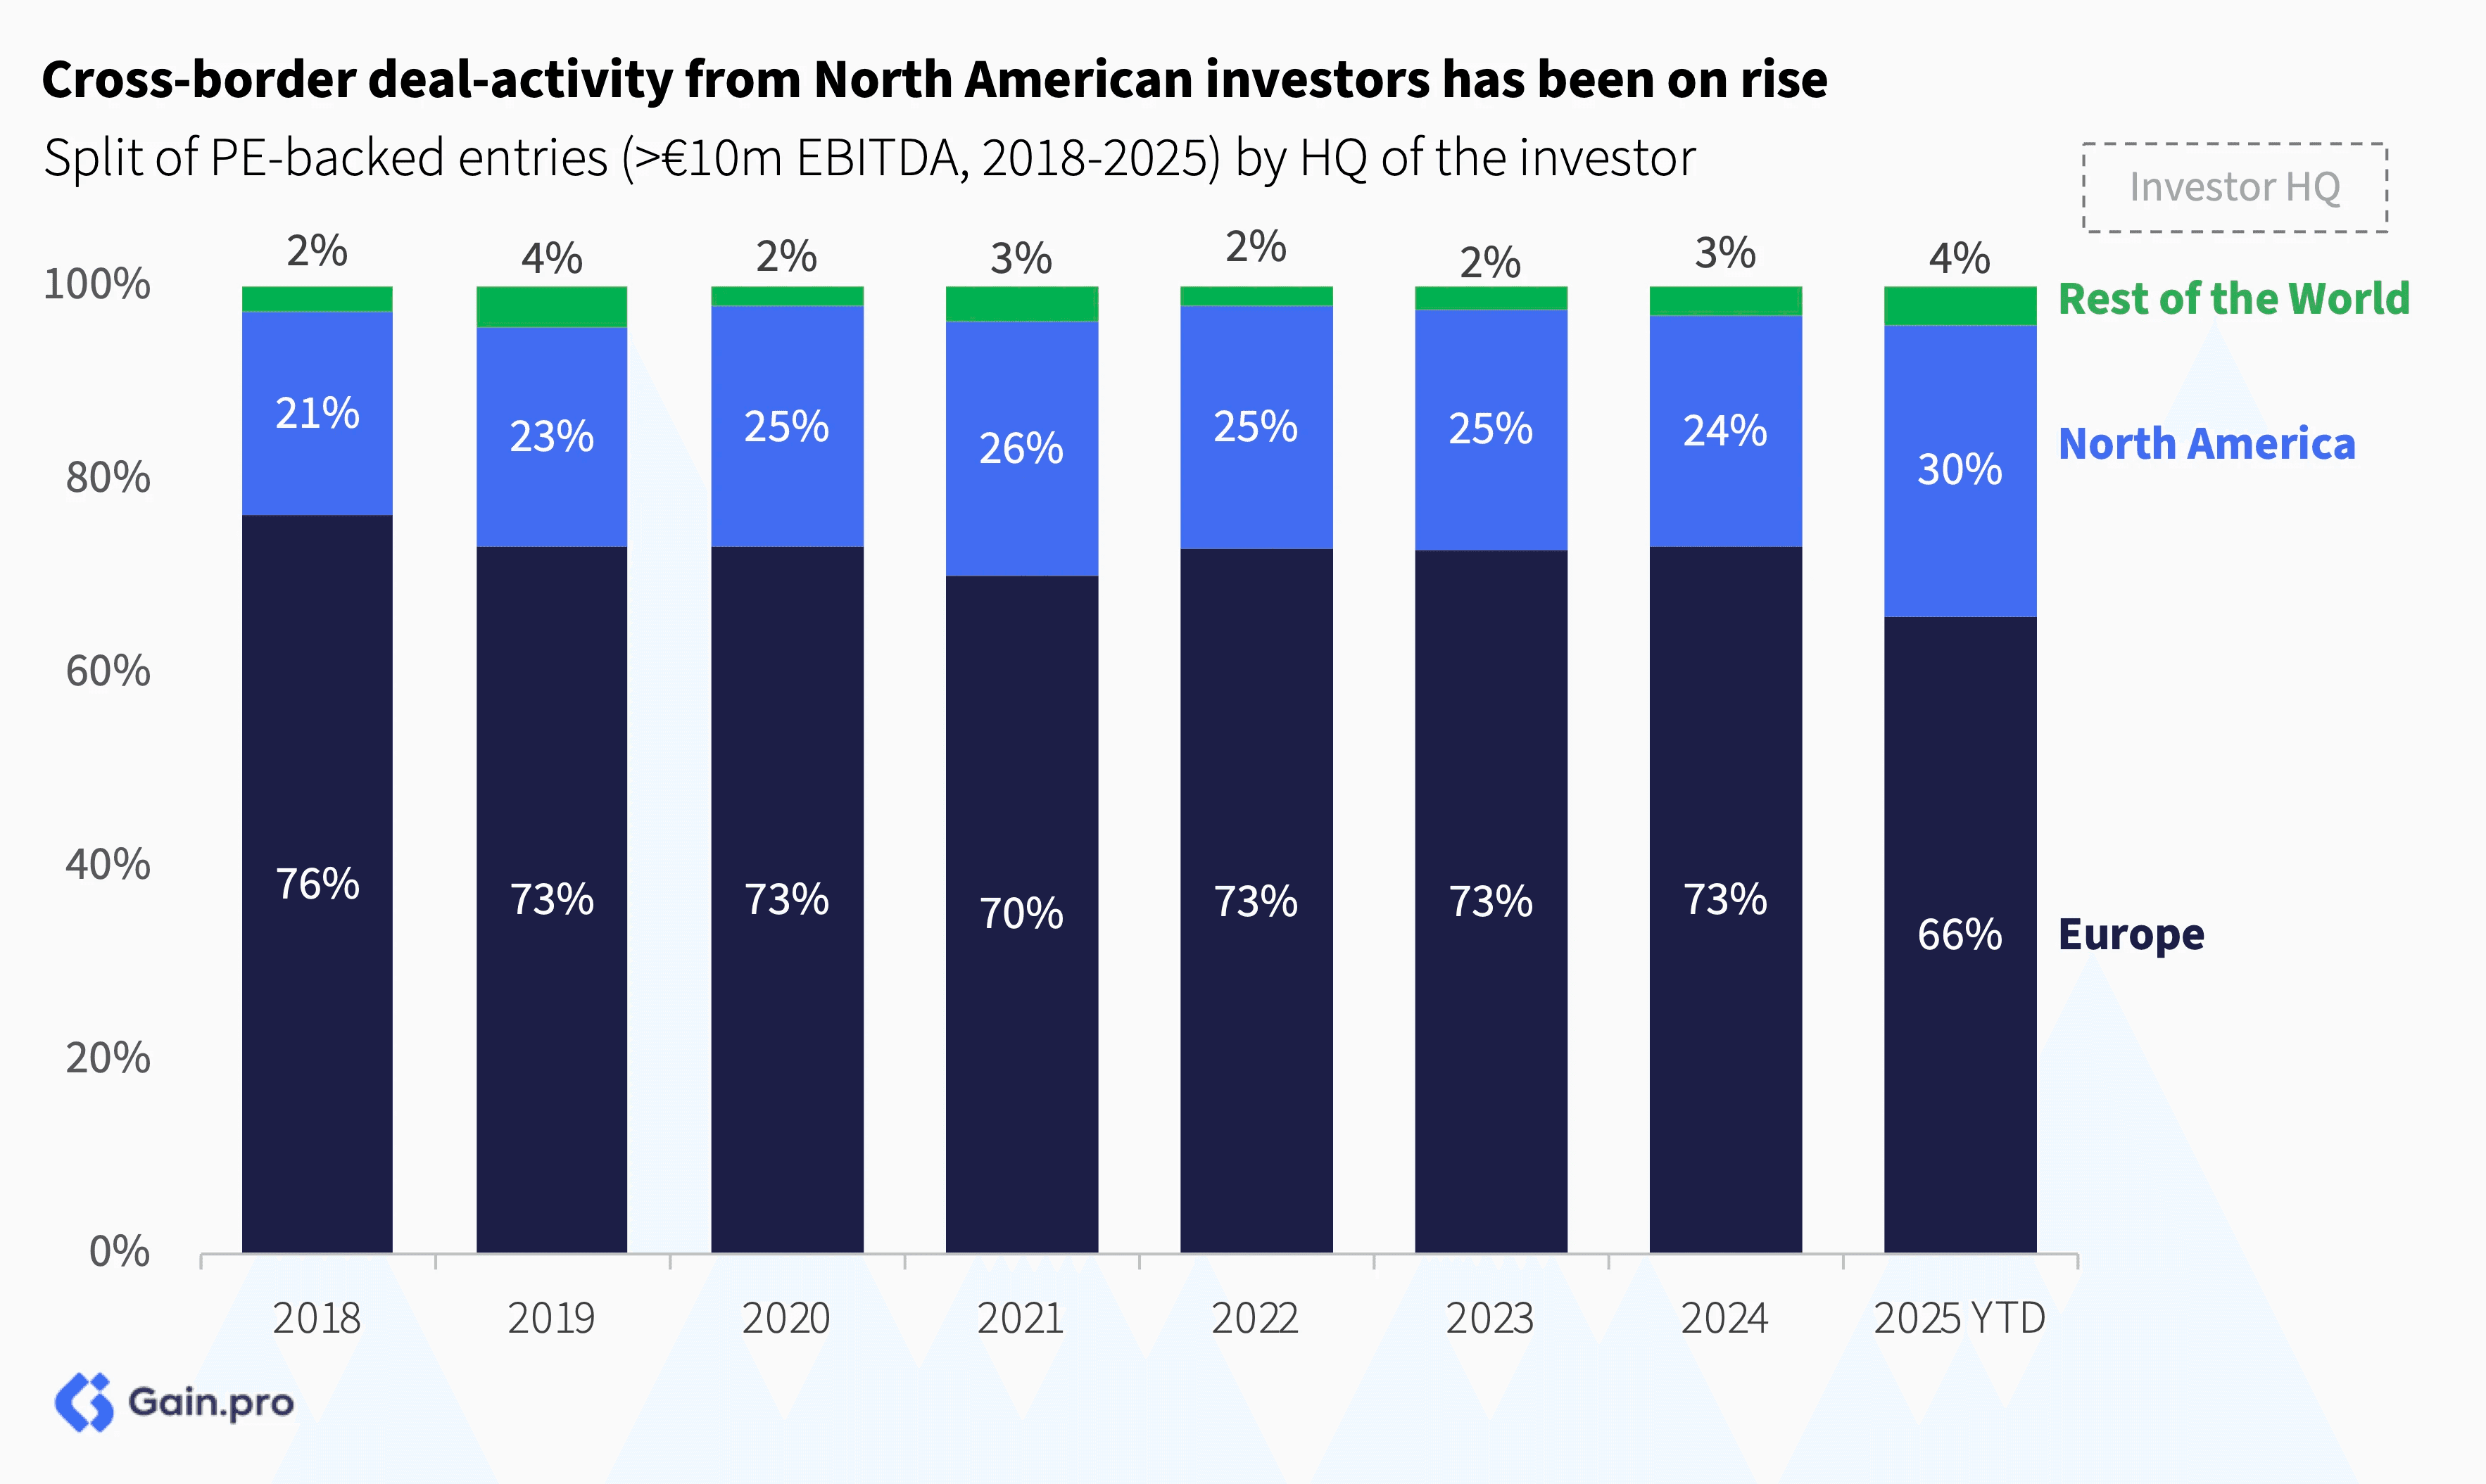
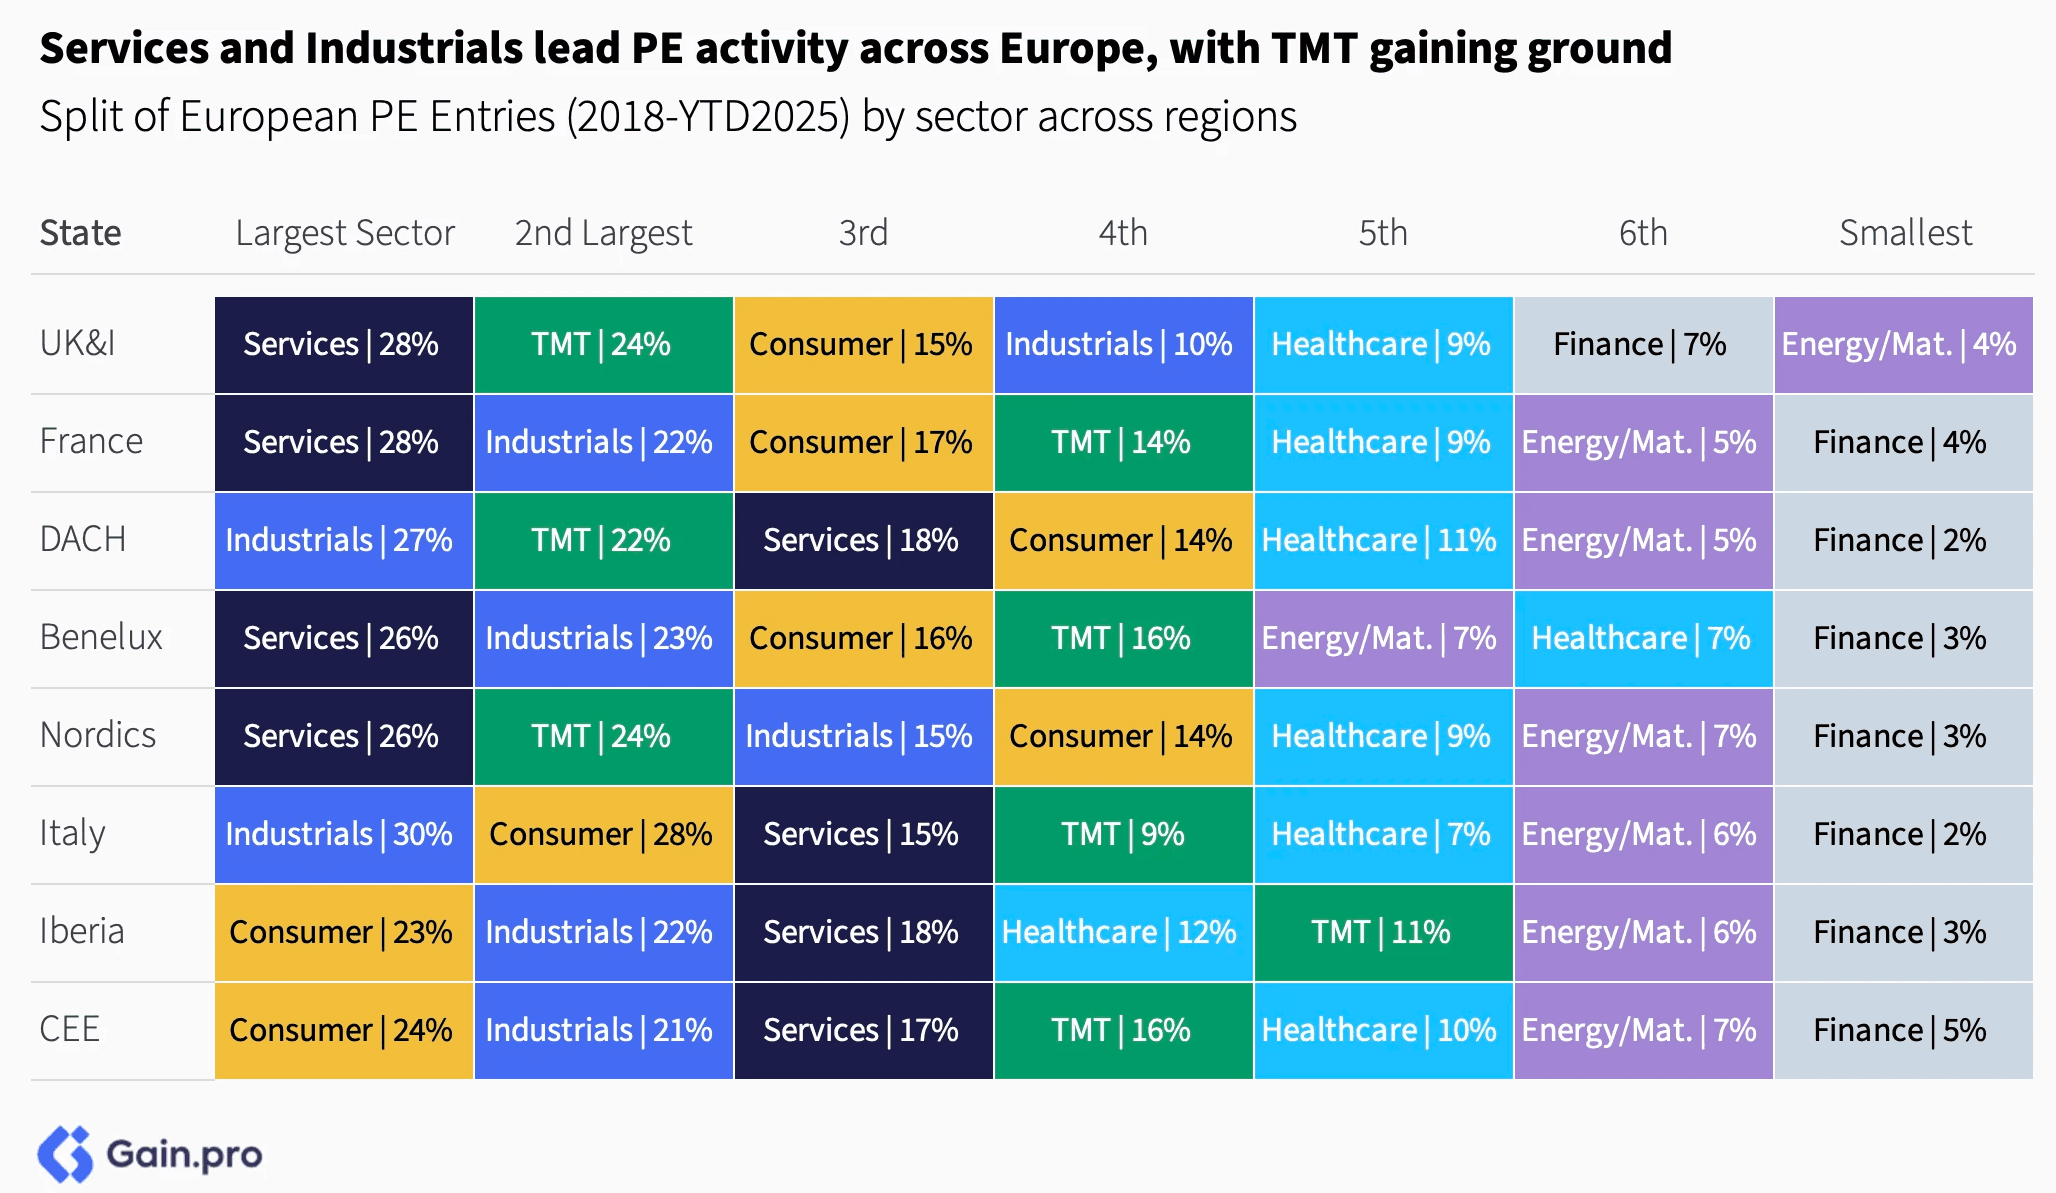
Entries — We expect entries to be up 9% yoy in 2025. Interest from North American investors has been particularly strong. They now account for 30% of all entries over €10m in EBITDA (up from 21% in 2018). By sector, Services (25%), Industrials (21%) and TMT (19%) together accounted for over two-thirds of all new PE entries.
Add-ons — Add-on deal activity in 2025 is flat vs. 2023 and 2024. The narrowing gap between add-ons and platform multiples, integration challenges and higher financing costs have tempered further growth.
Exits — PE exit activity slowed down in H1 2025, relative to H2 2024. Exits were particularly challenging in DACH, Benelux and CEE markets, with pace being slower in Industrials, Consumer and Science & Health at the sector level.
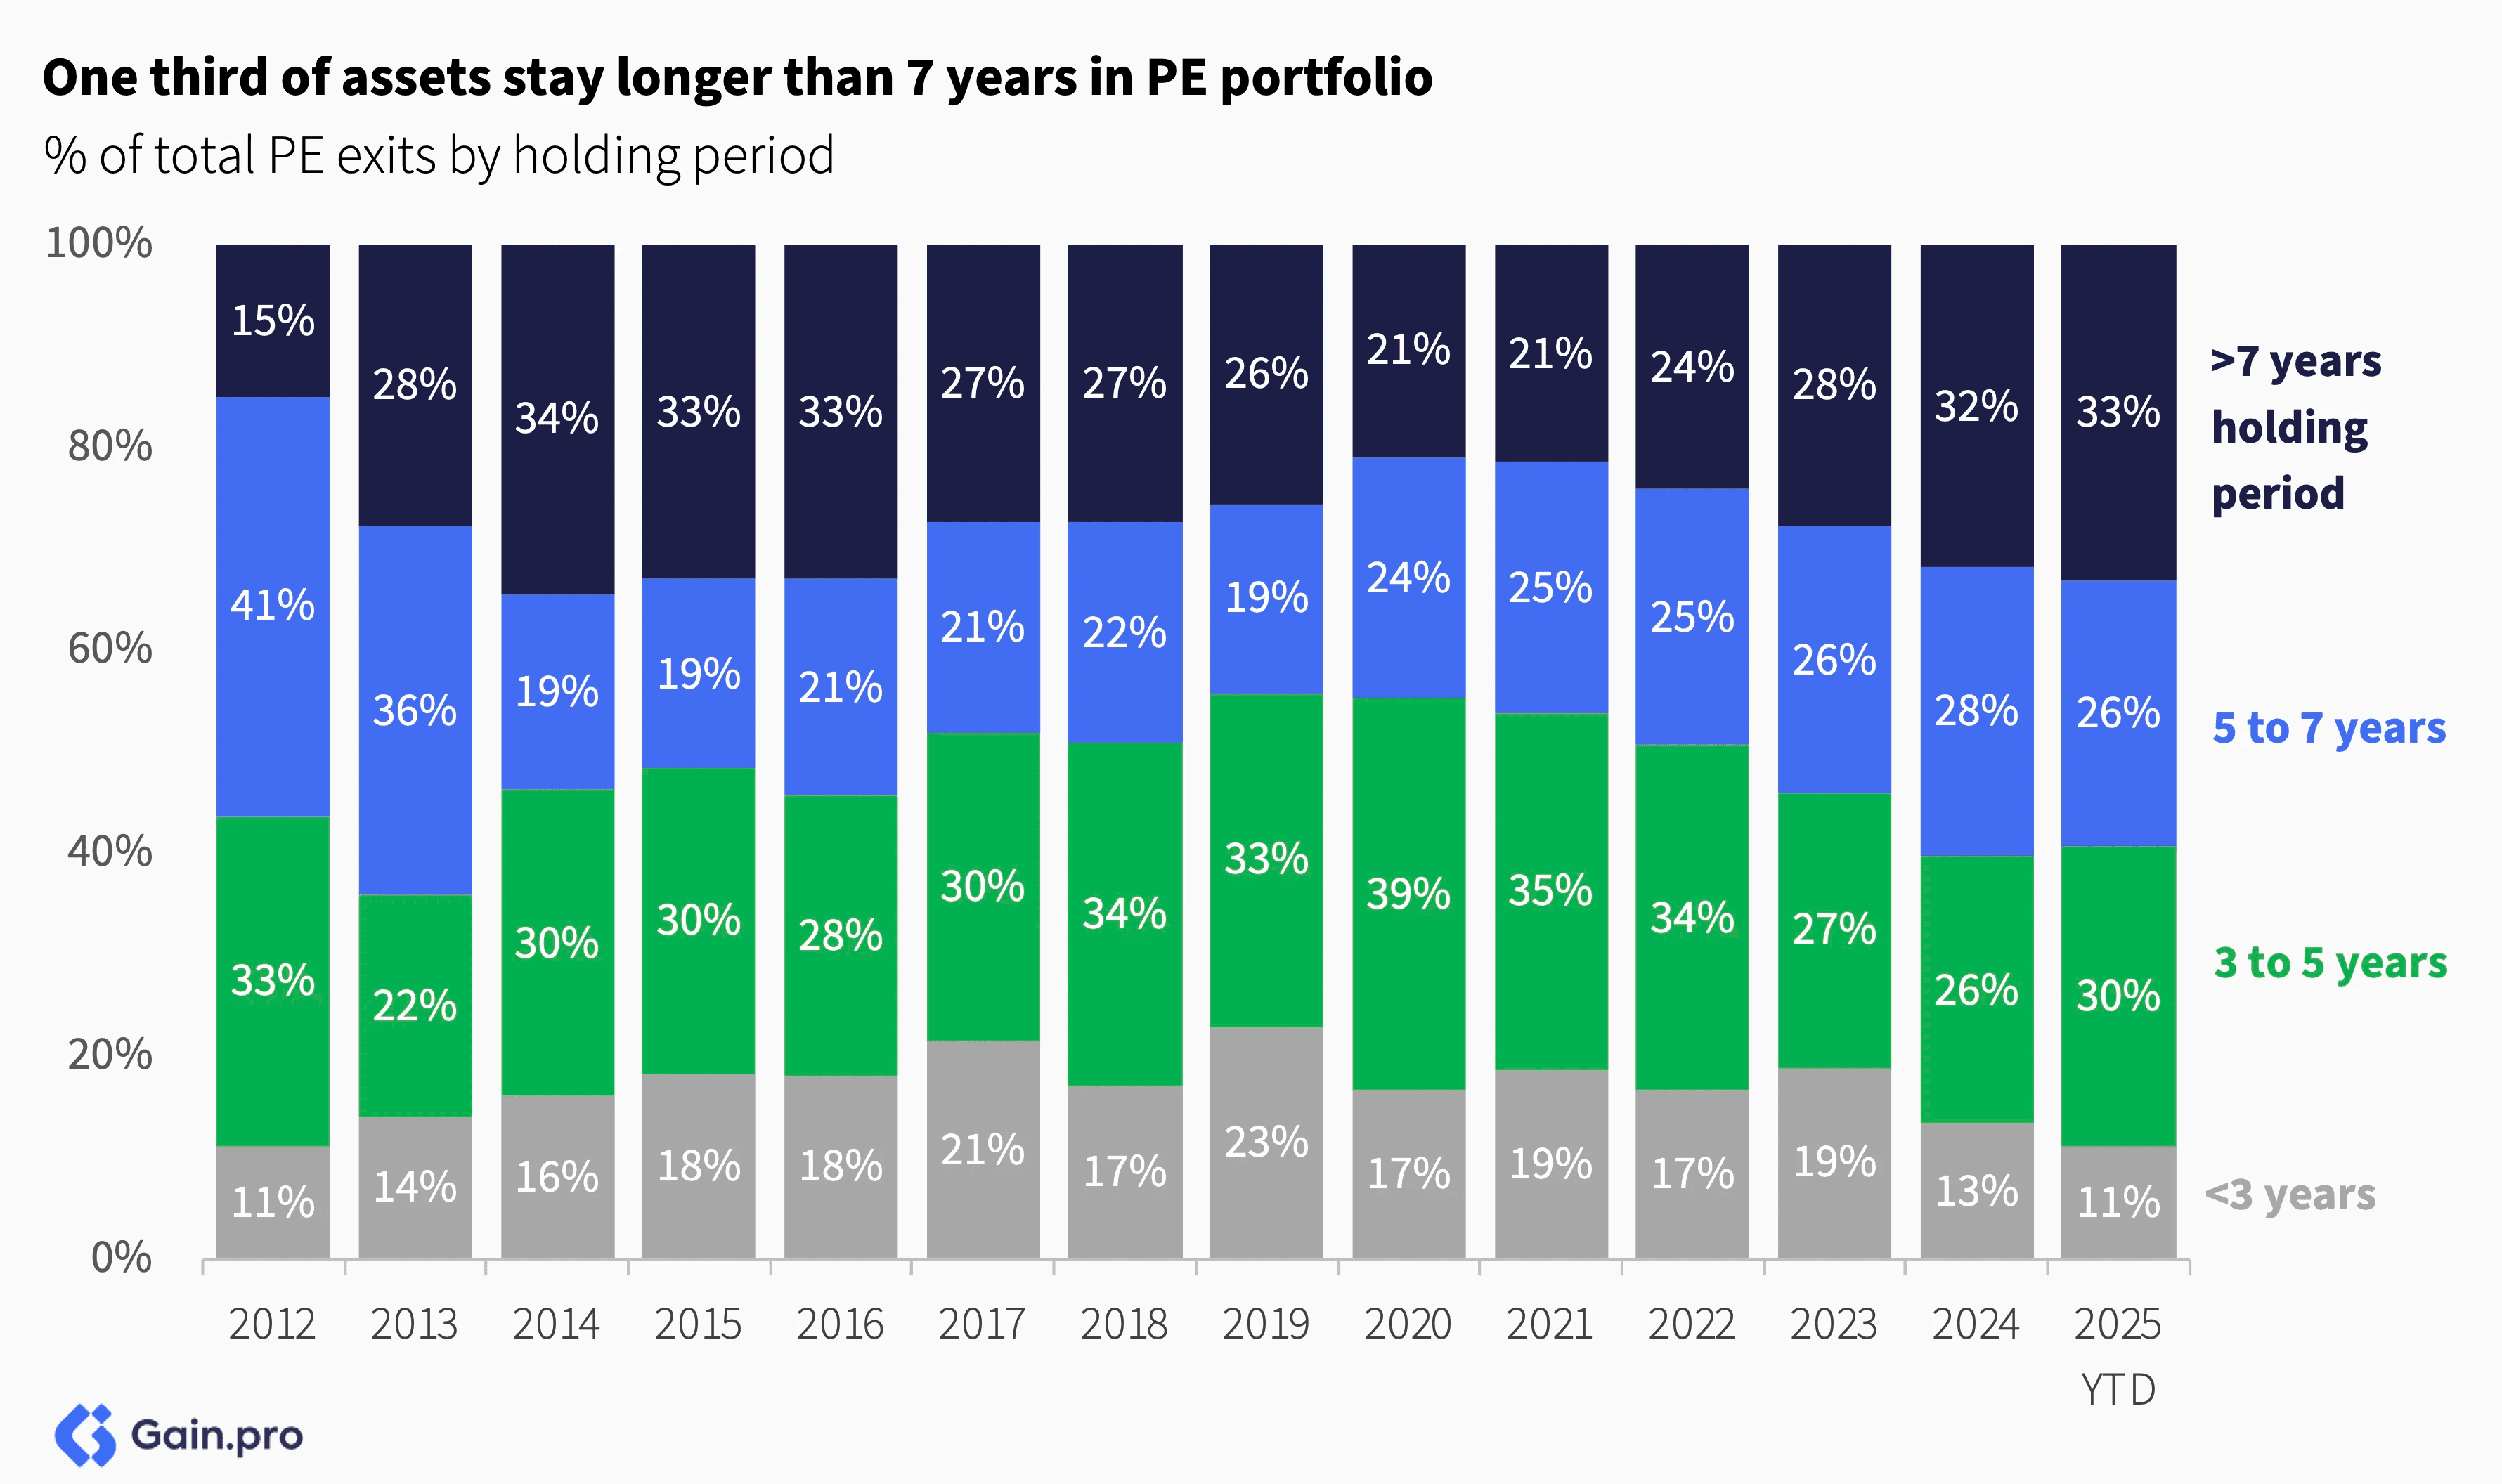
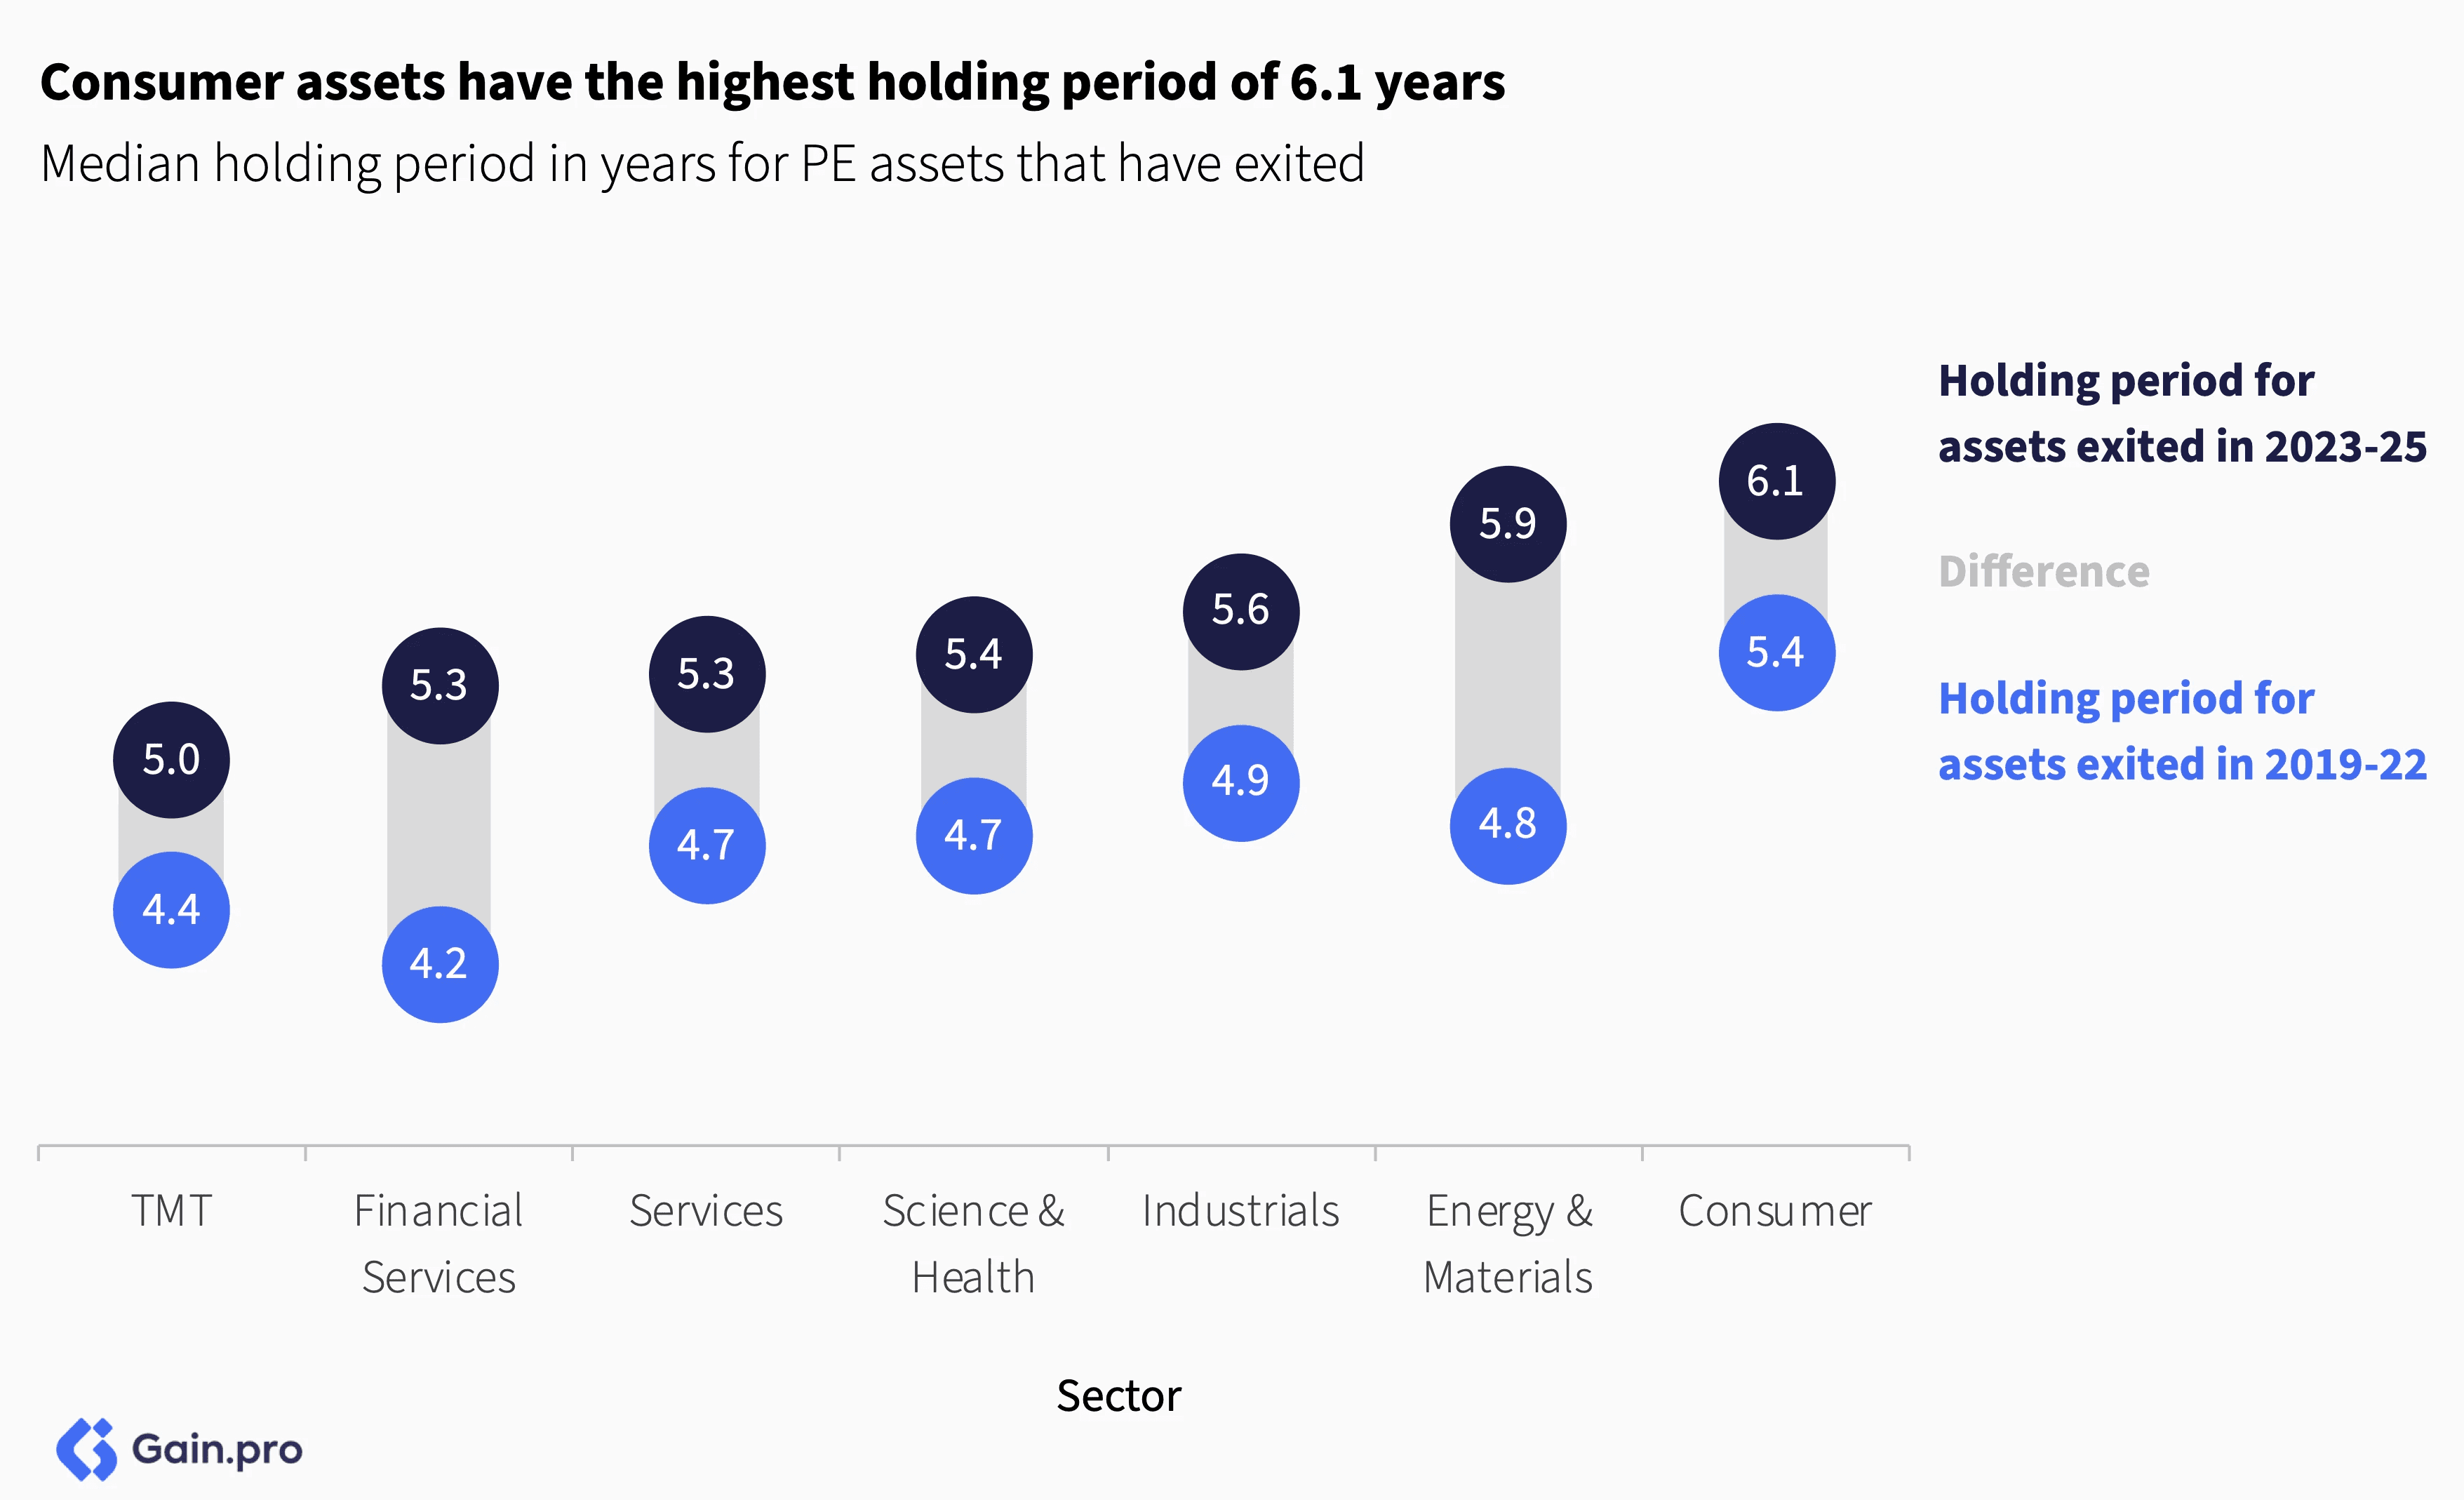
Holding Periods — Holding periods are sitting near a decade-high. The median company exiting in 2025 spent 5.7 years in the portfolio, up from 4.6 years in 2020. A third of PE assets stayed longer than 7 years in the portfolio, with the Consumer sector having the highest holding period on average.
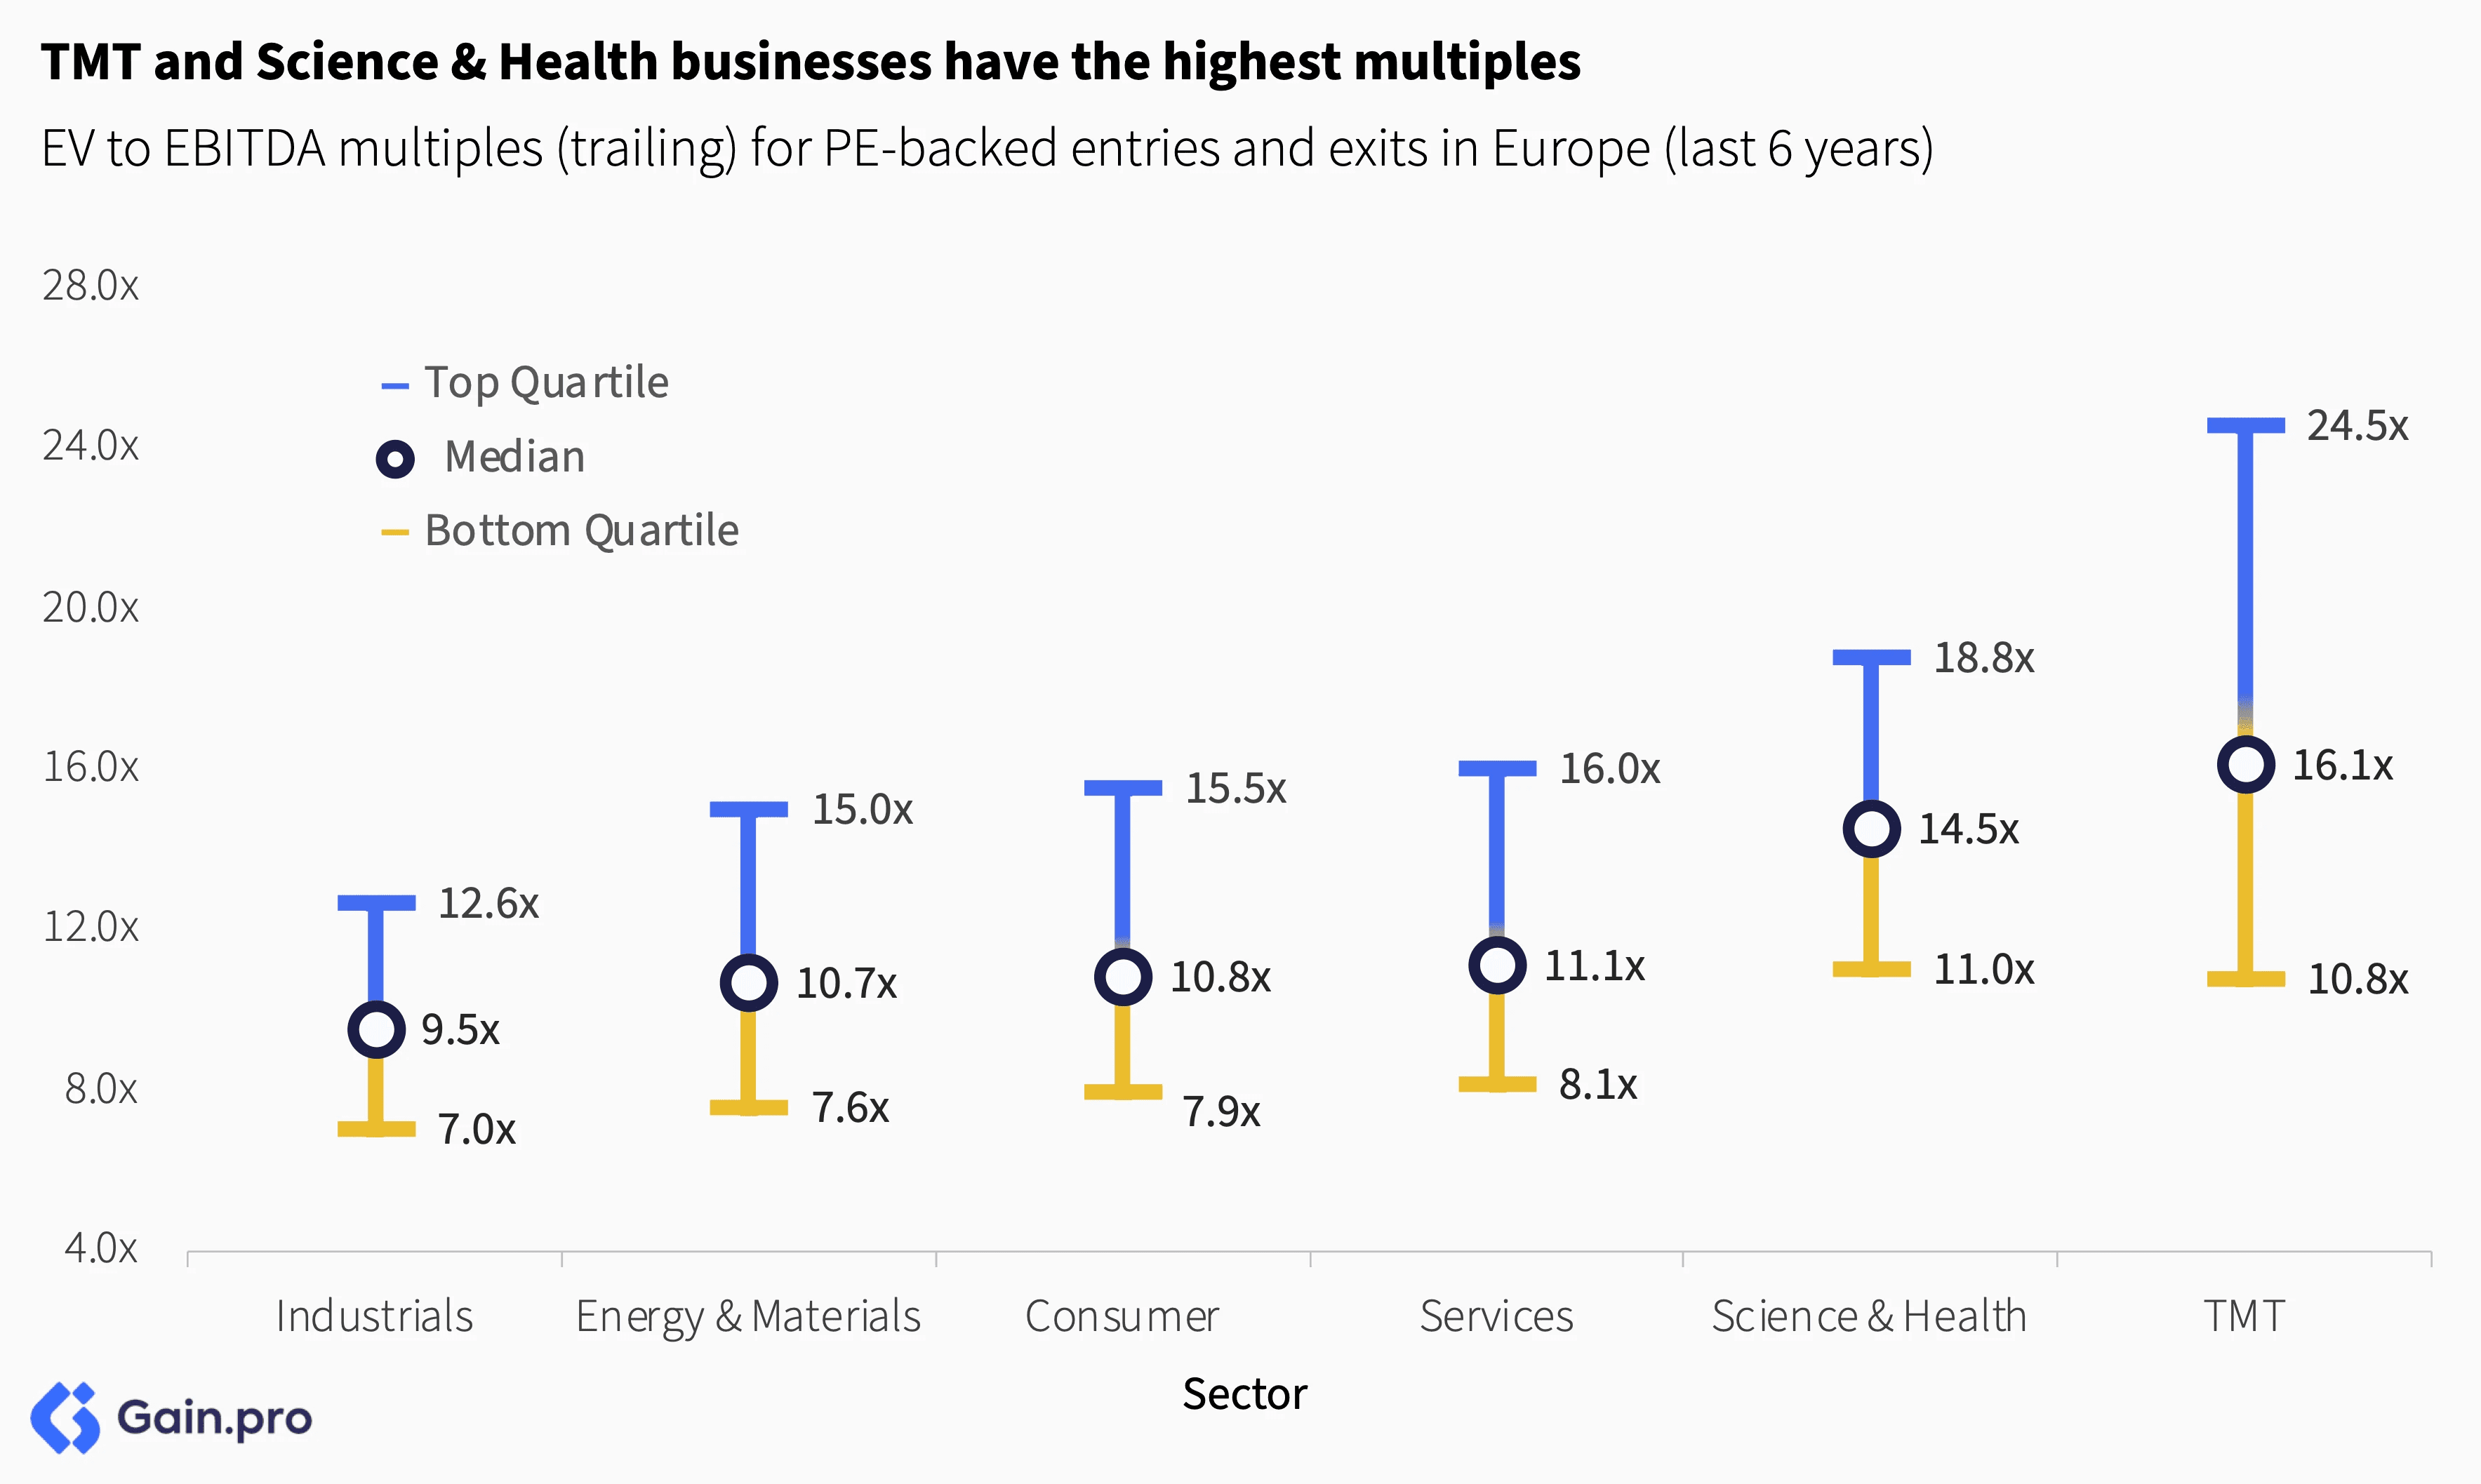
Multiples — After three consecutive years of decline, PE multiples showed early signs of recovery in 2025. By sector, TMT and Science & Health commanded a healthy premium driven by higher growth rates.
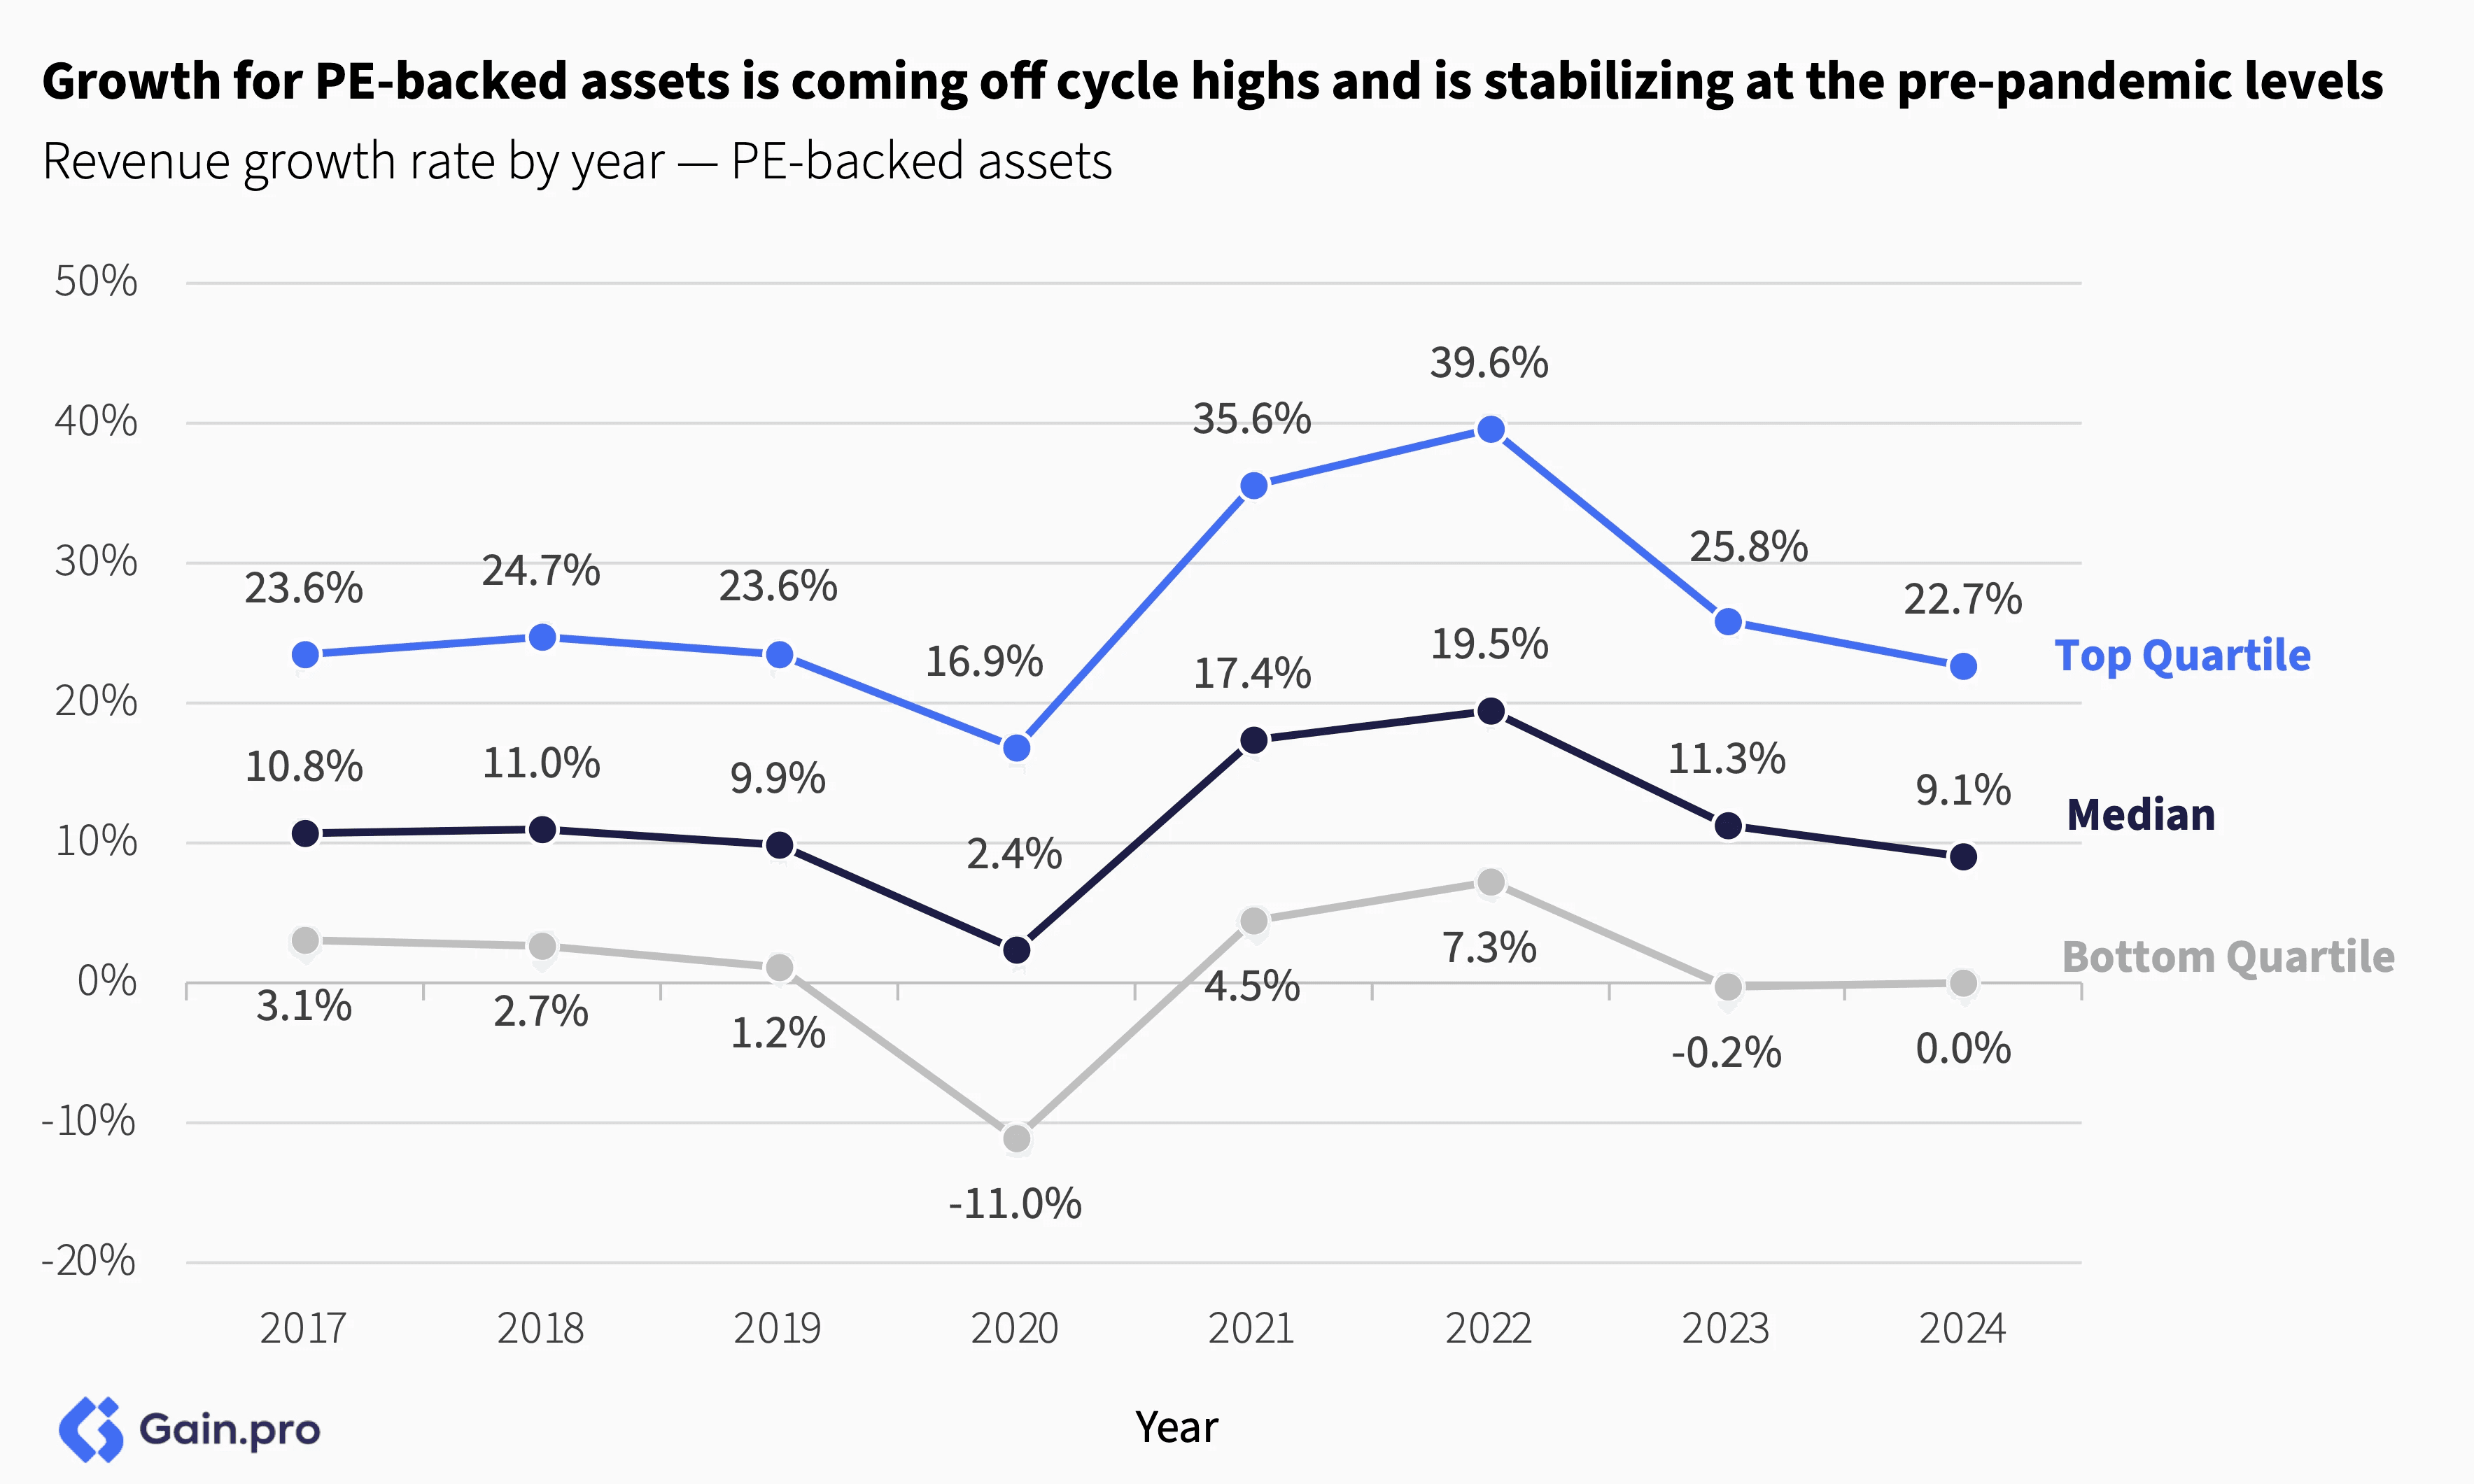
Growth and Margin — Growth for PE-backed assets is coming off cycle highs. The median PE-backed business grew 9.1% in 2024 down from 11.3% in 2023 and 19.5% in 2022. EBITDA margins have remained stable at 11.4% (flat from 11.0% in 2017).
If you have any questions about the data or the report, do not hesitate to reach out to insights@gain.pro.


Chapter 01: Entries
Overall Trend
We expect PE entry activity in 2025 to be up 9% year-over-year. Investors are returning to the market, taking advantage of easing credit spreads and attractive valuations despite the uncertain macro-environment.
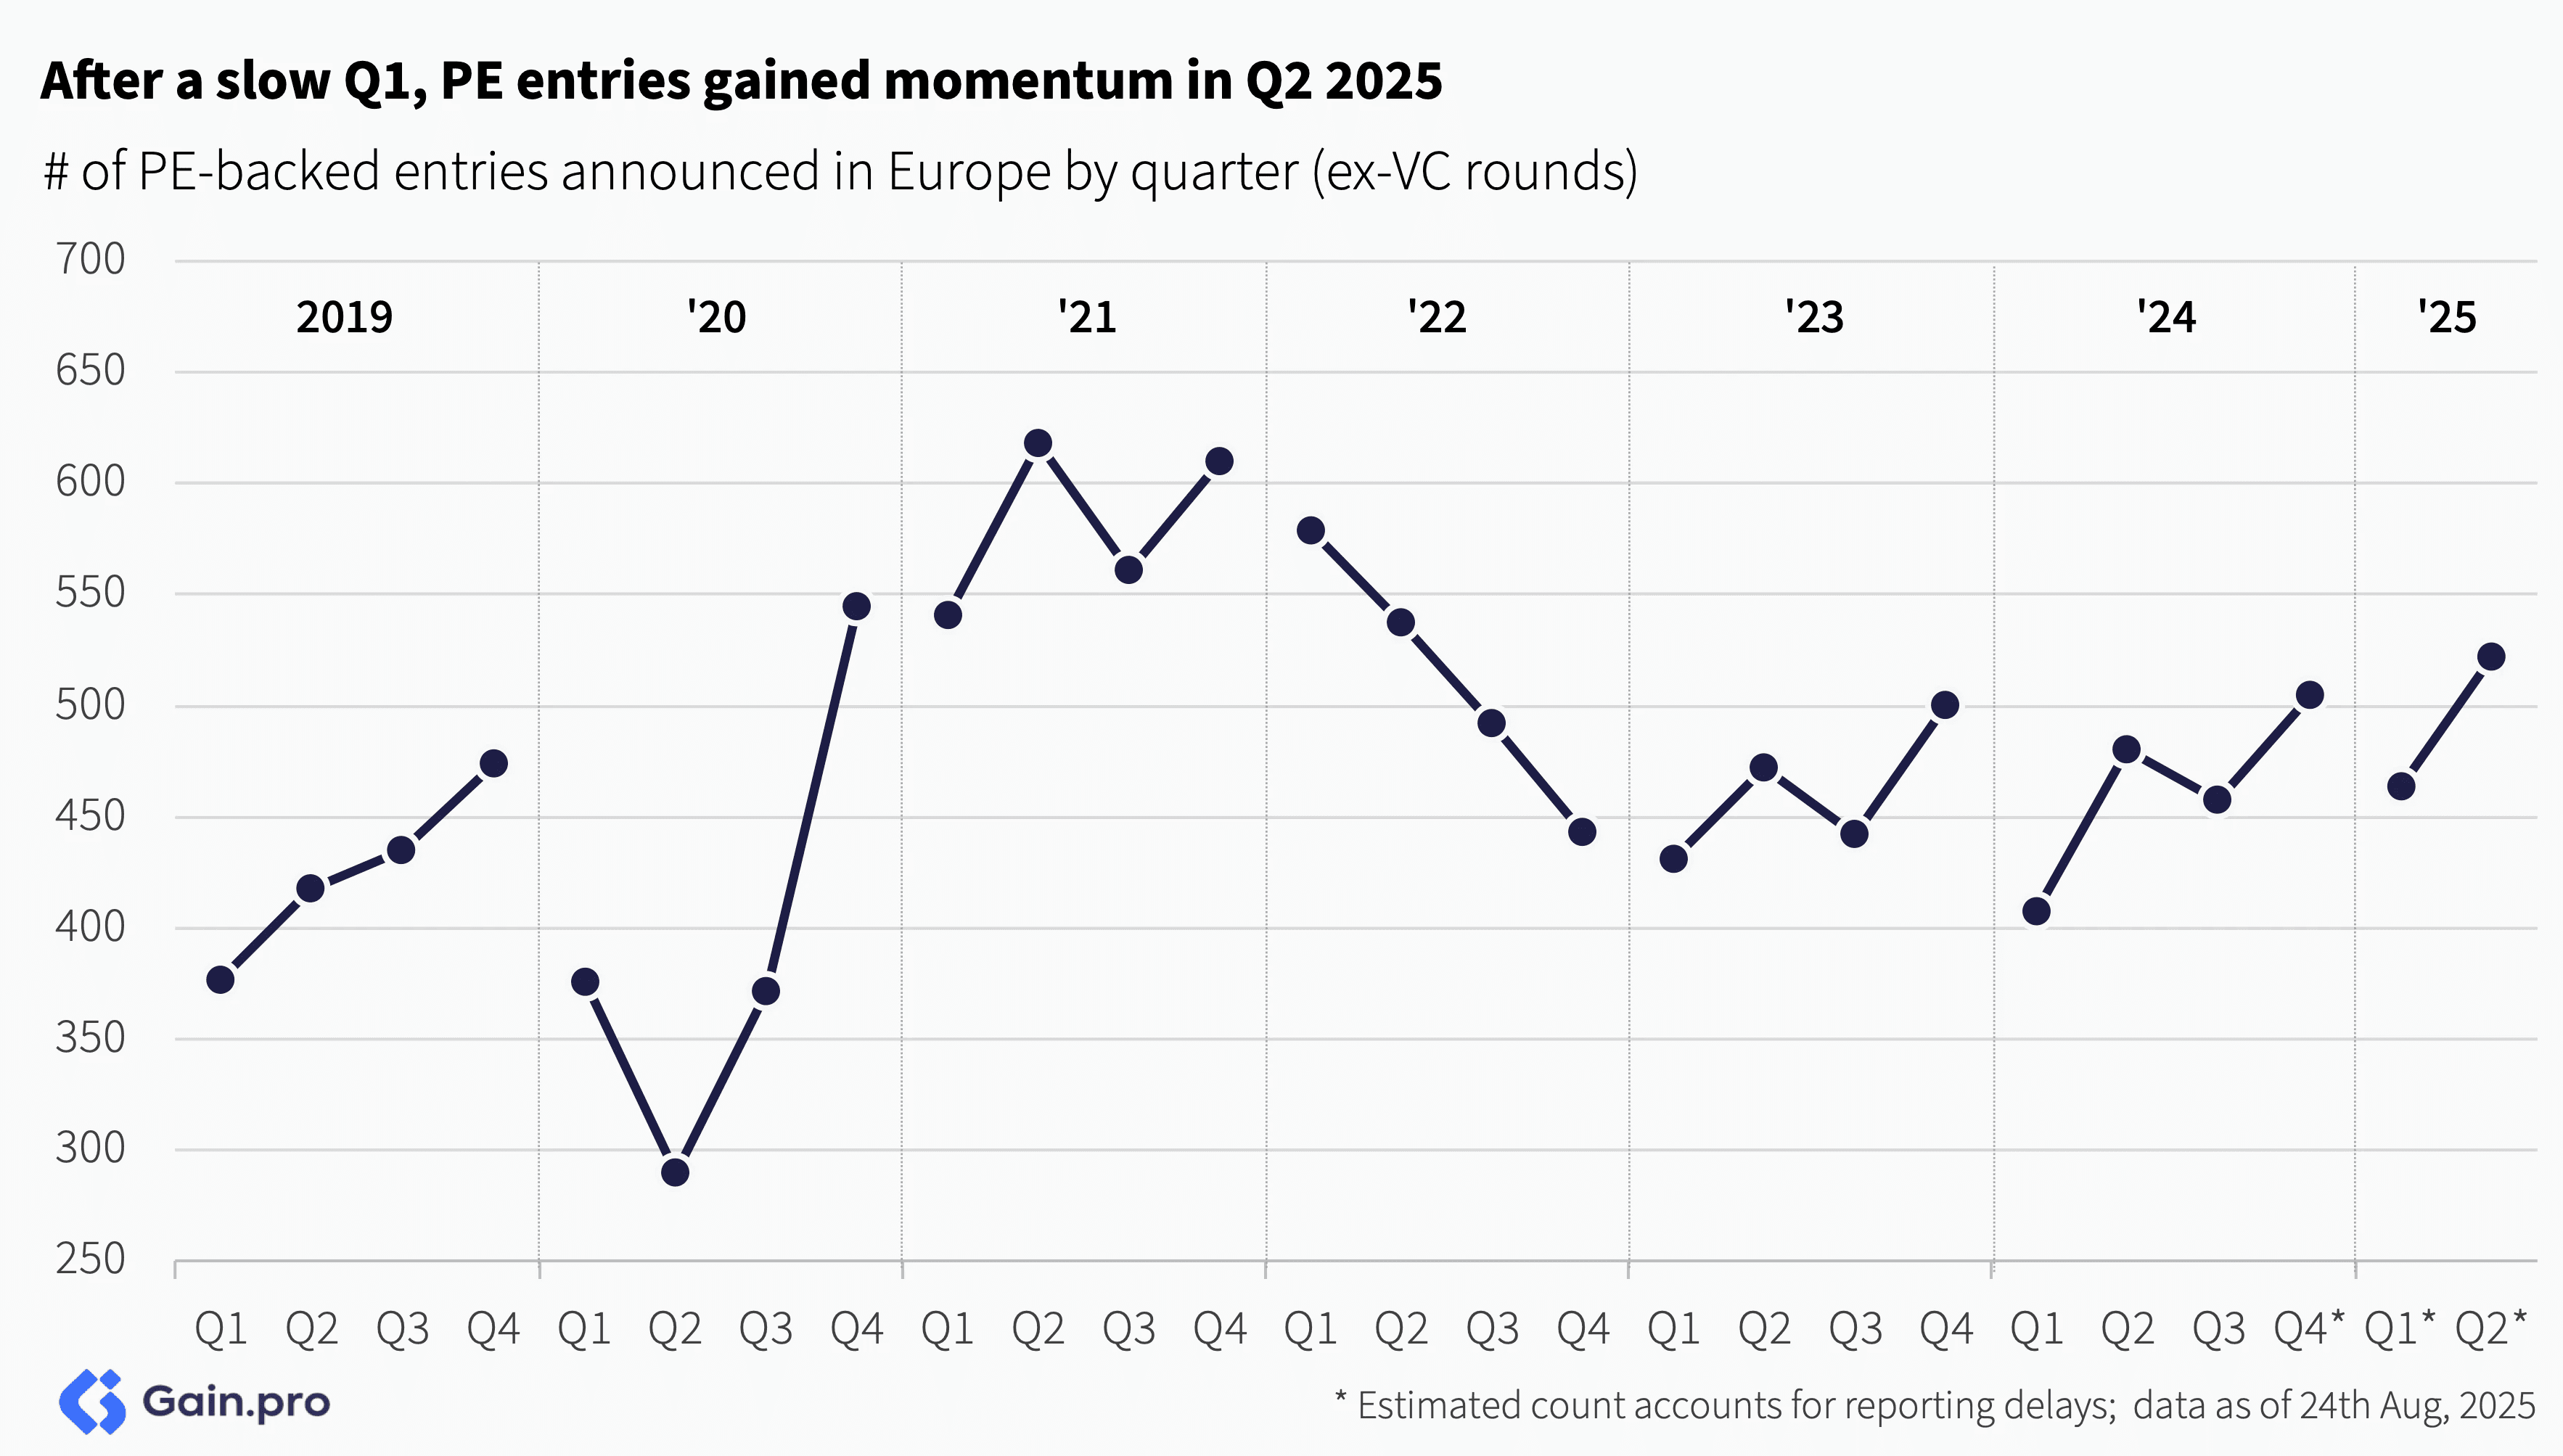
After a softer Q1 marked by tariff uncertainties, PE entry activity regained momentum in Q2. The rebound was further supported by a more accommodative monetary policy and easing interest rate expectations. PE multiples are also showing early signs of recovery in 2025 after three consecutive years of decline.
Entries by Sector
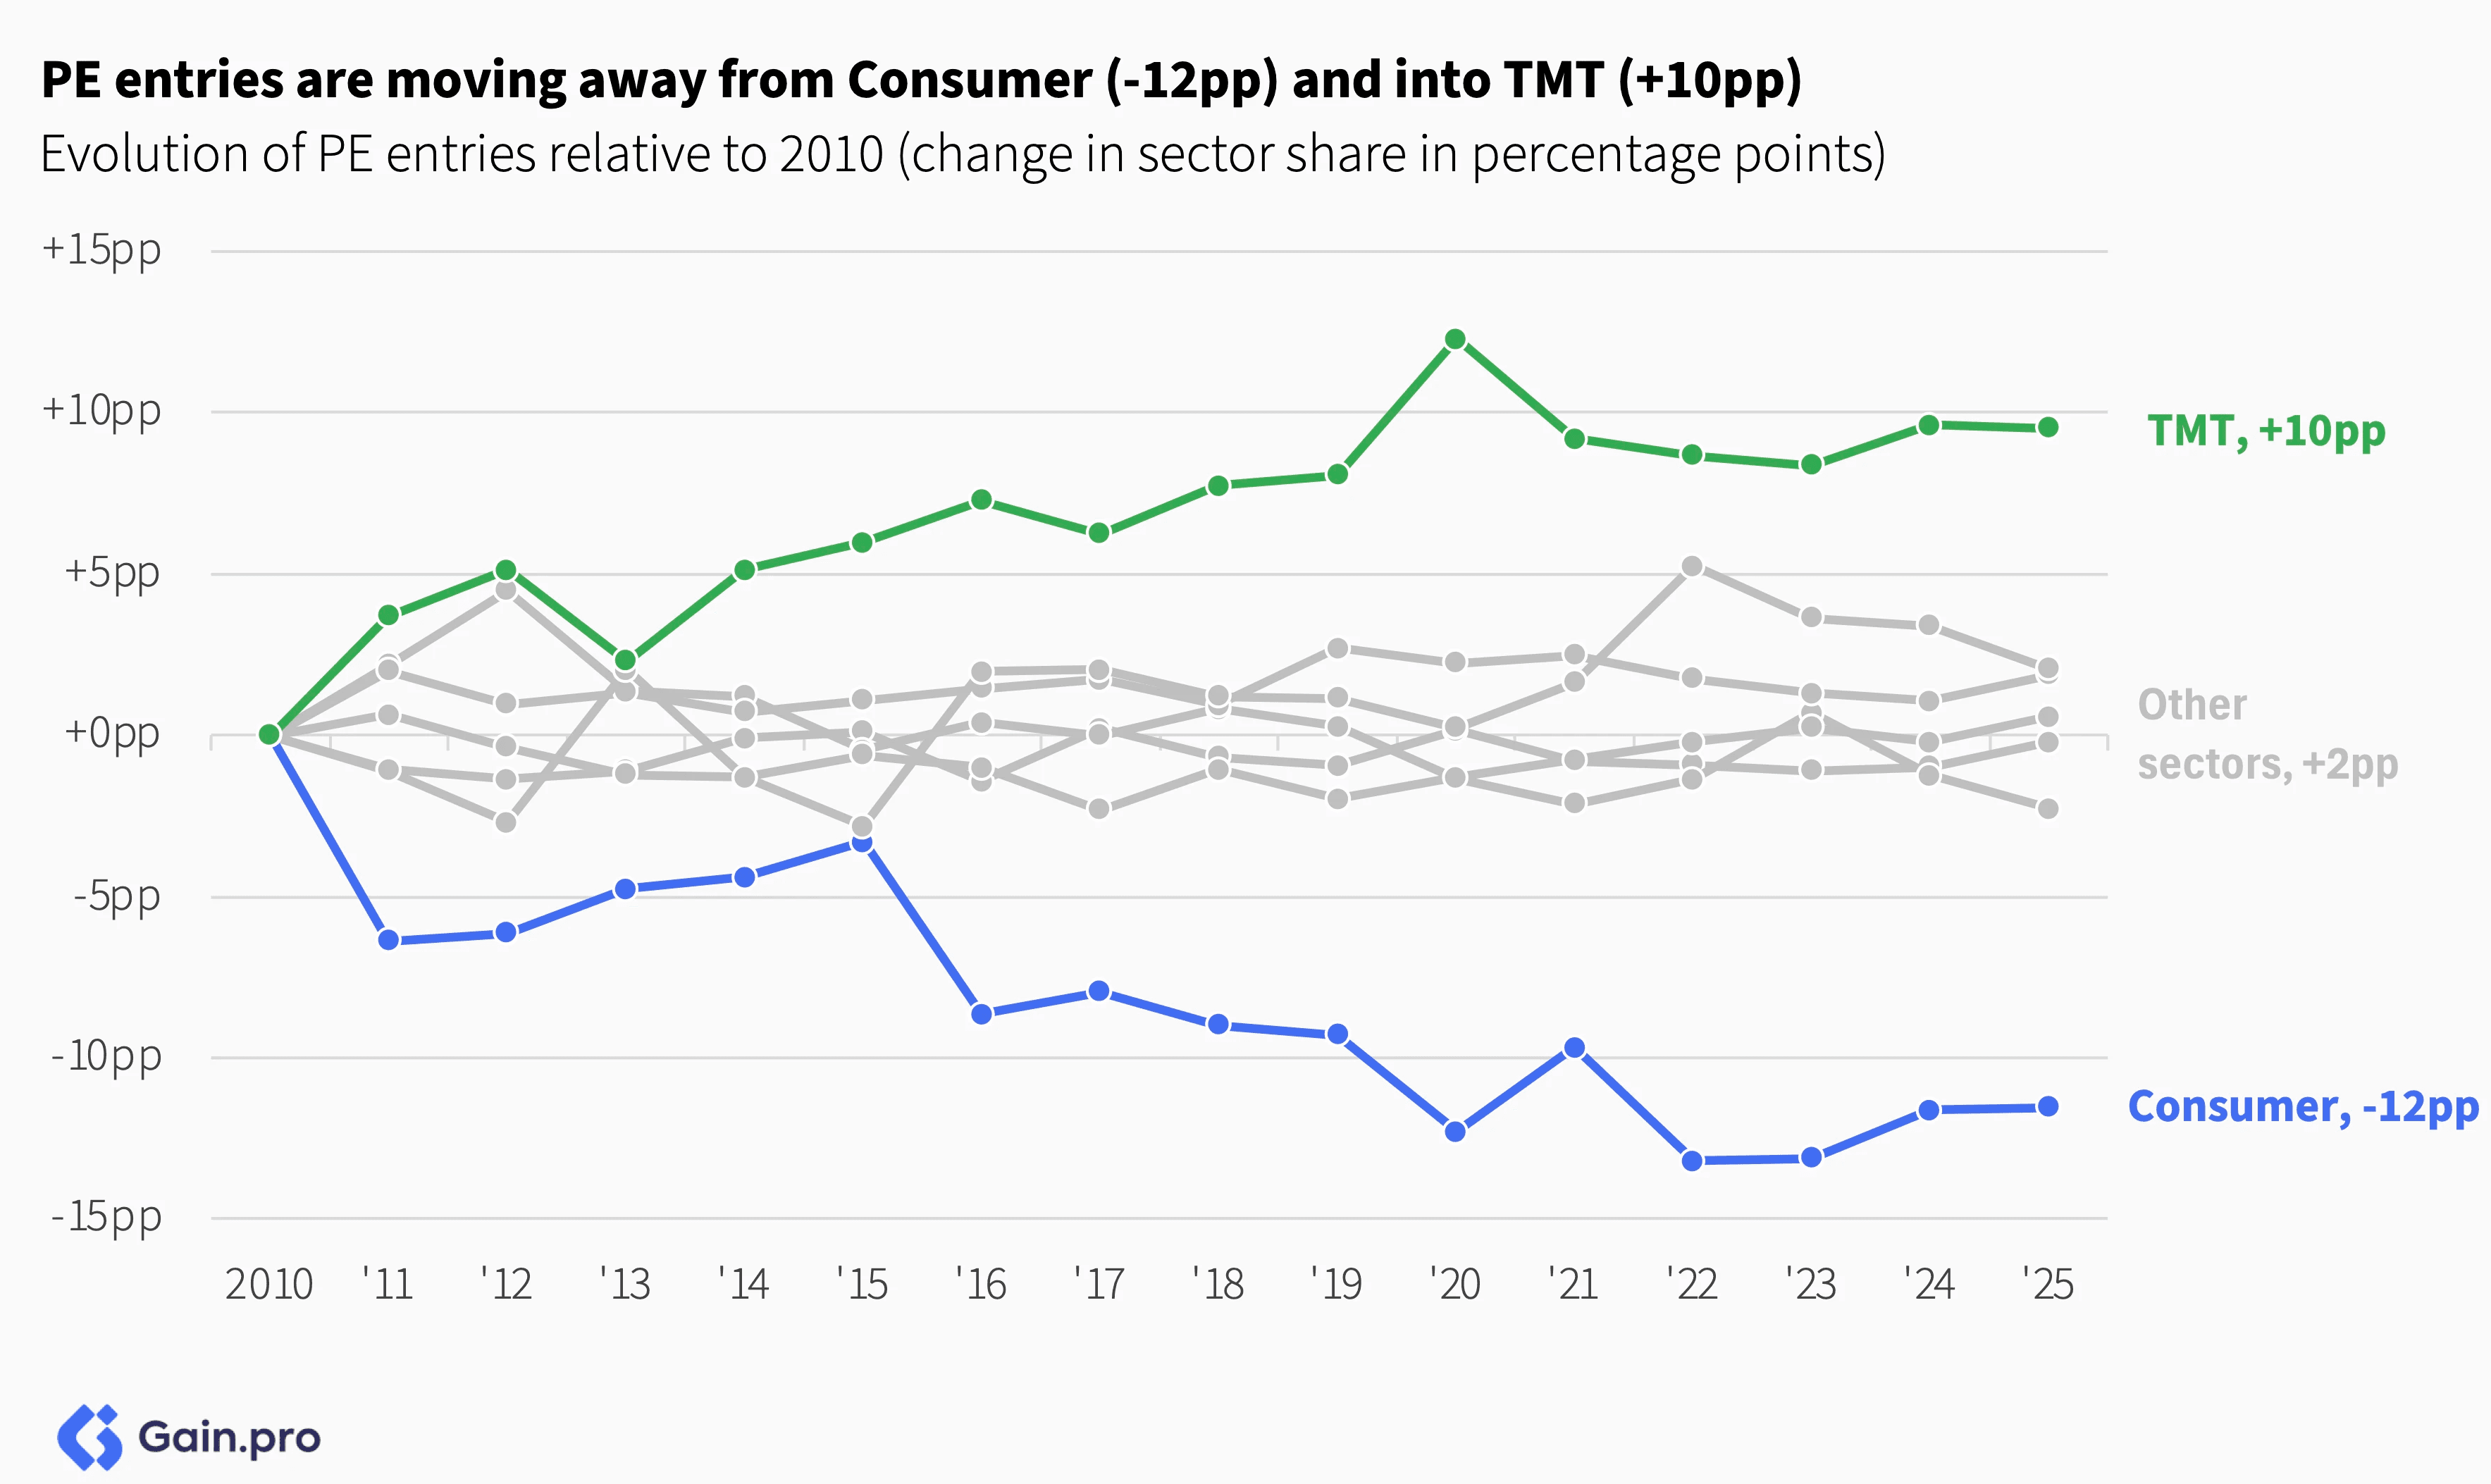
By sector, Services (25%), Industrials (21%) and TMT (19%) together accounted for over two-thirds of all new PE entries. At the subsector level, Manufacturing (15%), Professional Services (14%) and Software (12%) led activity.
Notably, the sector mix for PE entries has shifted in recent years. The share of TMT (+10pp) has increased, reflecting investor preference for asset-light, innovative and high-growth businesses, with TMT further benefiting from secular trends in AI adoption and digitalization. In contrast, the share of Consumer deals (-12pp) has come down, weighed down by slower growth and a tougher exit environment, particularly in Retail and Consumer Goods subsectors, where valuations and buyer appetite have remained under pressure.
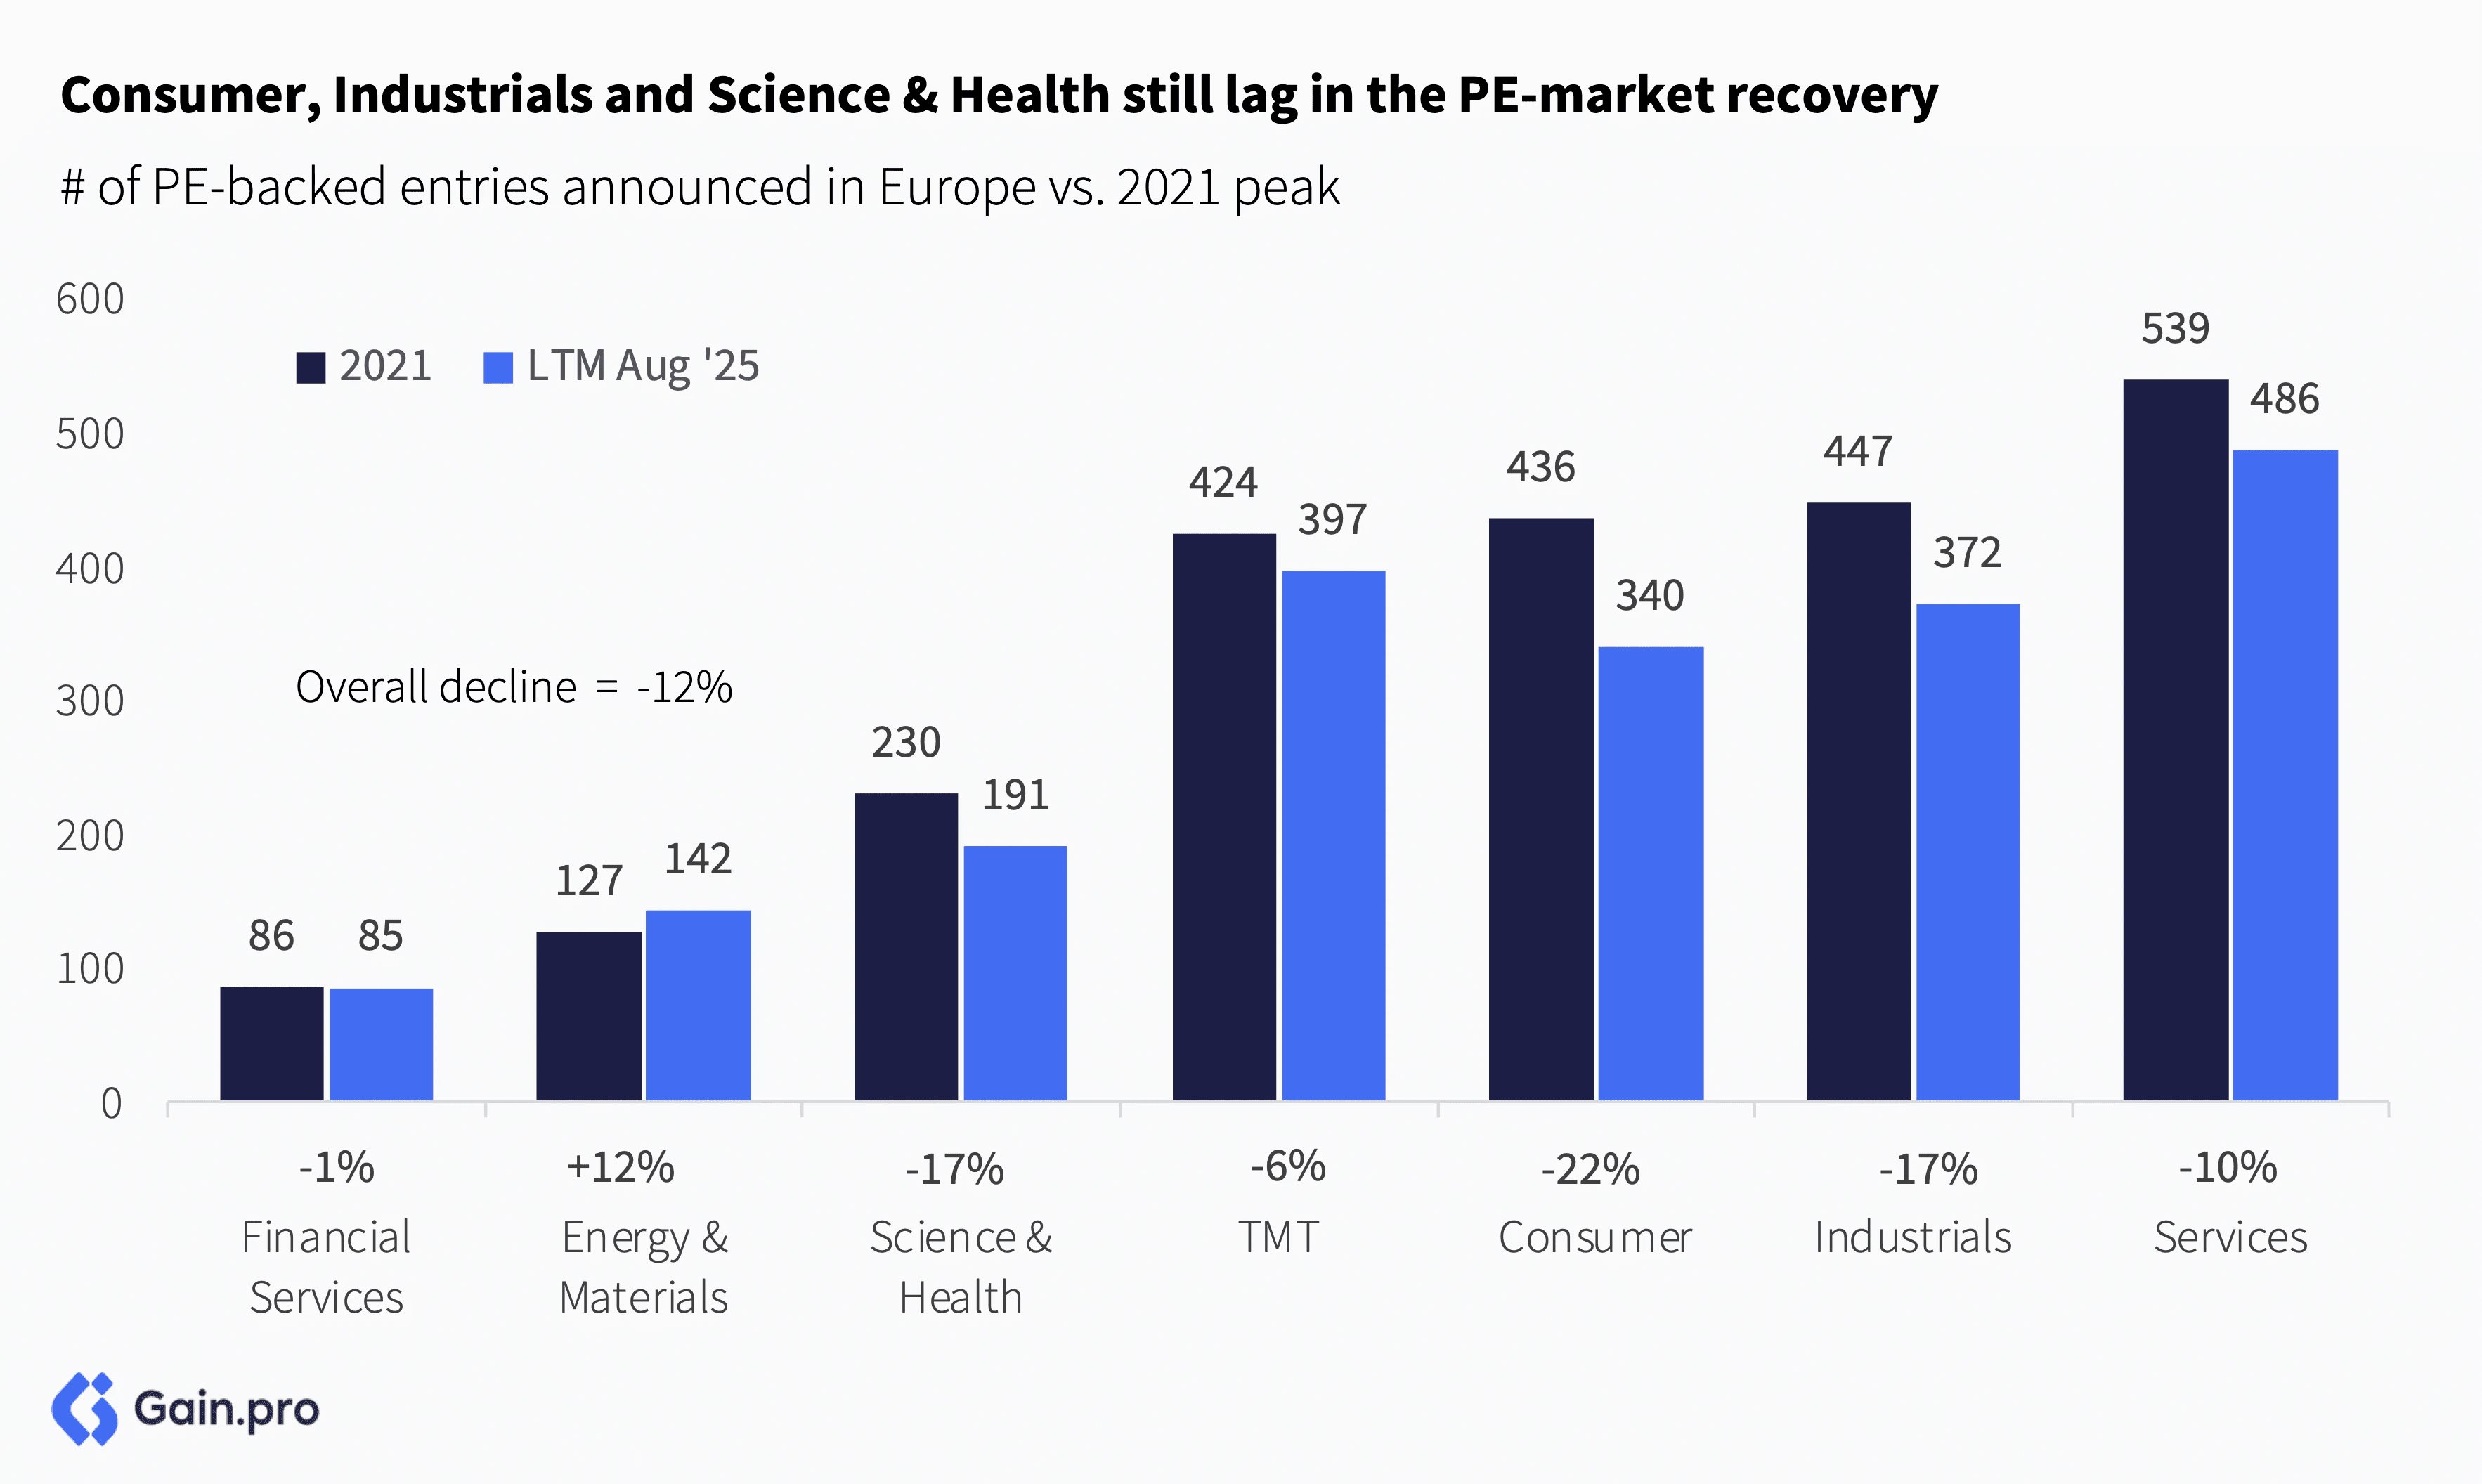
Relative to the 2021 peak, entries in Energy & Materials (+12%) and Financial Services (broadly flat) have remained relatively resilient. Entries in Consumer (-22%), Science & Health (-17%) and Industrials (-17%) have been the hardest hit. Science & Health has been affected by regulatory uncertainty, particularly in Germany, while Consumer and Industrials have been in secular decline due to slower growth and lower margins.
Entries by Region
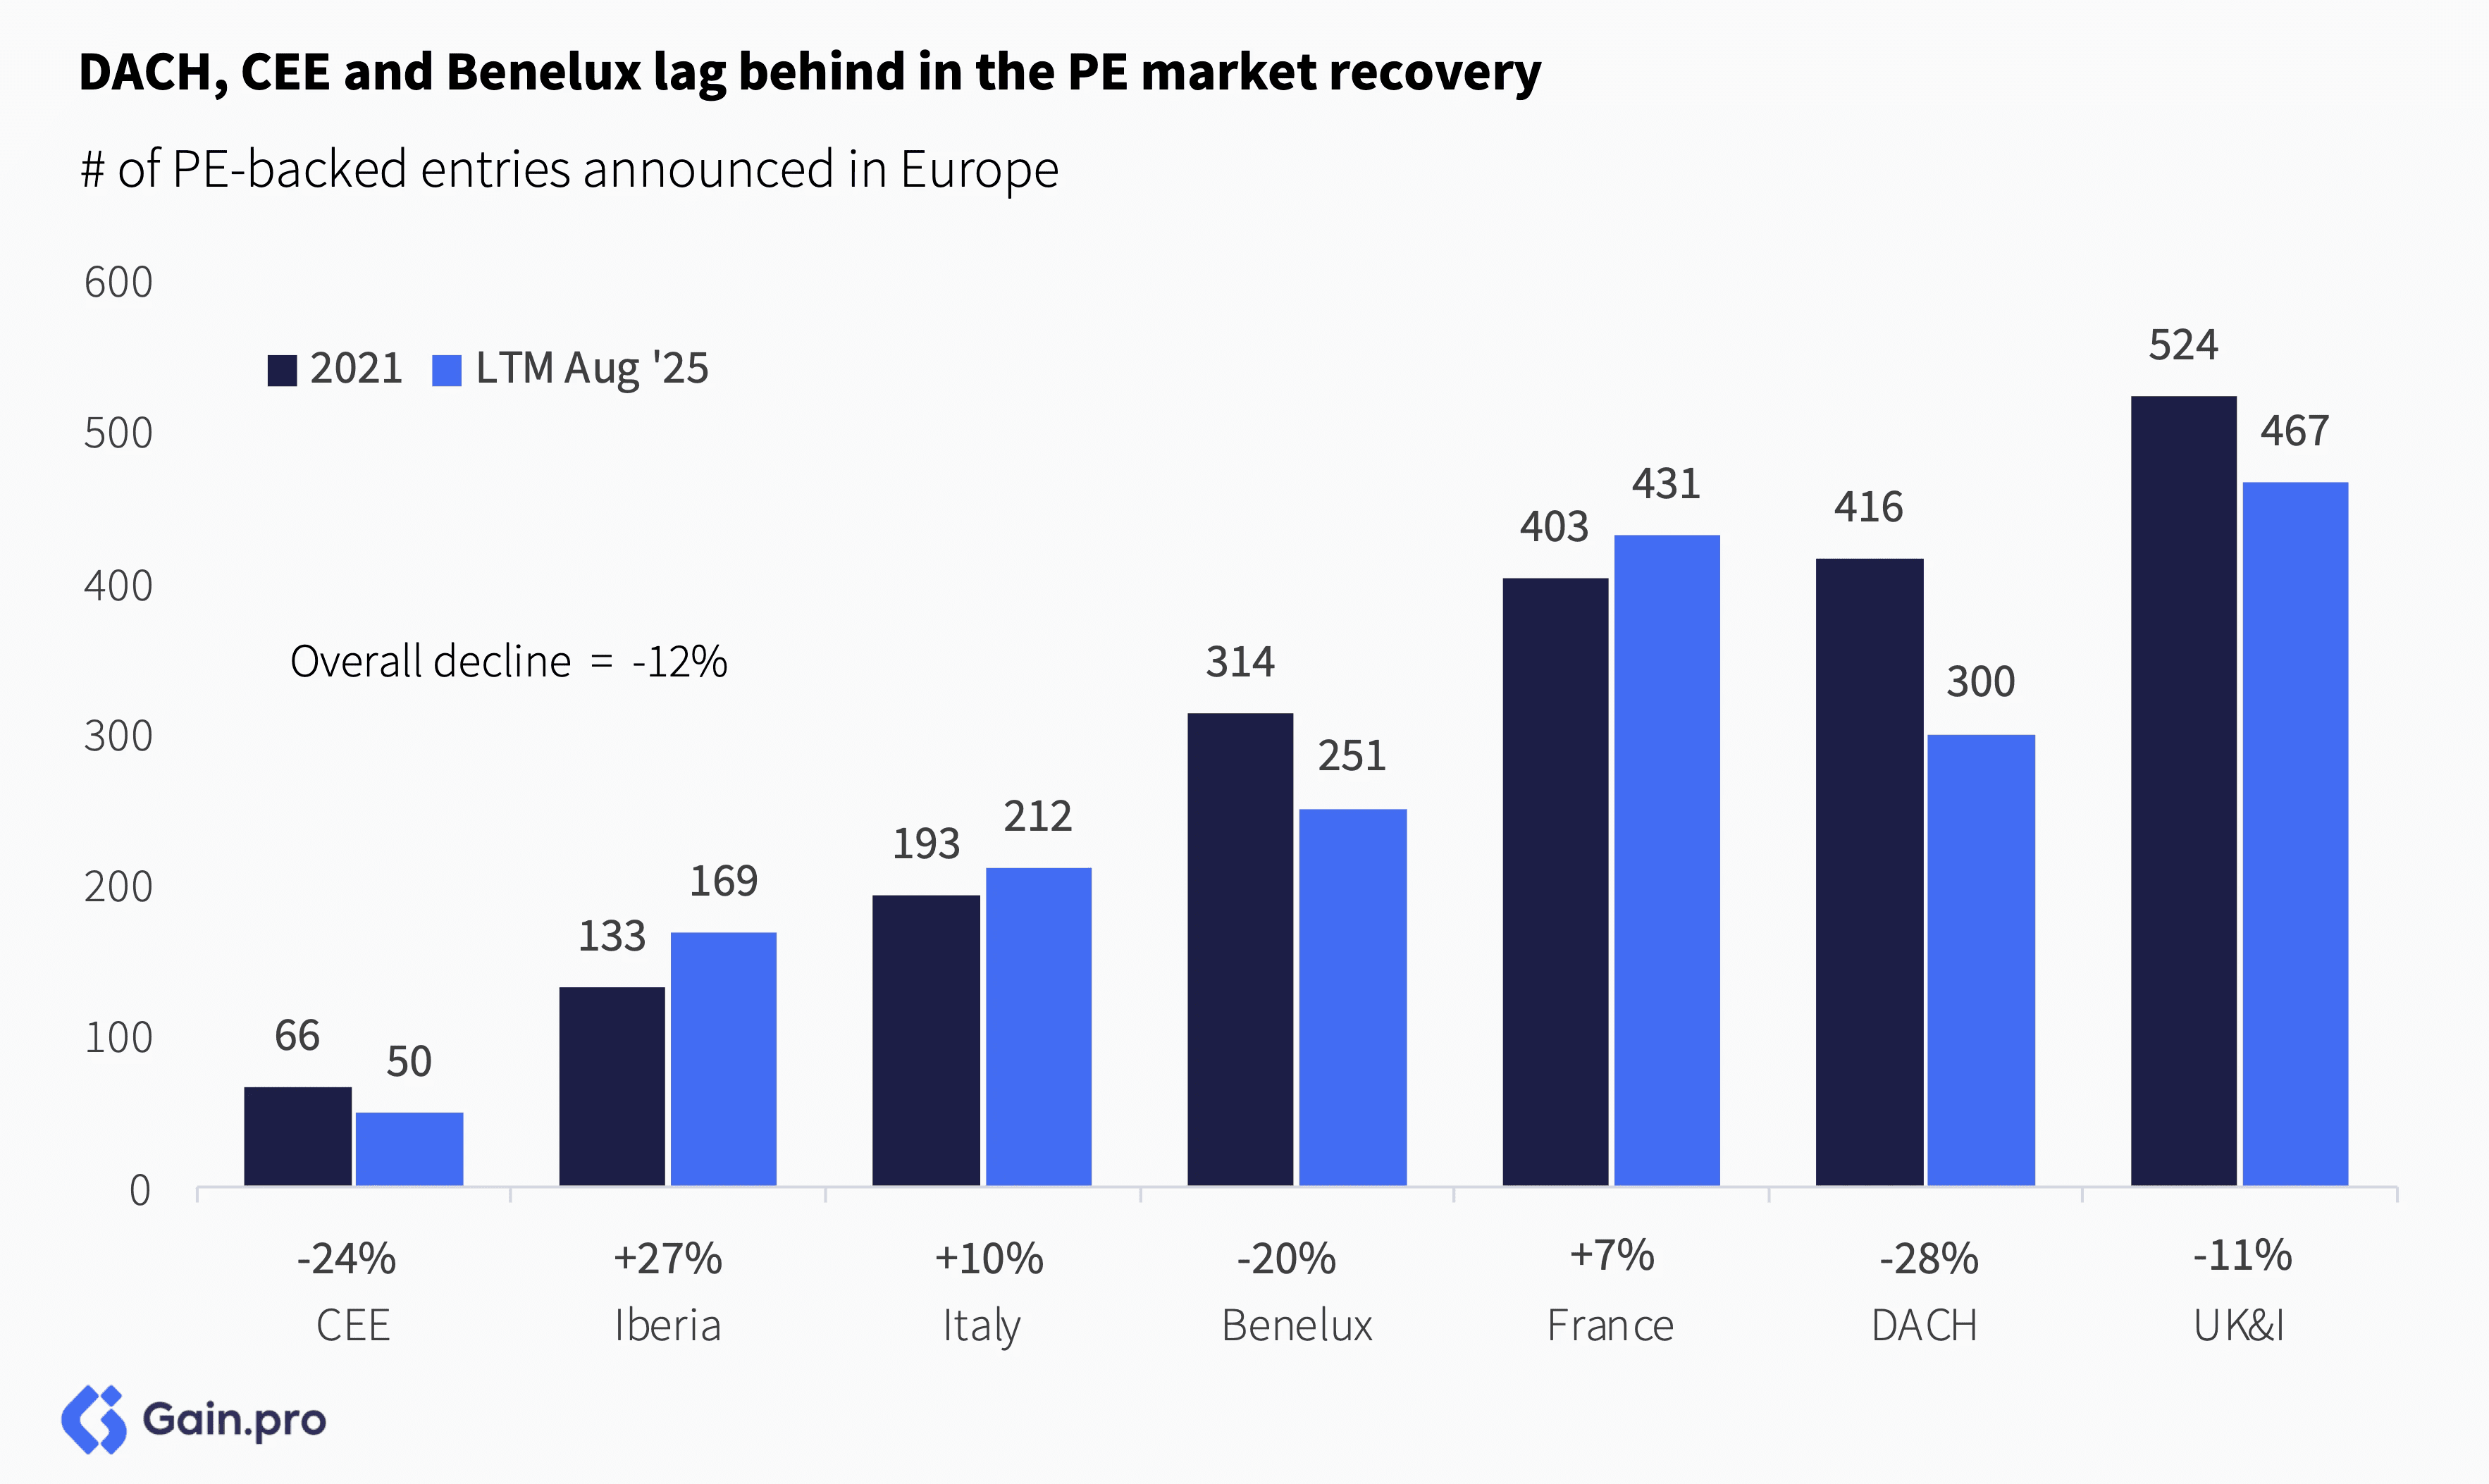
Entries in DACH (-28%), CEE (-24%) and Benelux (-20%) continue to lag vs. 2021. In contrast, activity in Iberia (+27%), Italy (+10%) and France (+7%) is seeing stronger momentum, supported by deal flow moving south in search of untapped opportunities with more attractive valuations.
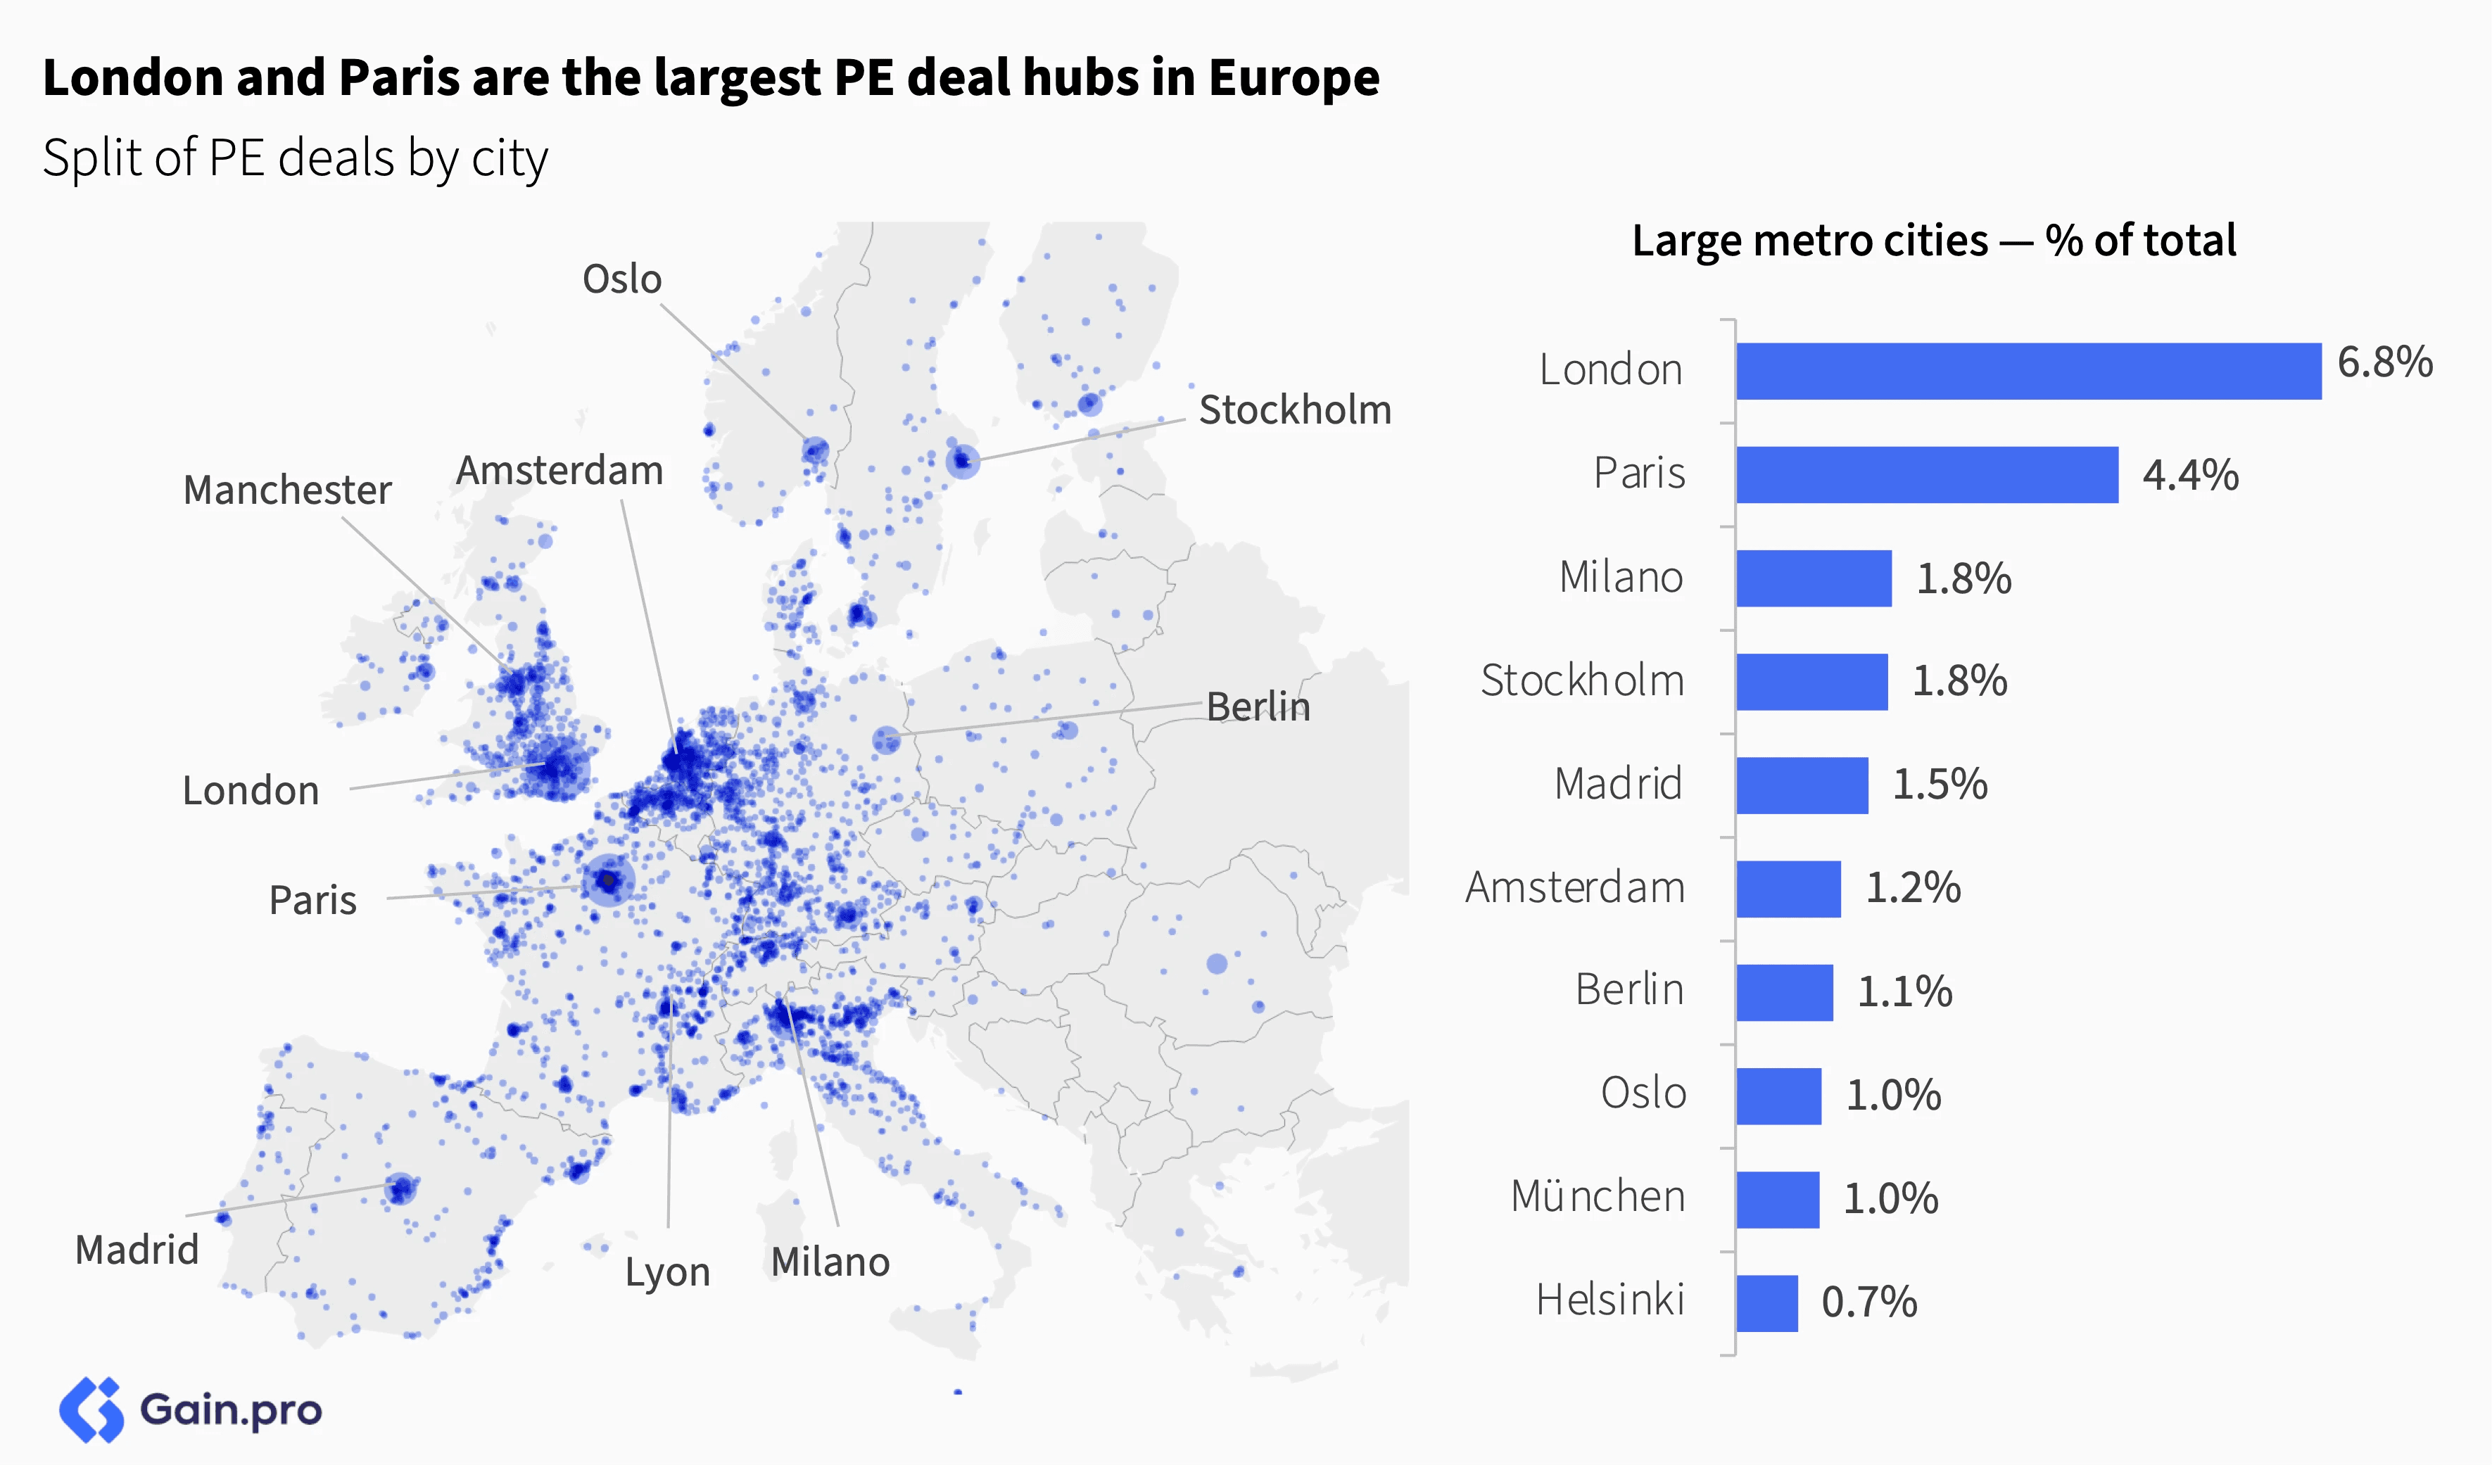
By city, London and Paris remain the largest hubs of activity, together accounting for 11.2% of PE entries in Europe. Large secondary hubs include Milan and Stockholm (1.8%), Madrid (1.5%), Amsterdam (1.2%) and Berlin (1.1%).
Entries by Deal Type
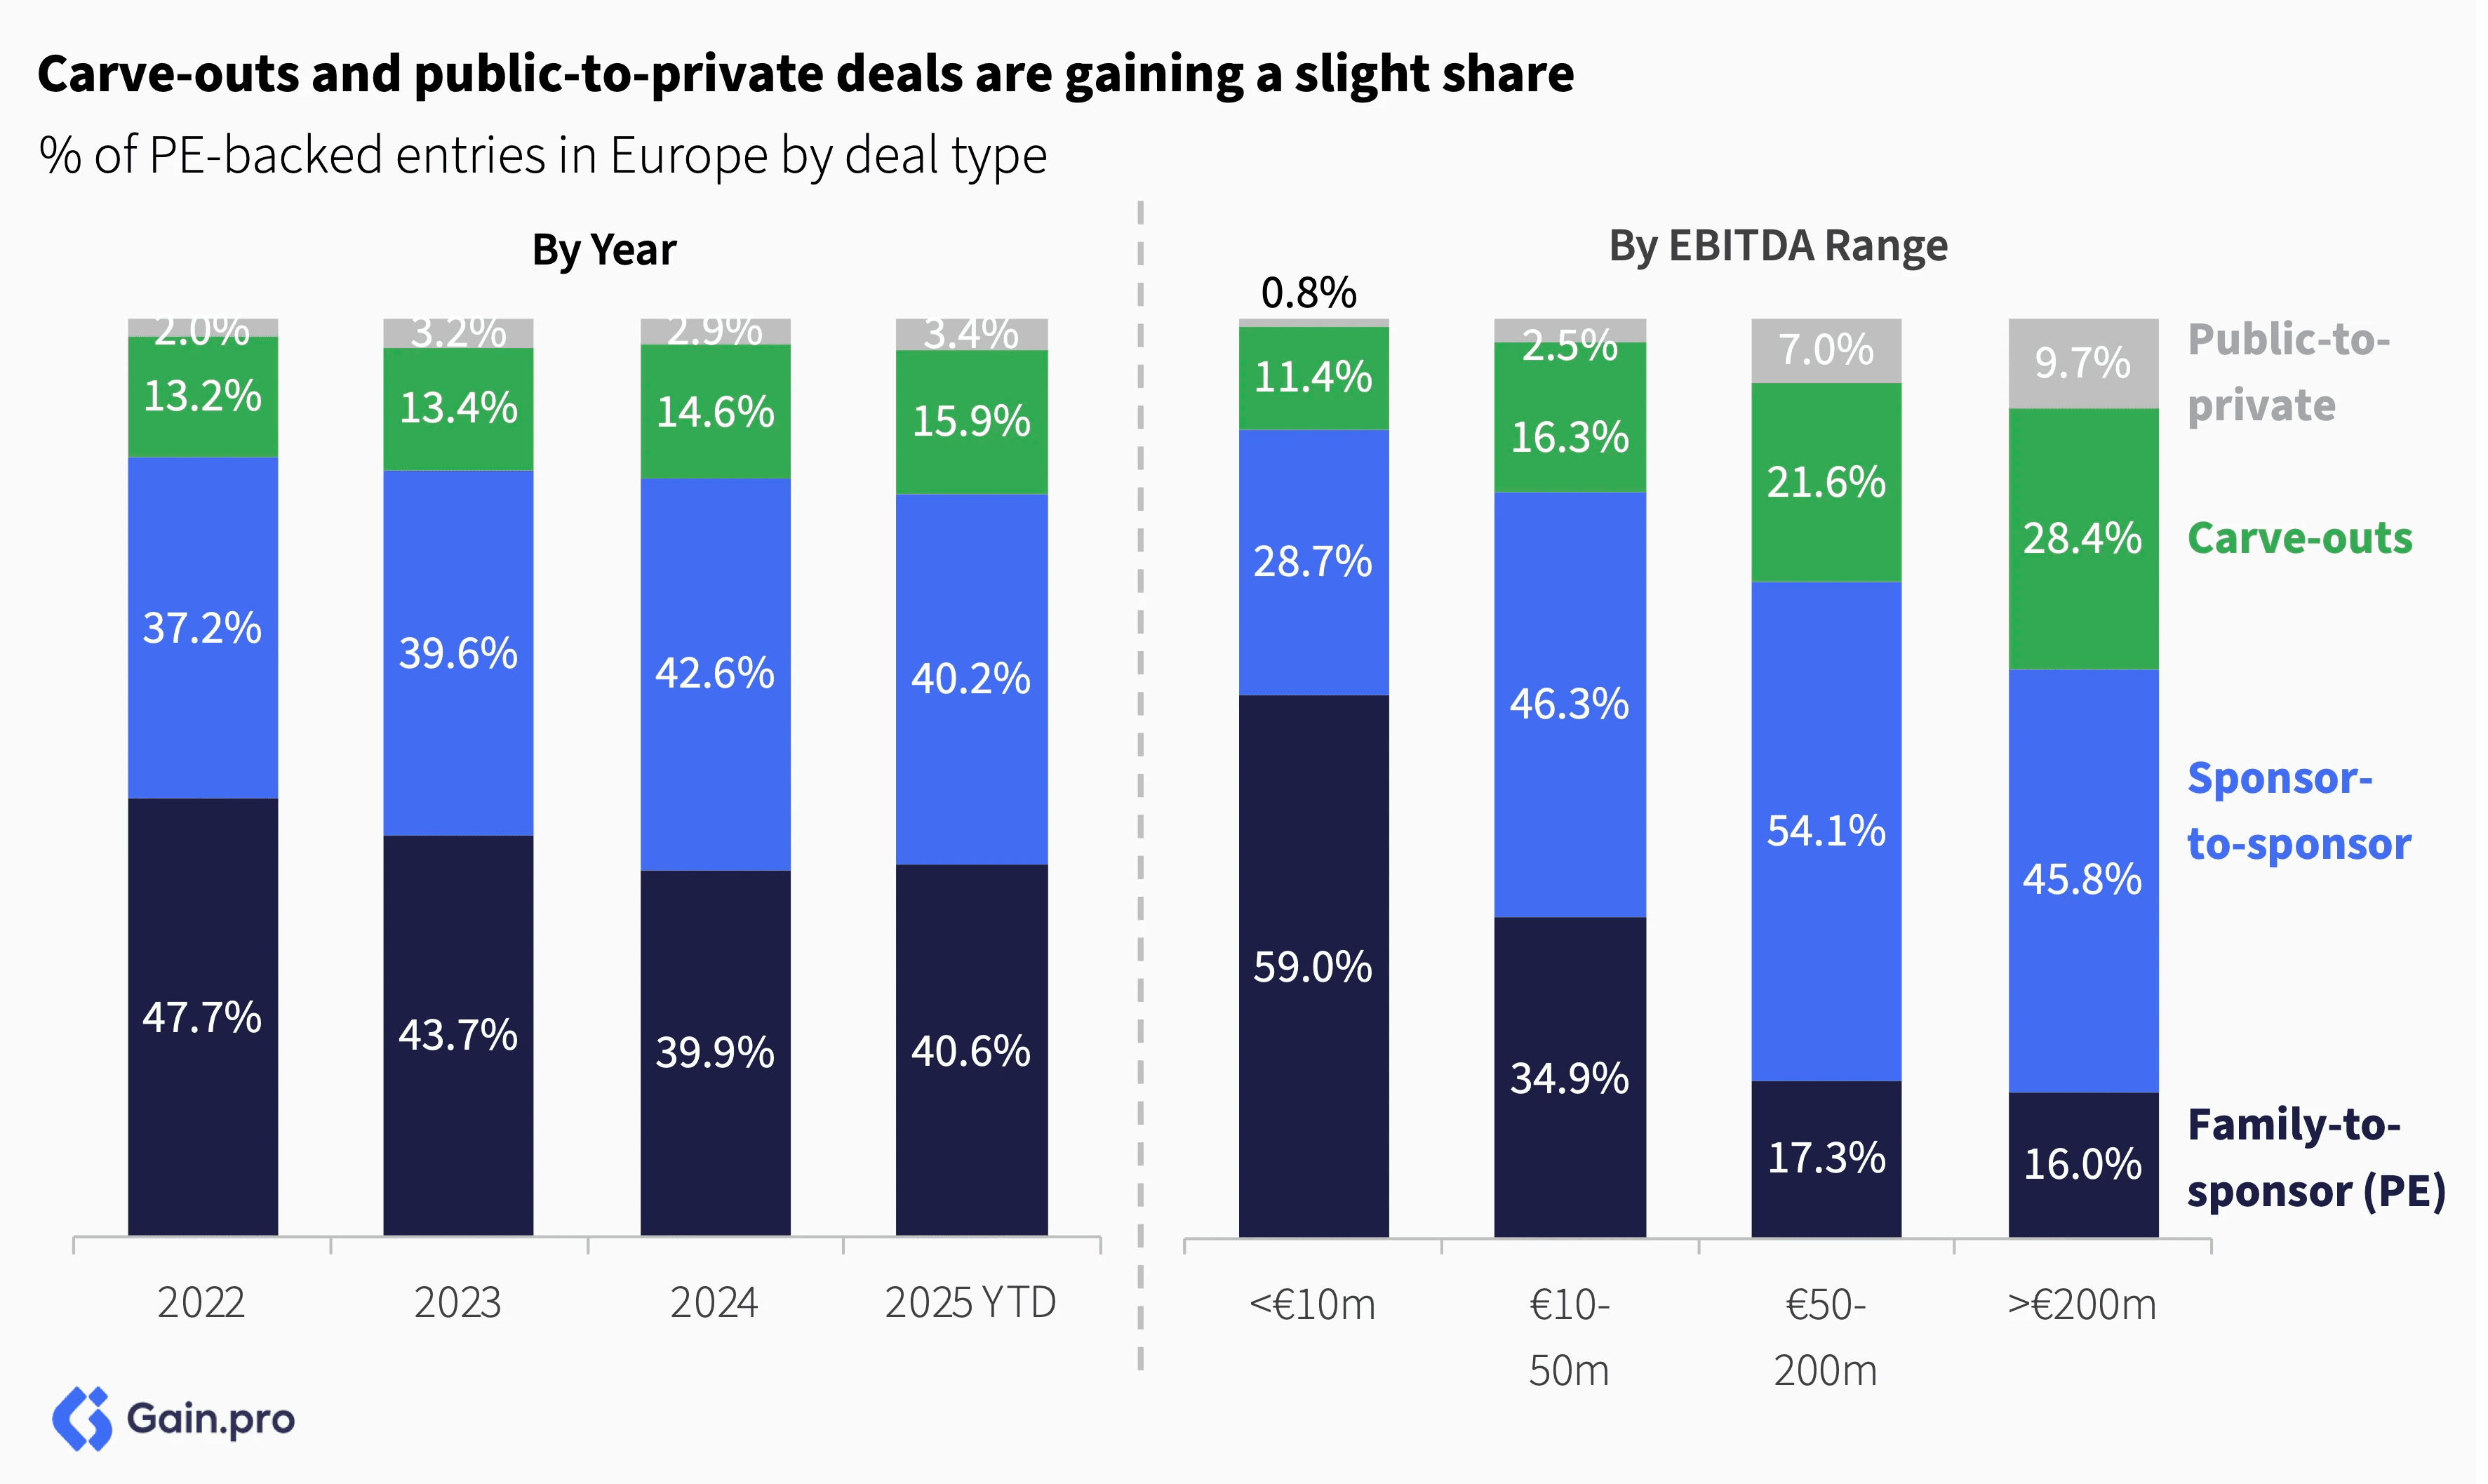
Sponsor-to-sponsor (40%) and family-to-sponsor (41%) transactions account for the largest share of PE entries, though carve-outs and public-to-private deals are gaining a slight share. Broadly, lower EBITDA ranges are dominated by family-to-sponsor deals, while carve-outs and take-privates become more popular as target size increases. Among transactions above €200m EBITDA, 28% are carve-outs and 10% are take-privates.
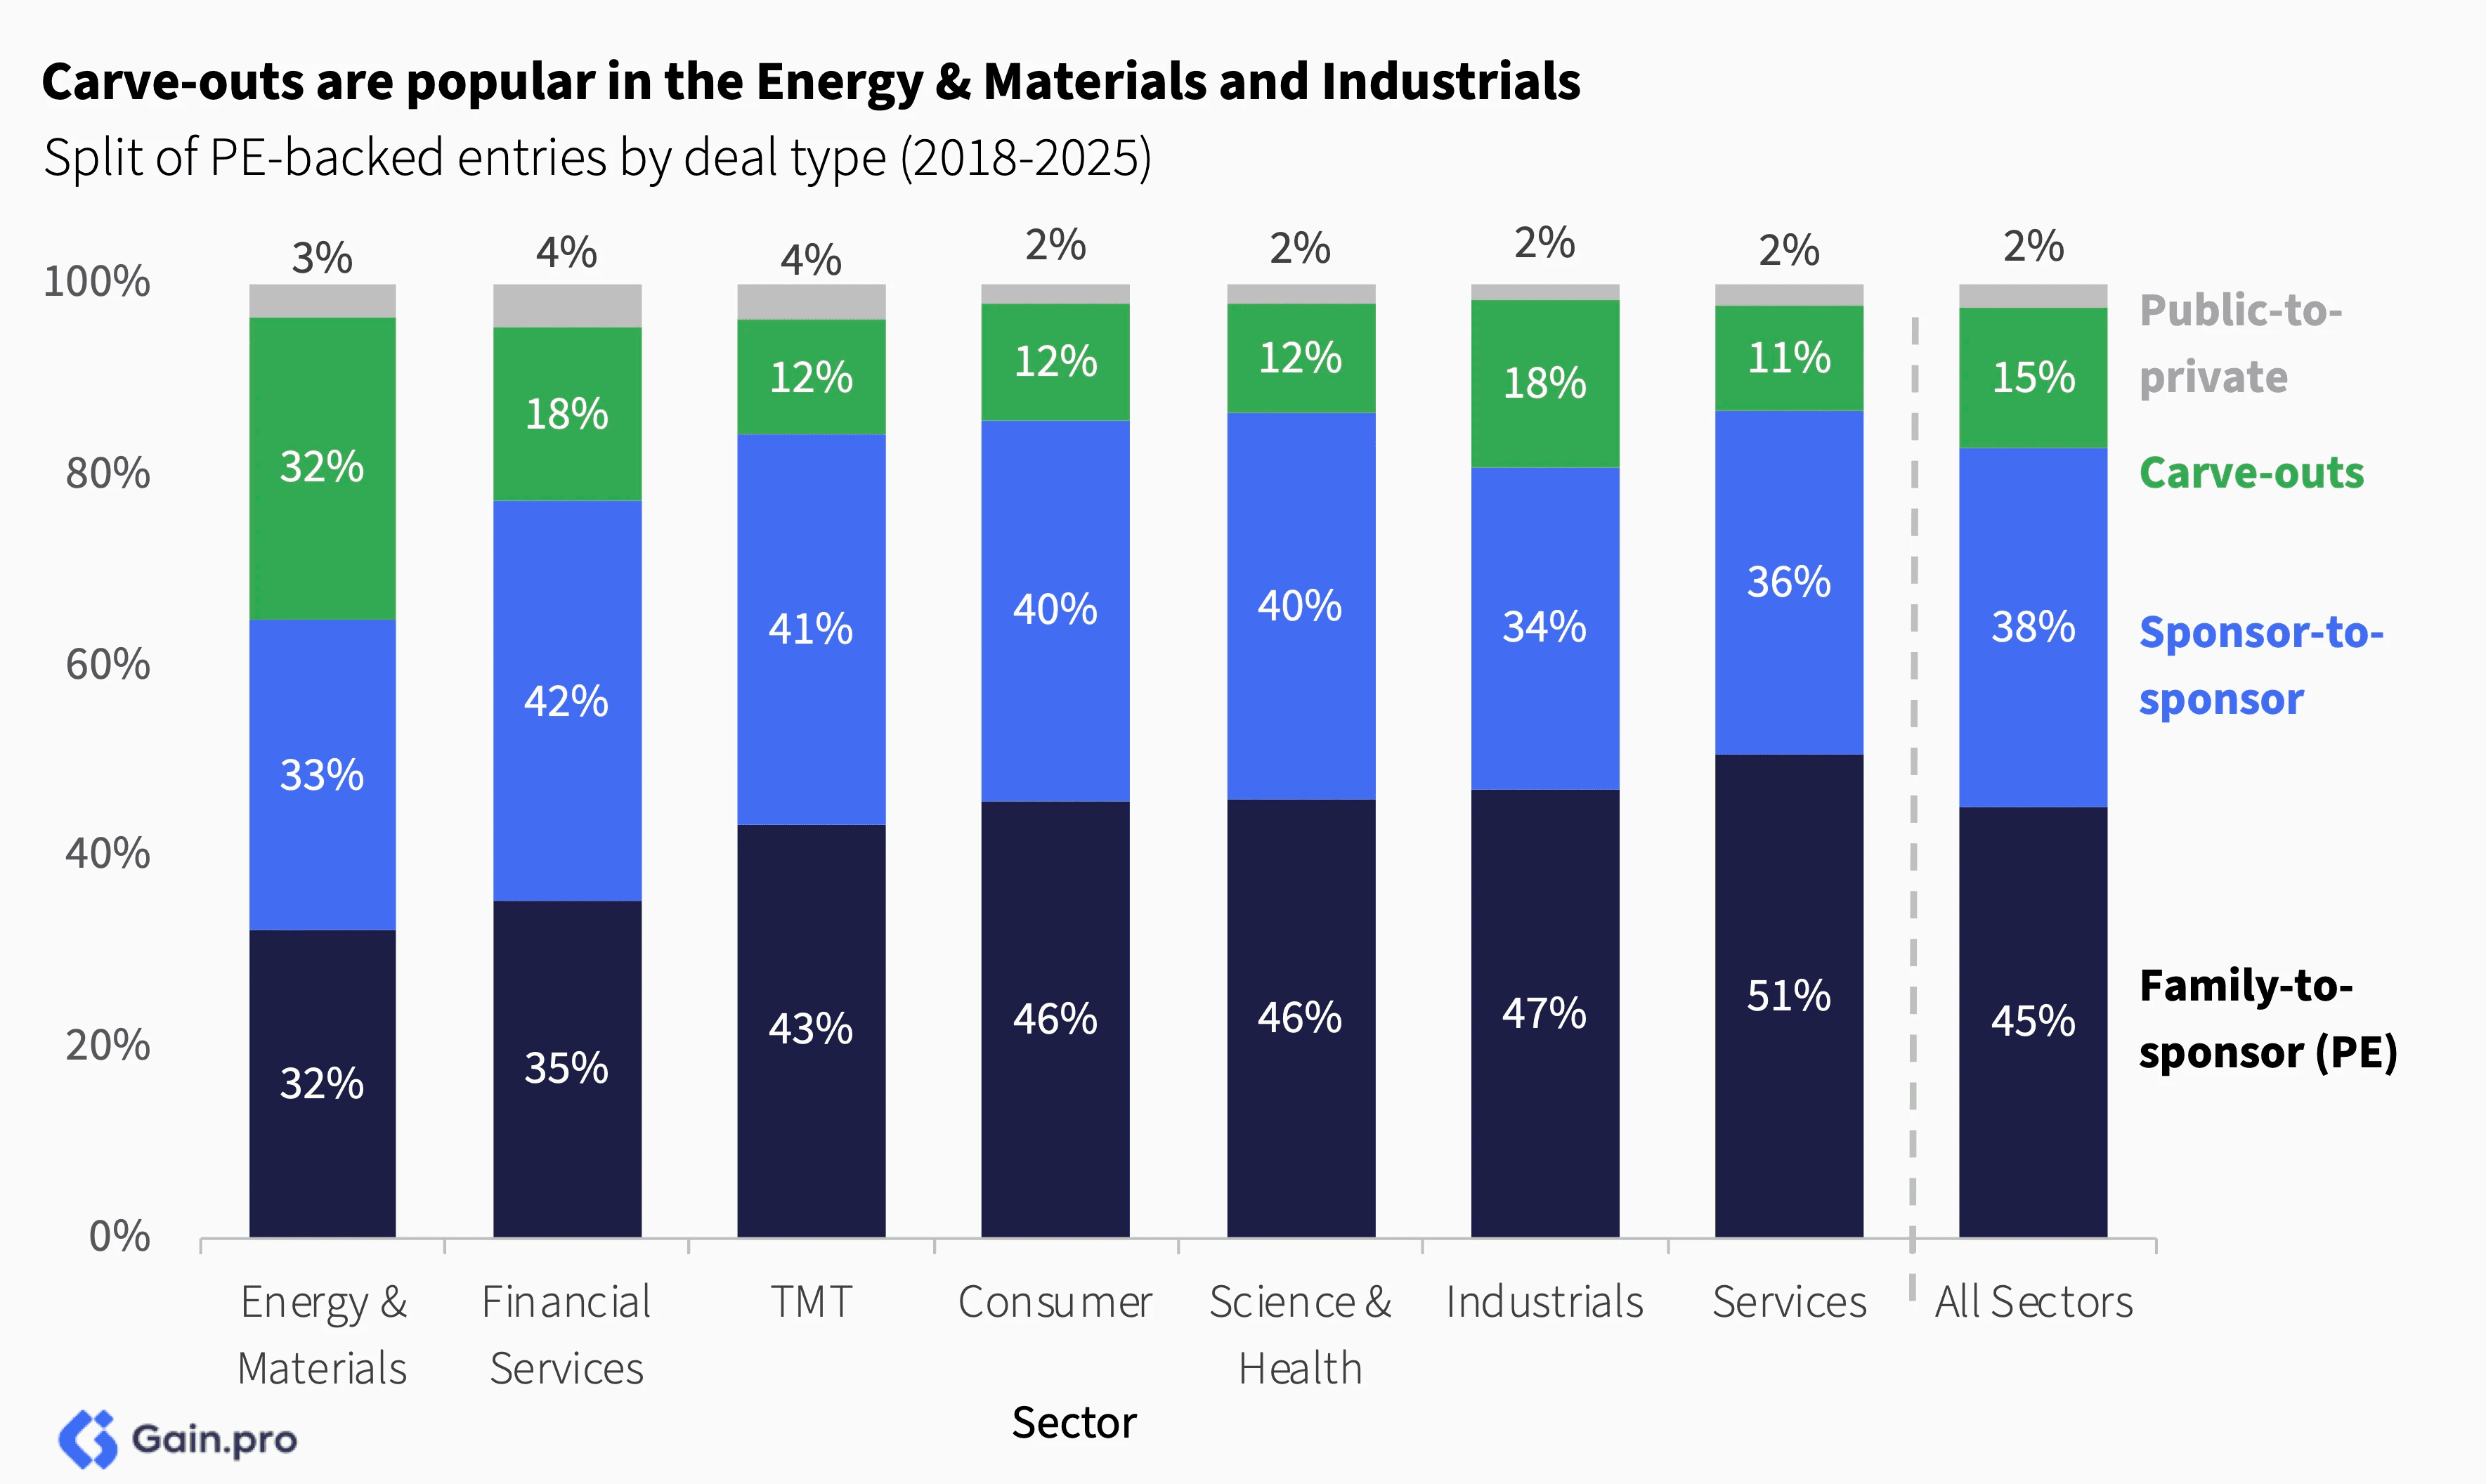
Family-to-sponsor deals remain the dominant entry type across most sectors, though notable sectoral differences exist. Carve-outs are more popular in Energy & Materials, as large conglomerates divest non-core assets to sharpen strategic focus. Family-to-sponsor deals, on the other hand, are more common in Services, as many family businesses bring in PE investment to scale operations.
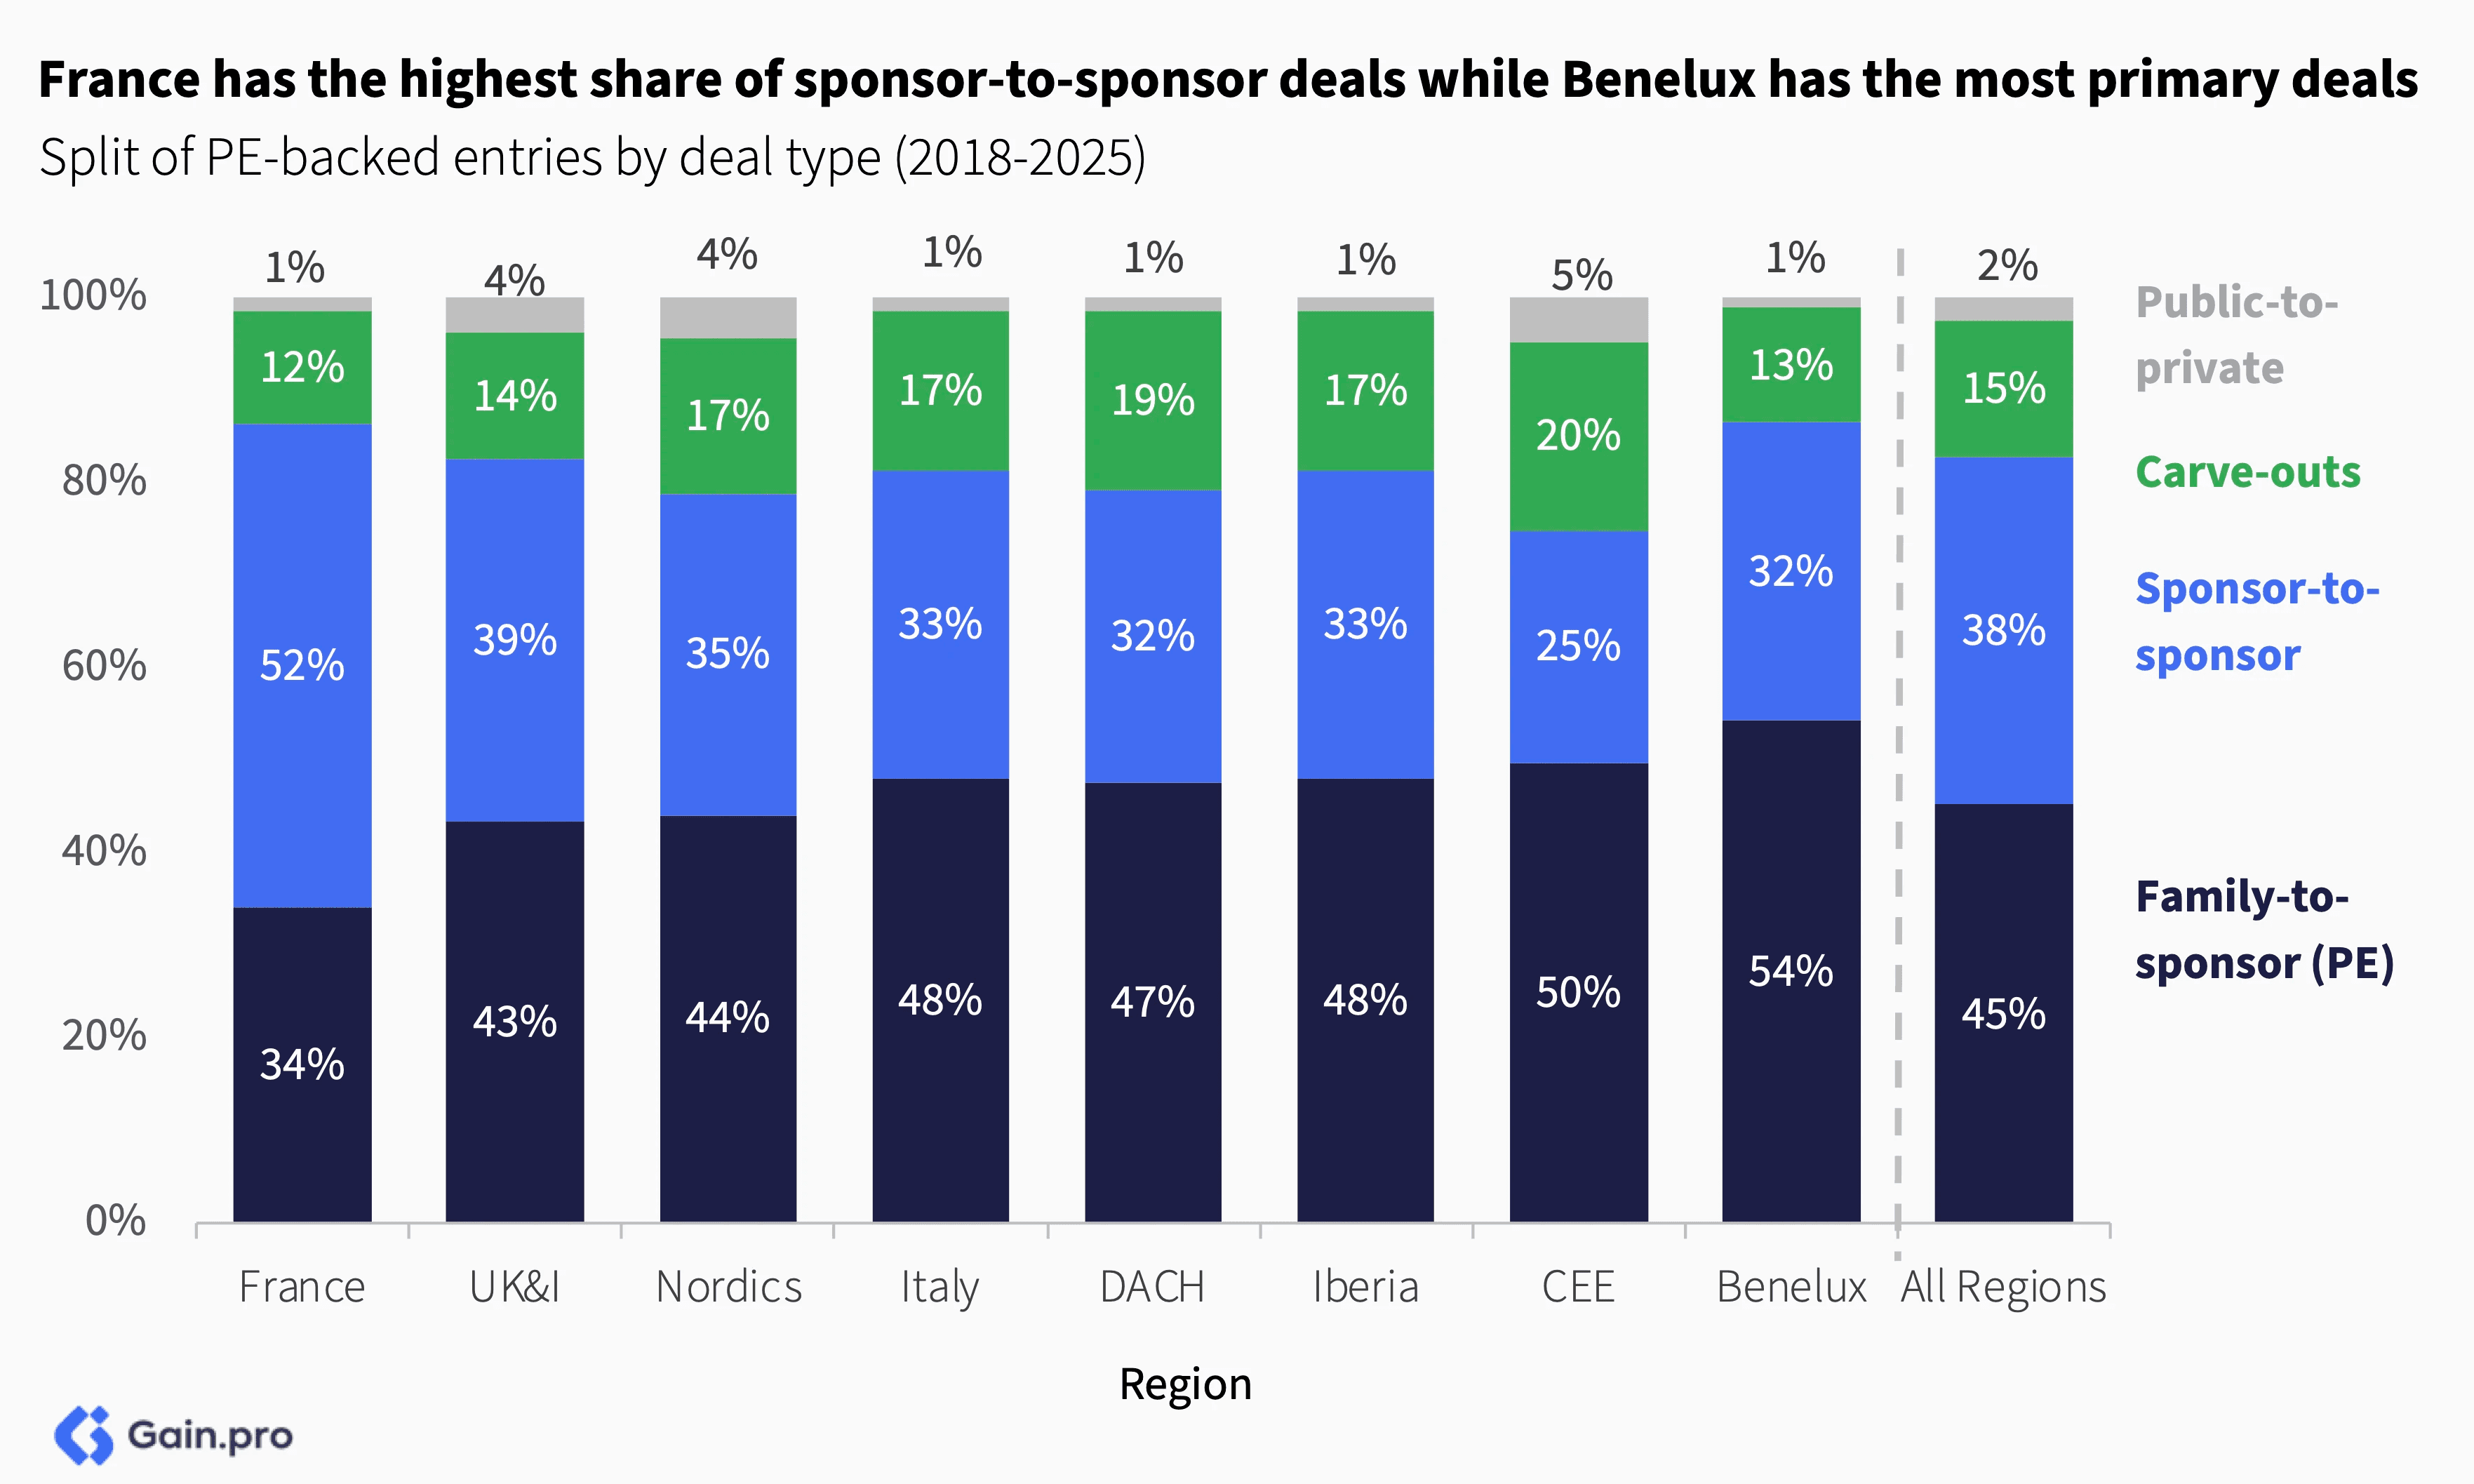
Family-to-sponsor (PE) deals dominate entries across regions. France is distinctive, with 52% of all entries being sponsor-to-sponsor deals (compared to 38% across Europe). This aligns with France's high PE penetration rates, which naturally result in a greater share of investor-to-investor transactions.
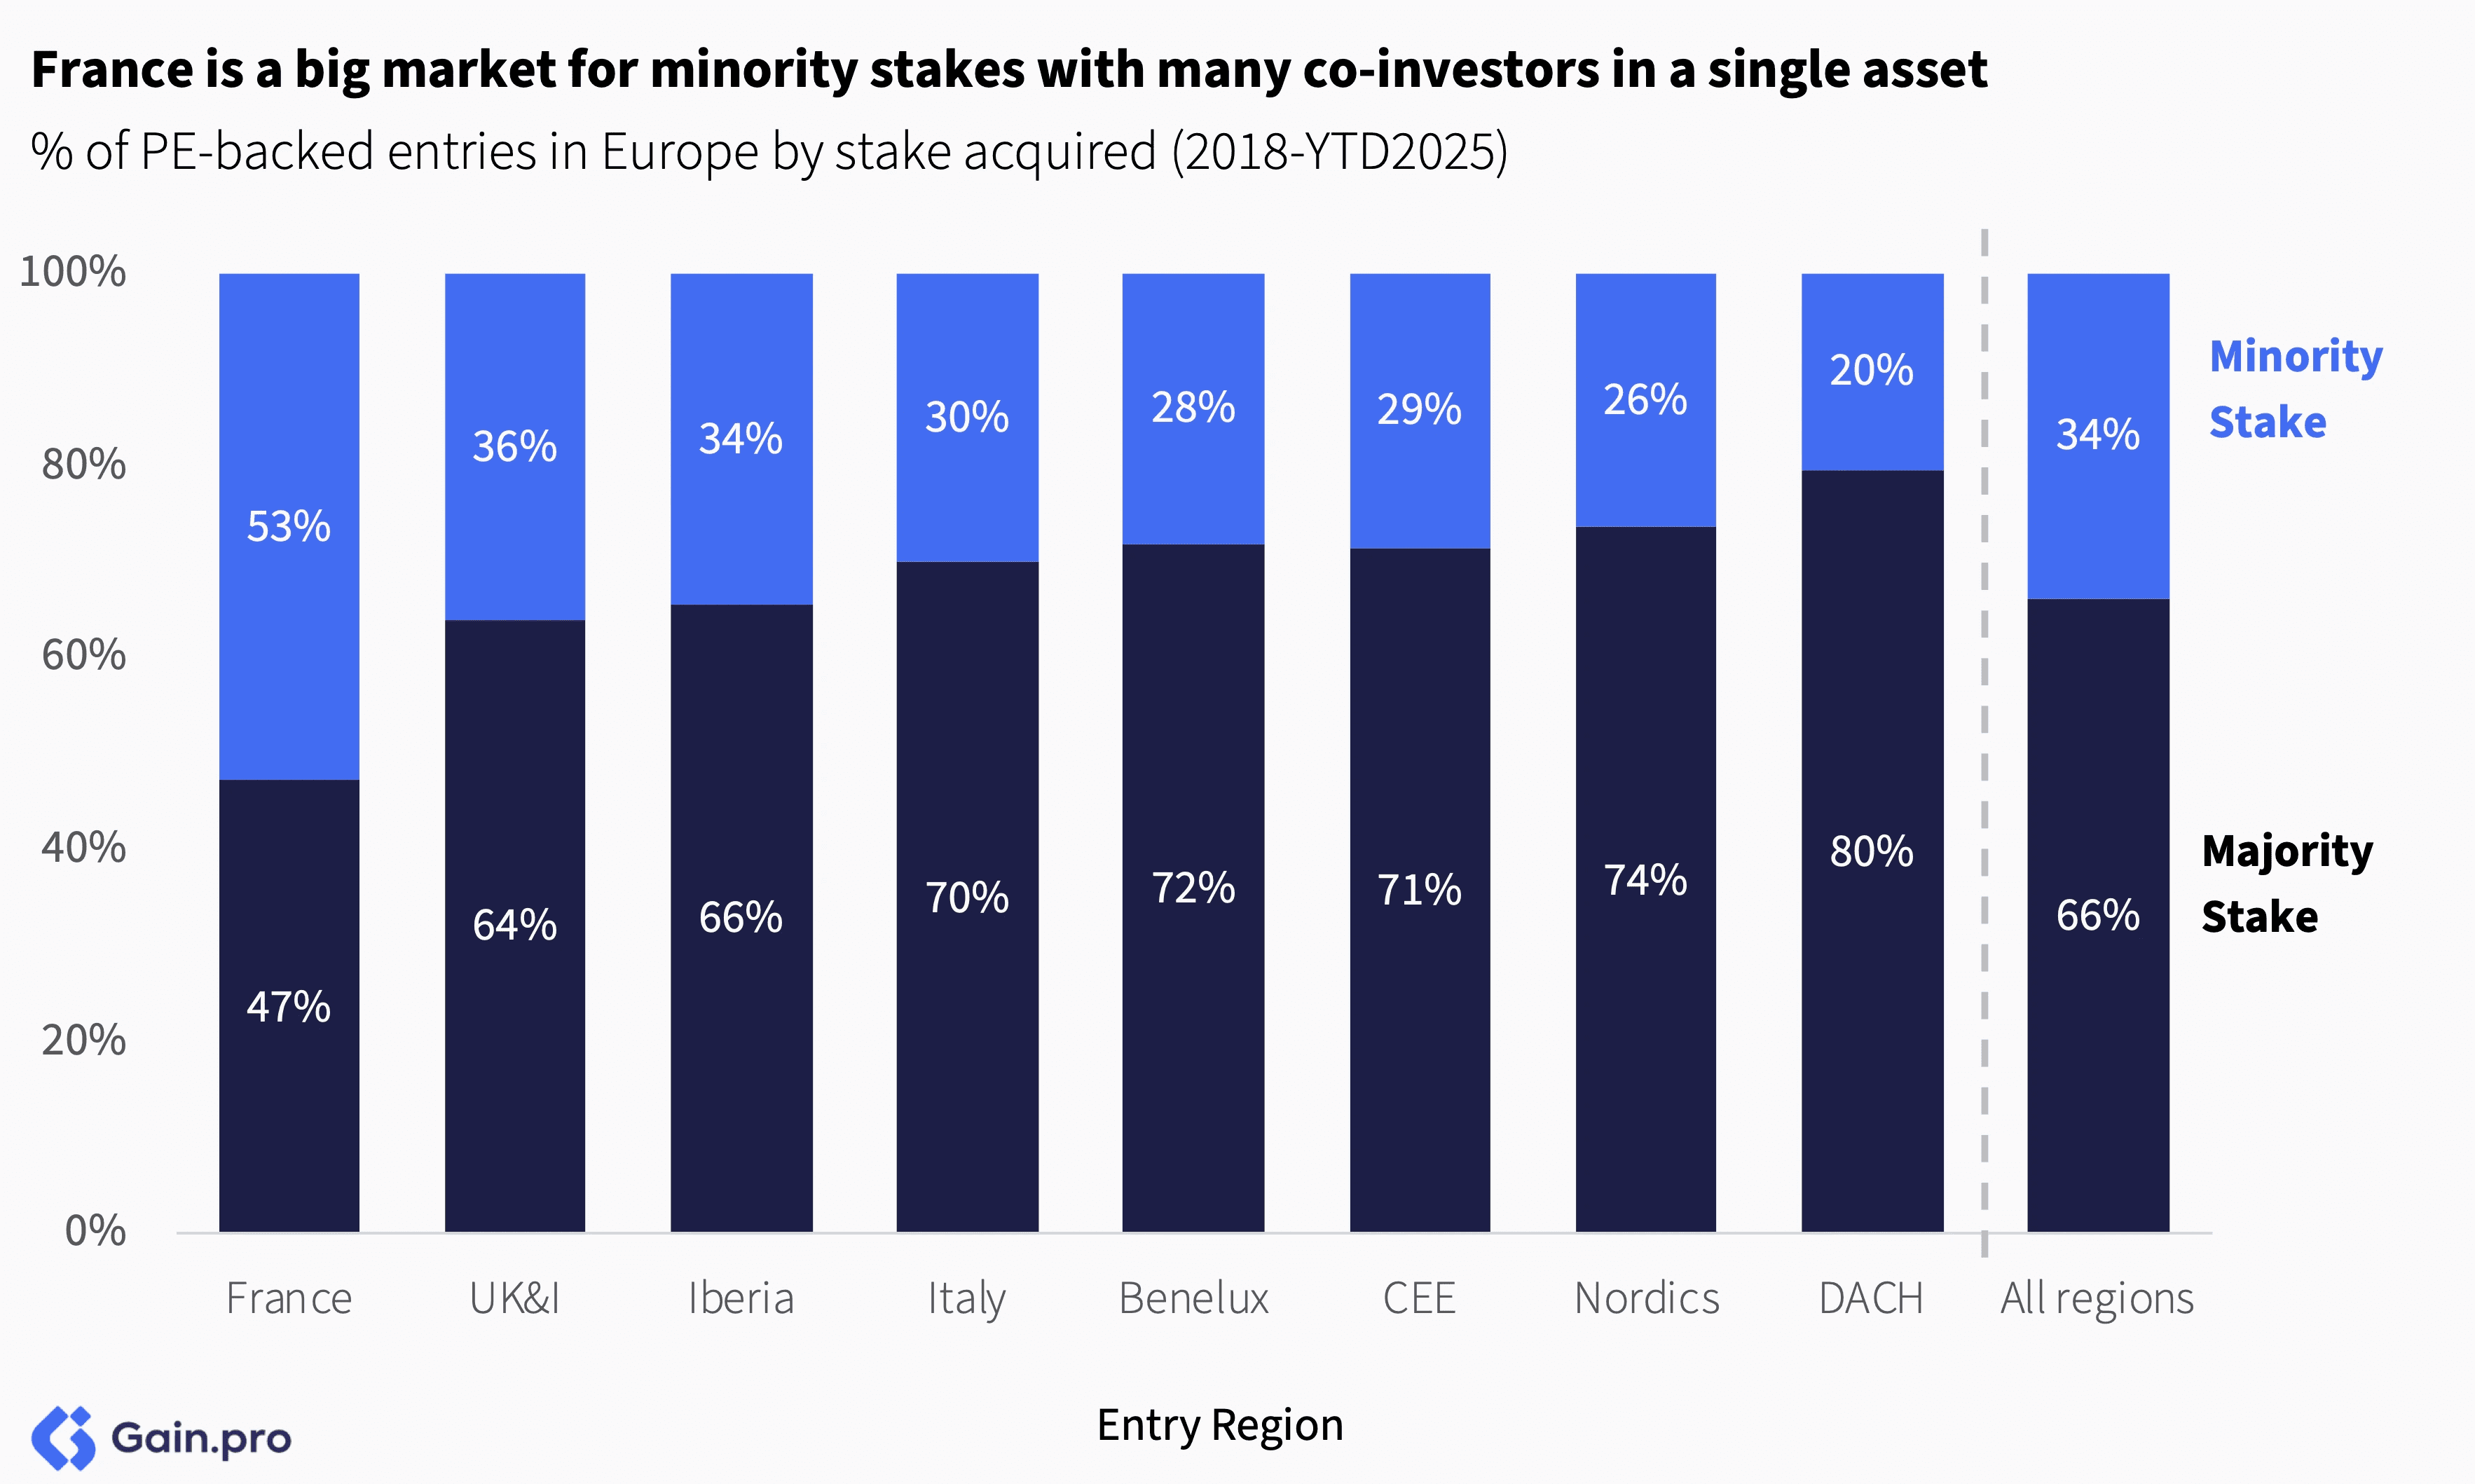
By share, majority investments accounted for 66% of all PE deals, with the overall mix remaining stable over the years. The preference for majority stakes was highest in Industrials (73%) and Services (66%), sectors that typically favor full buyouts due to traditional ownership structures.
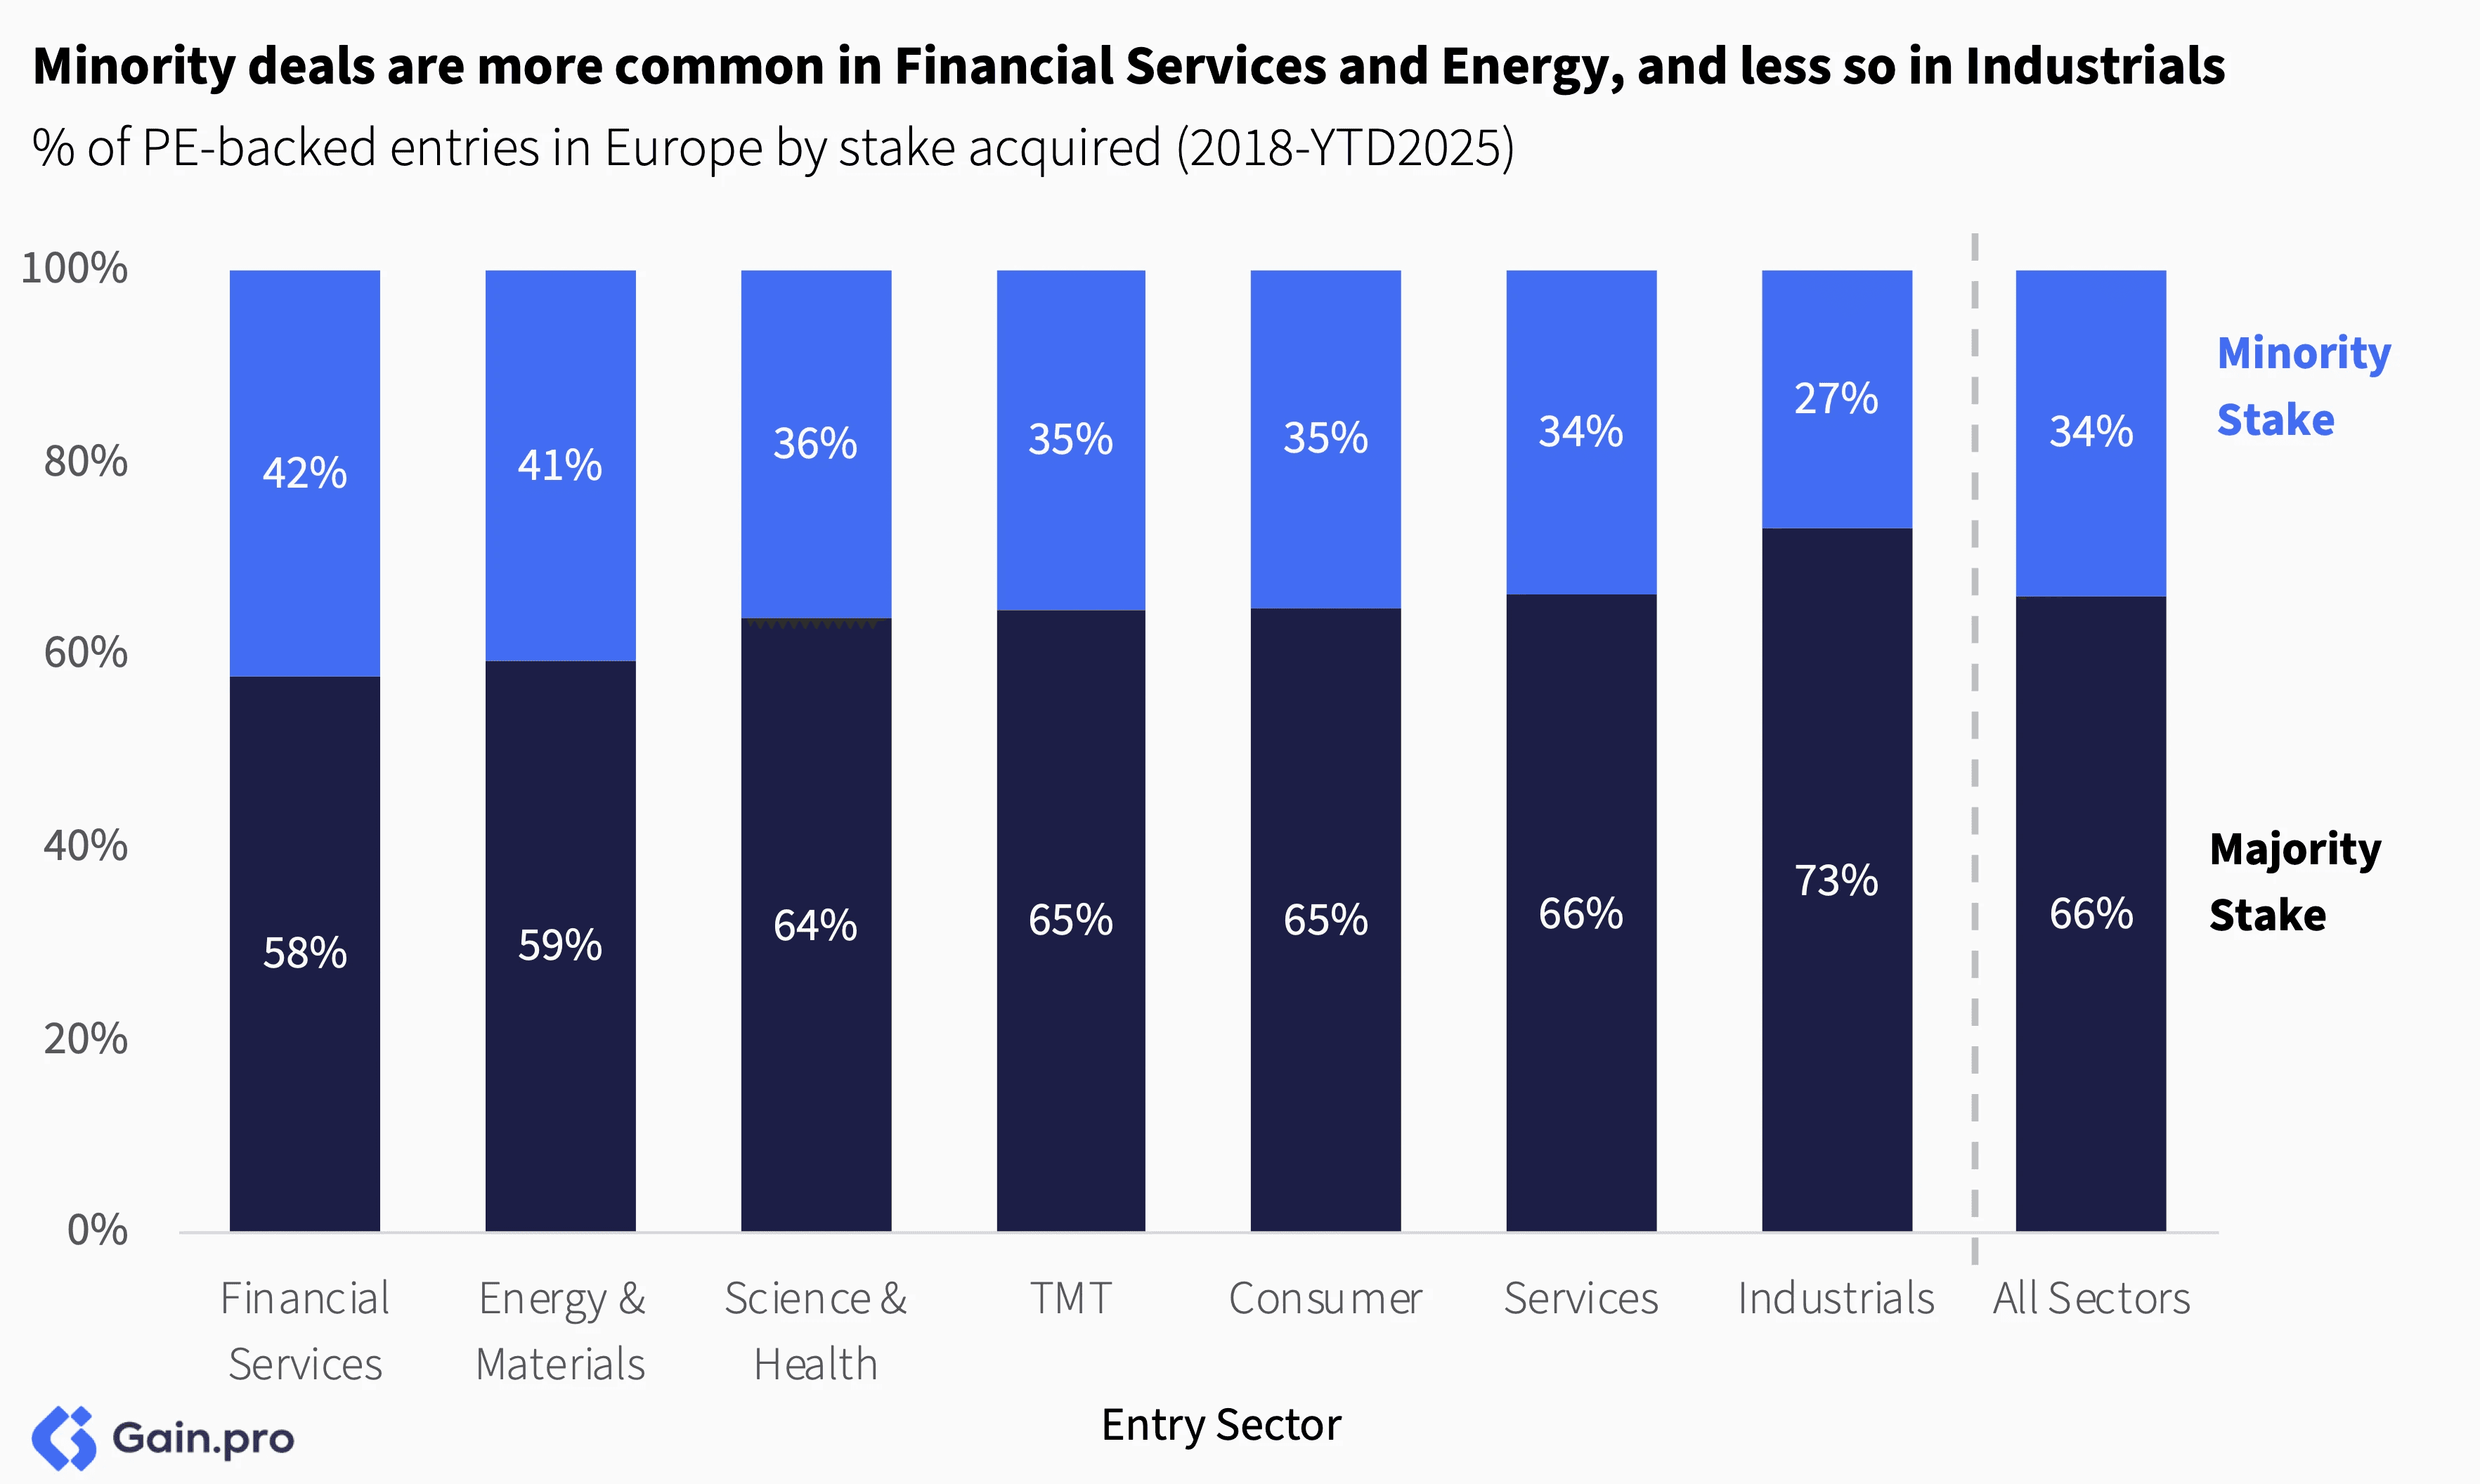
France stands out as a big market for minority stakes, with many co-investors in a single asset. 53% of PE-backed entries in France were minority stakes (compared to just 20% in DACH).
Cross-Border Activity
Cross-border deal activity from North American investors has risen, up by +9pp in the last 7 years. This trend is partly driven by relatively lower valuations in Europe compared to the US, making it an attractive target market. Further, US-headquartered funds have had stronger fundraising momentum, allowing them to outcompete in many deal situations. The expansion of direct lending markets has also facilitated cross-border activity by providing flexible financing alternatives to traditional bank lending. Many US investors have launched dedicated European funds and announced regional expansion plans as well.
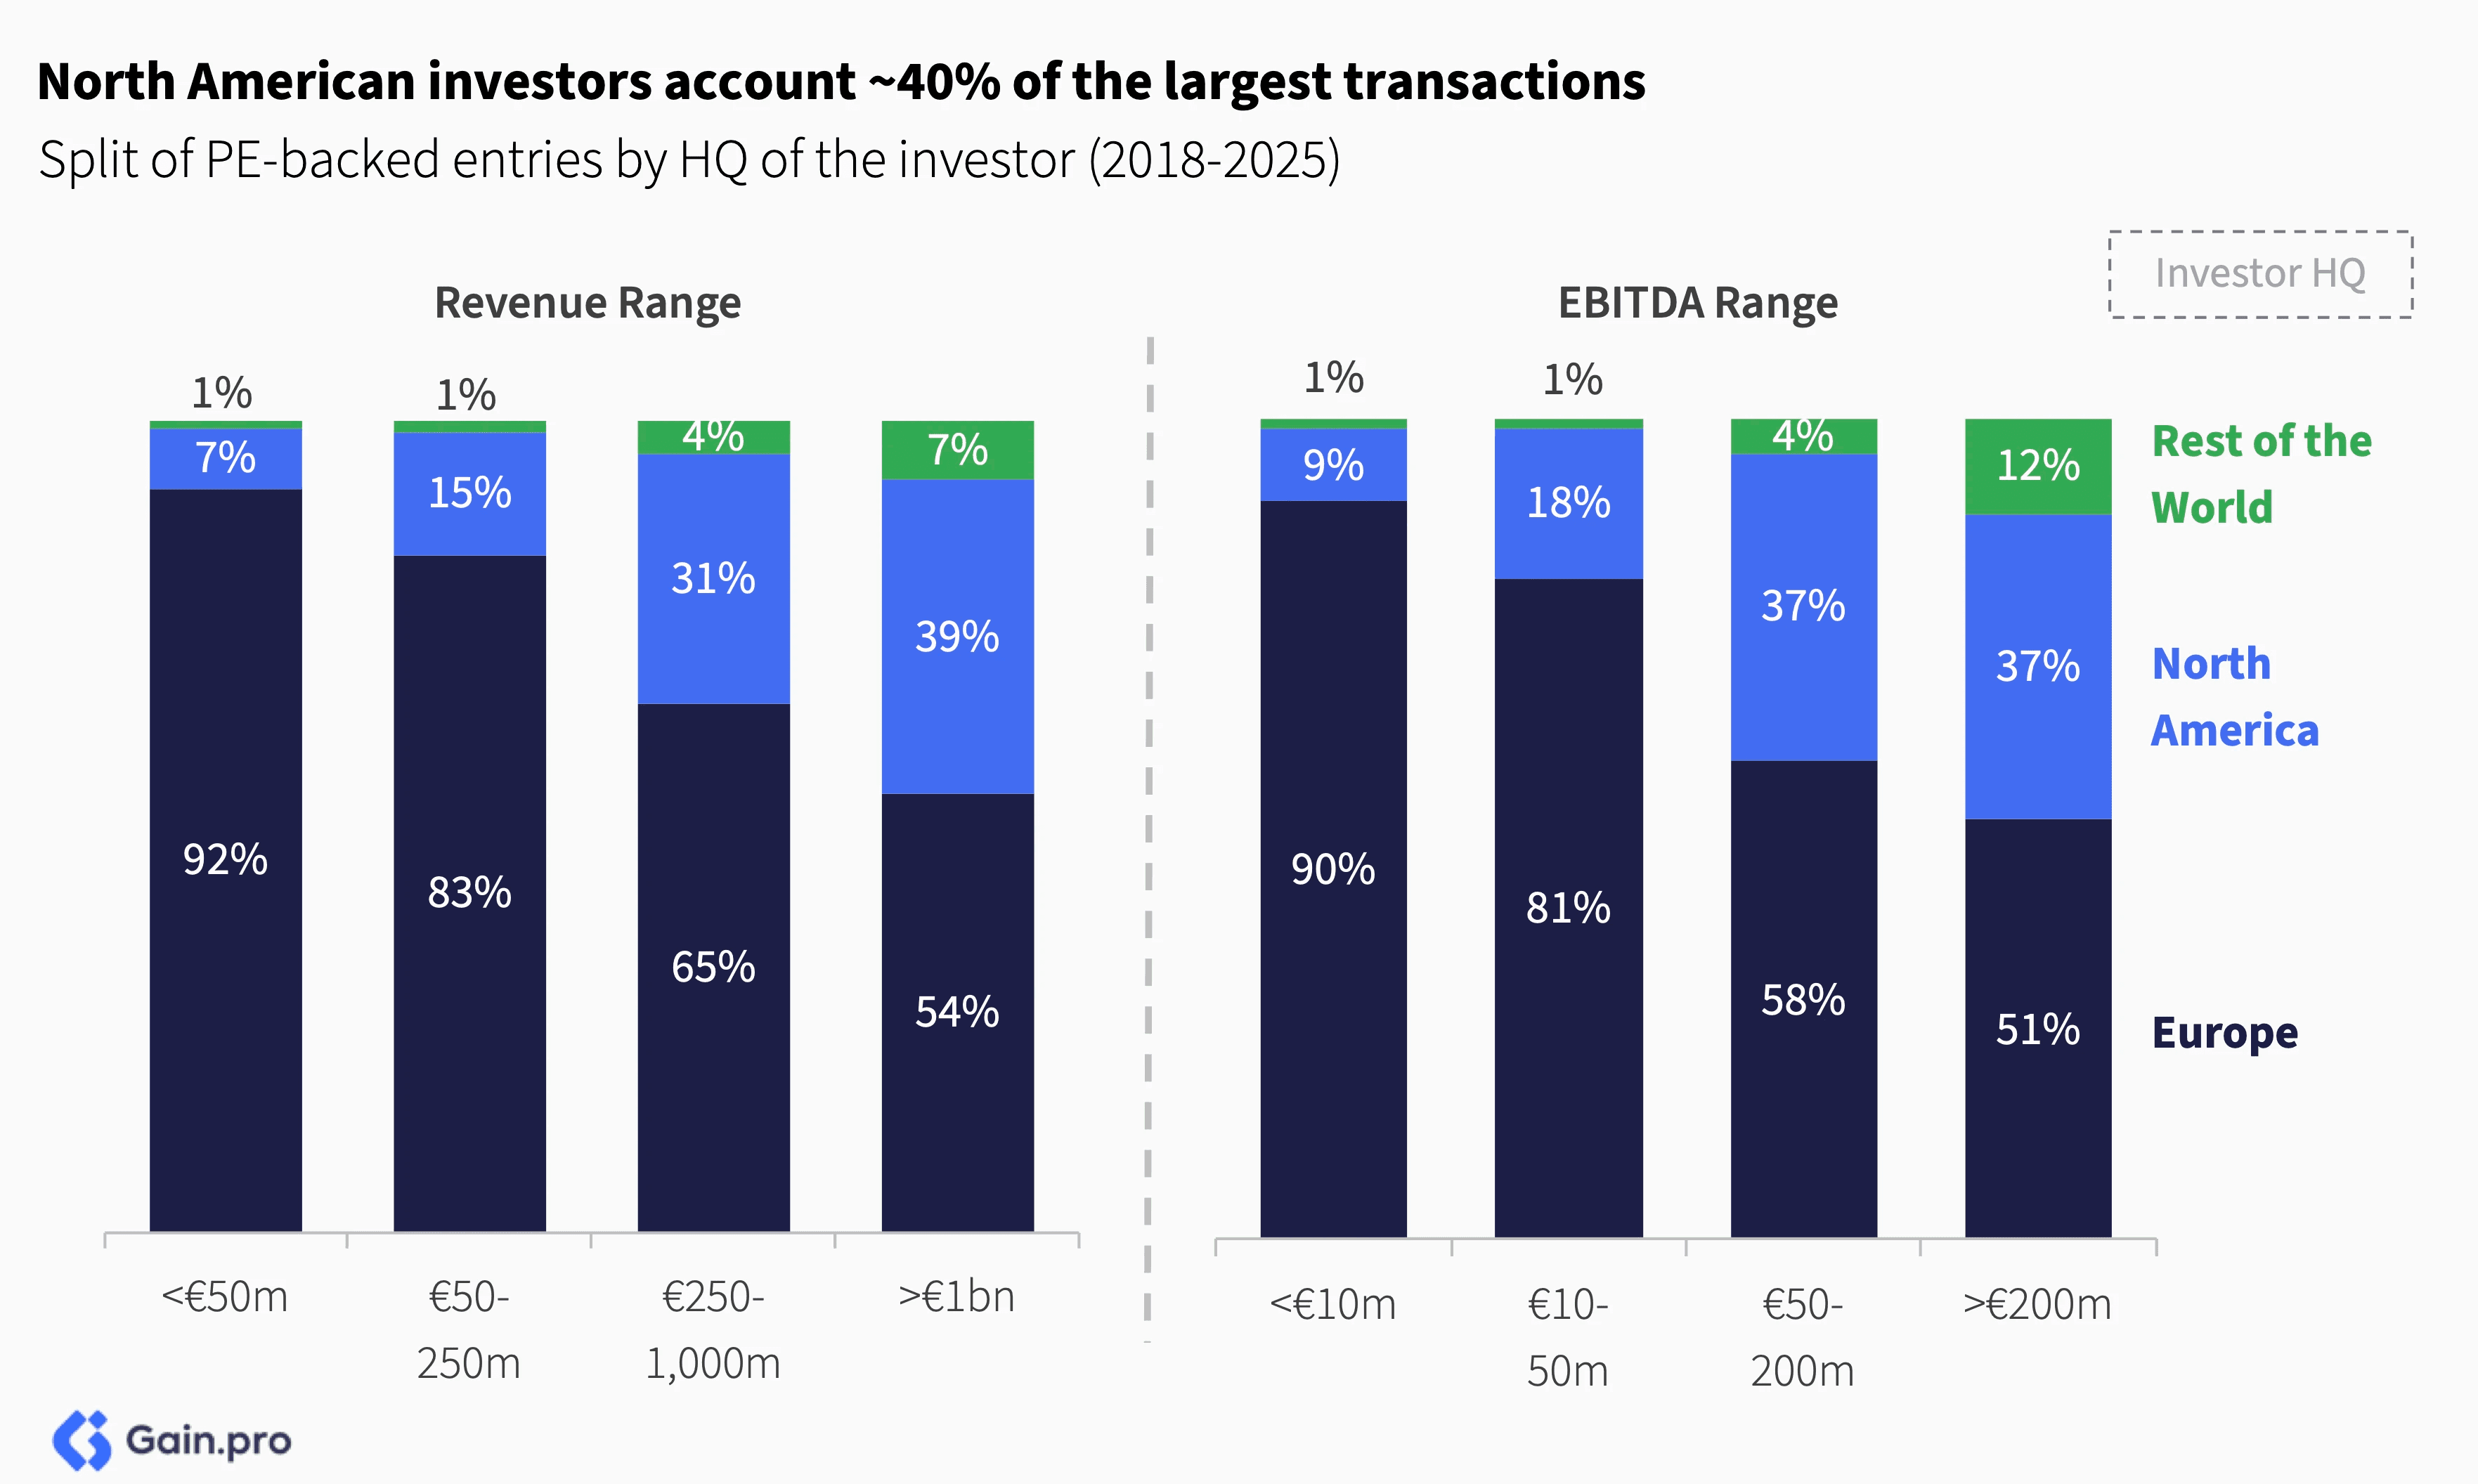
North American investors account for 37% of mid-cap (€50-200m EBITDA) and large-cap transactions (>€200m EBITDA). European investors, meanwhile, remain relatively more active in smaller deal segments: <€10m and €10m-€50m EBITDA brackets.
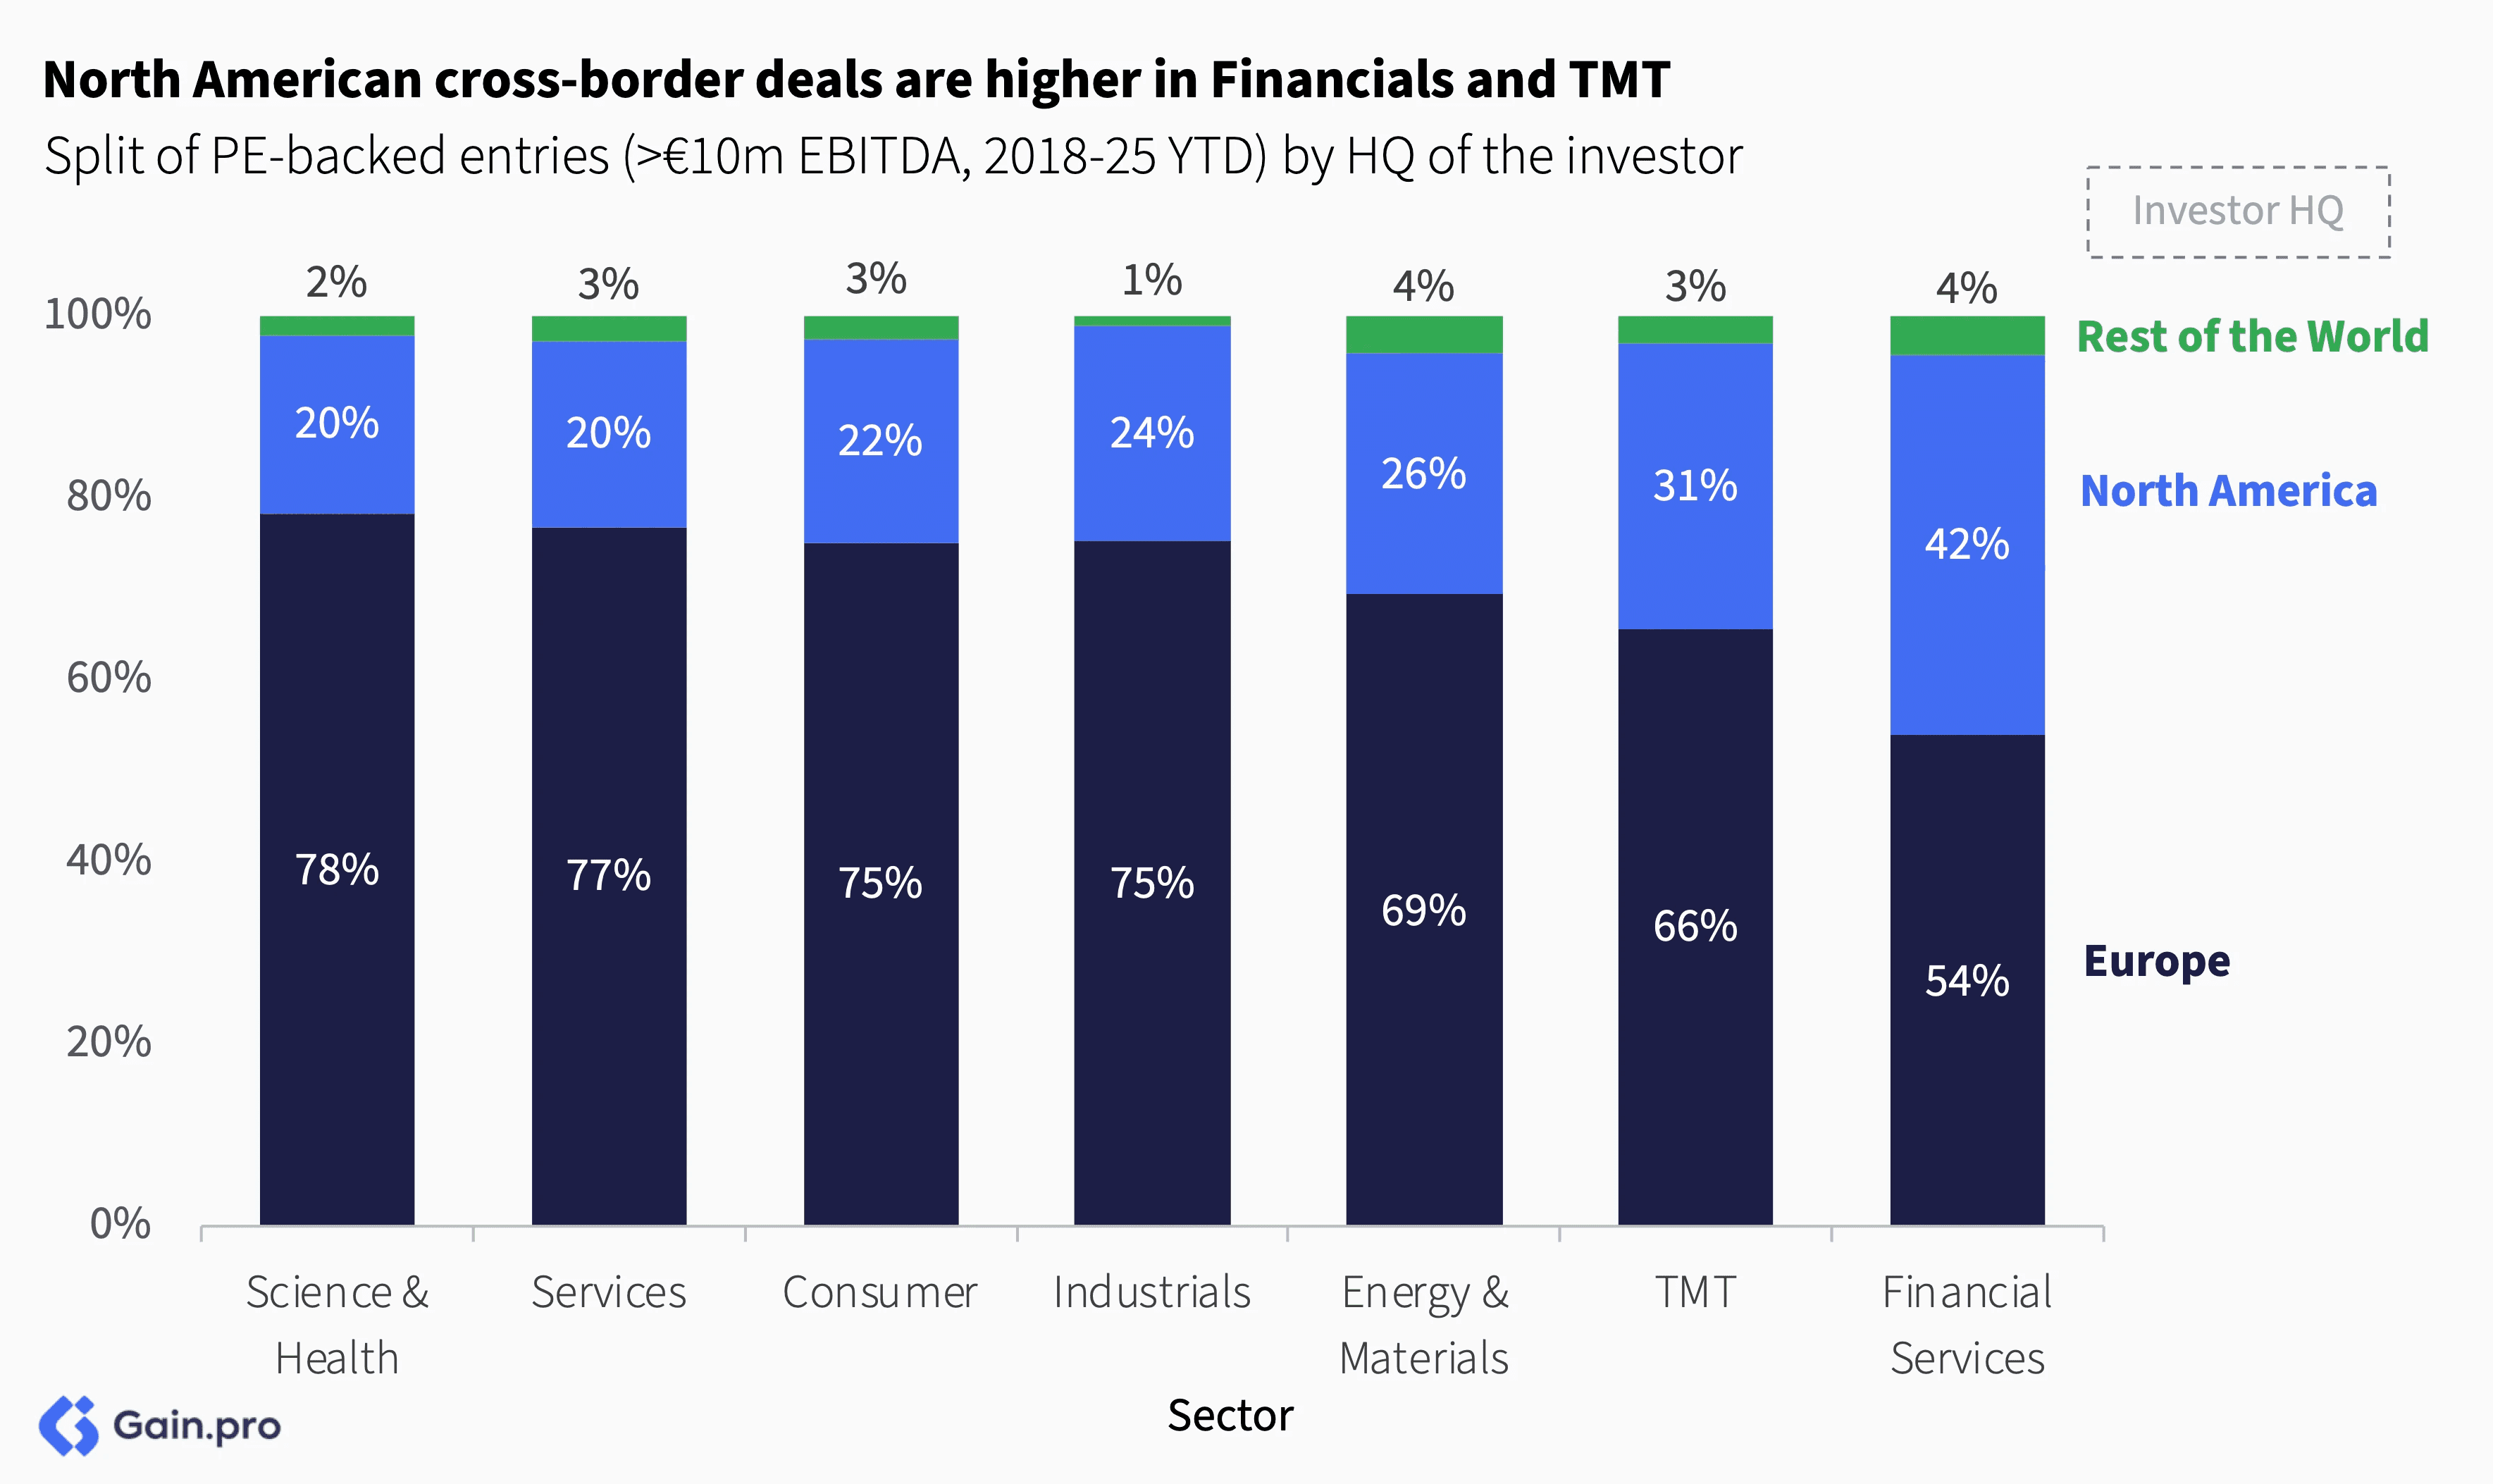
North American investors account for a larger share of entries in Financial Services (42%) and TMT (31%), given their experience and expertise in these sectors. In contrast, European investors dominate Science & Health, Services and Consumer investments due to their localized nature, smaller sizes and regulatory complexities.
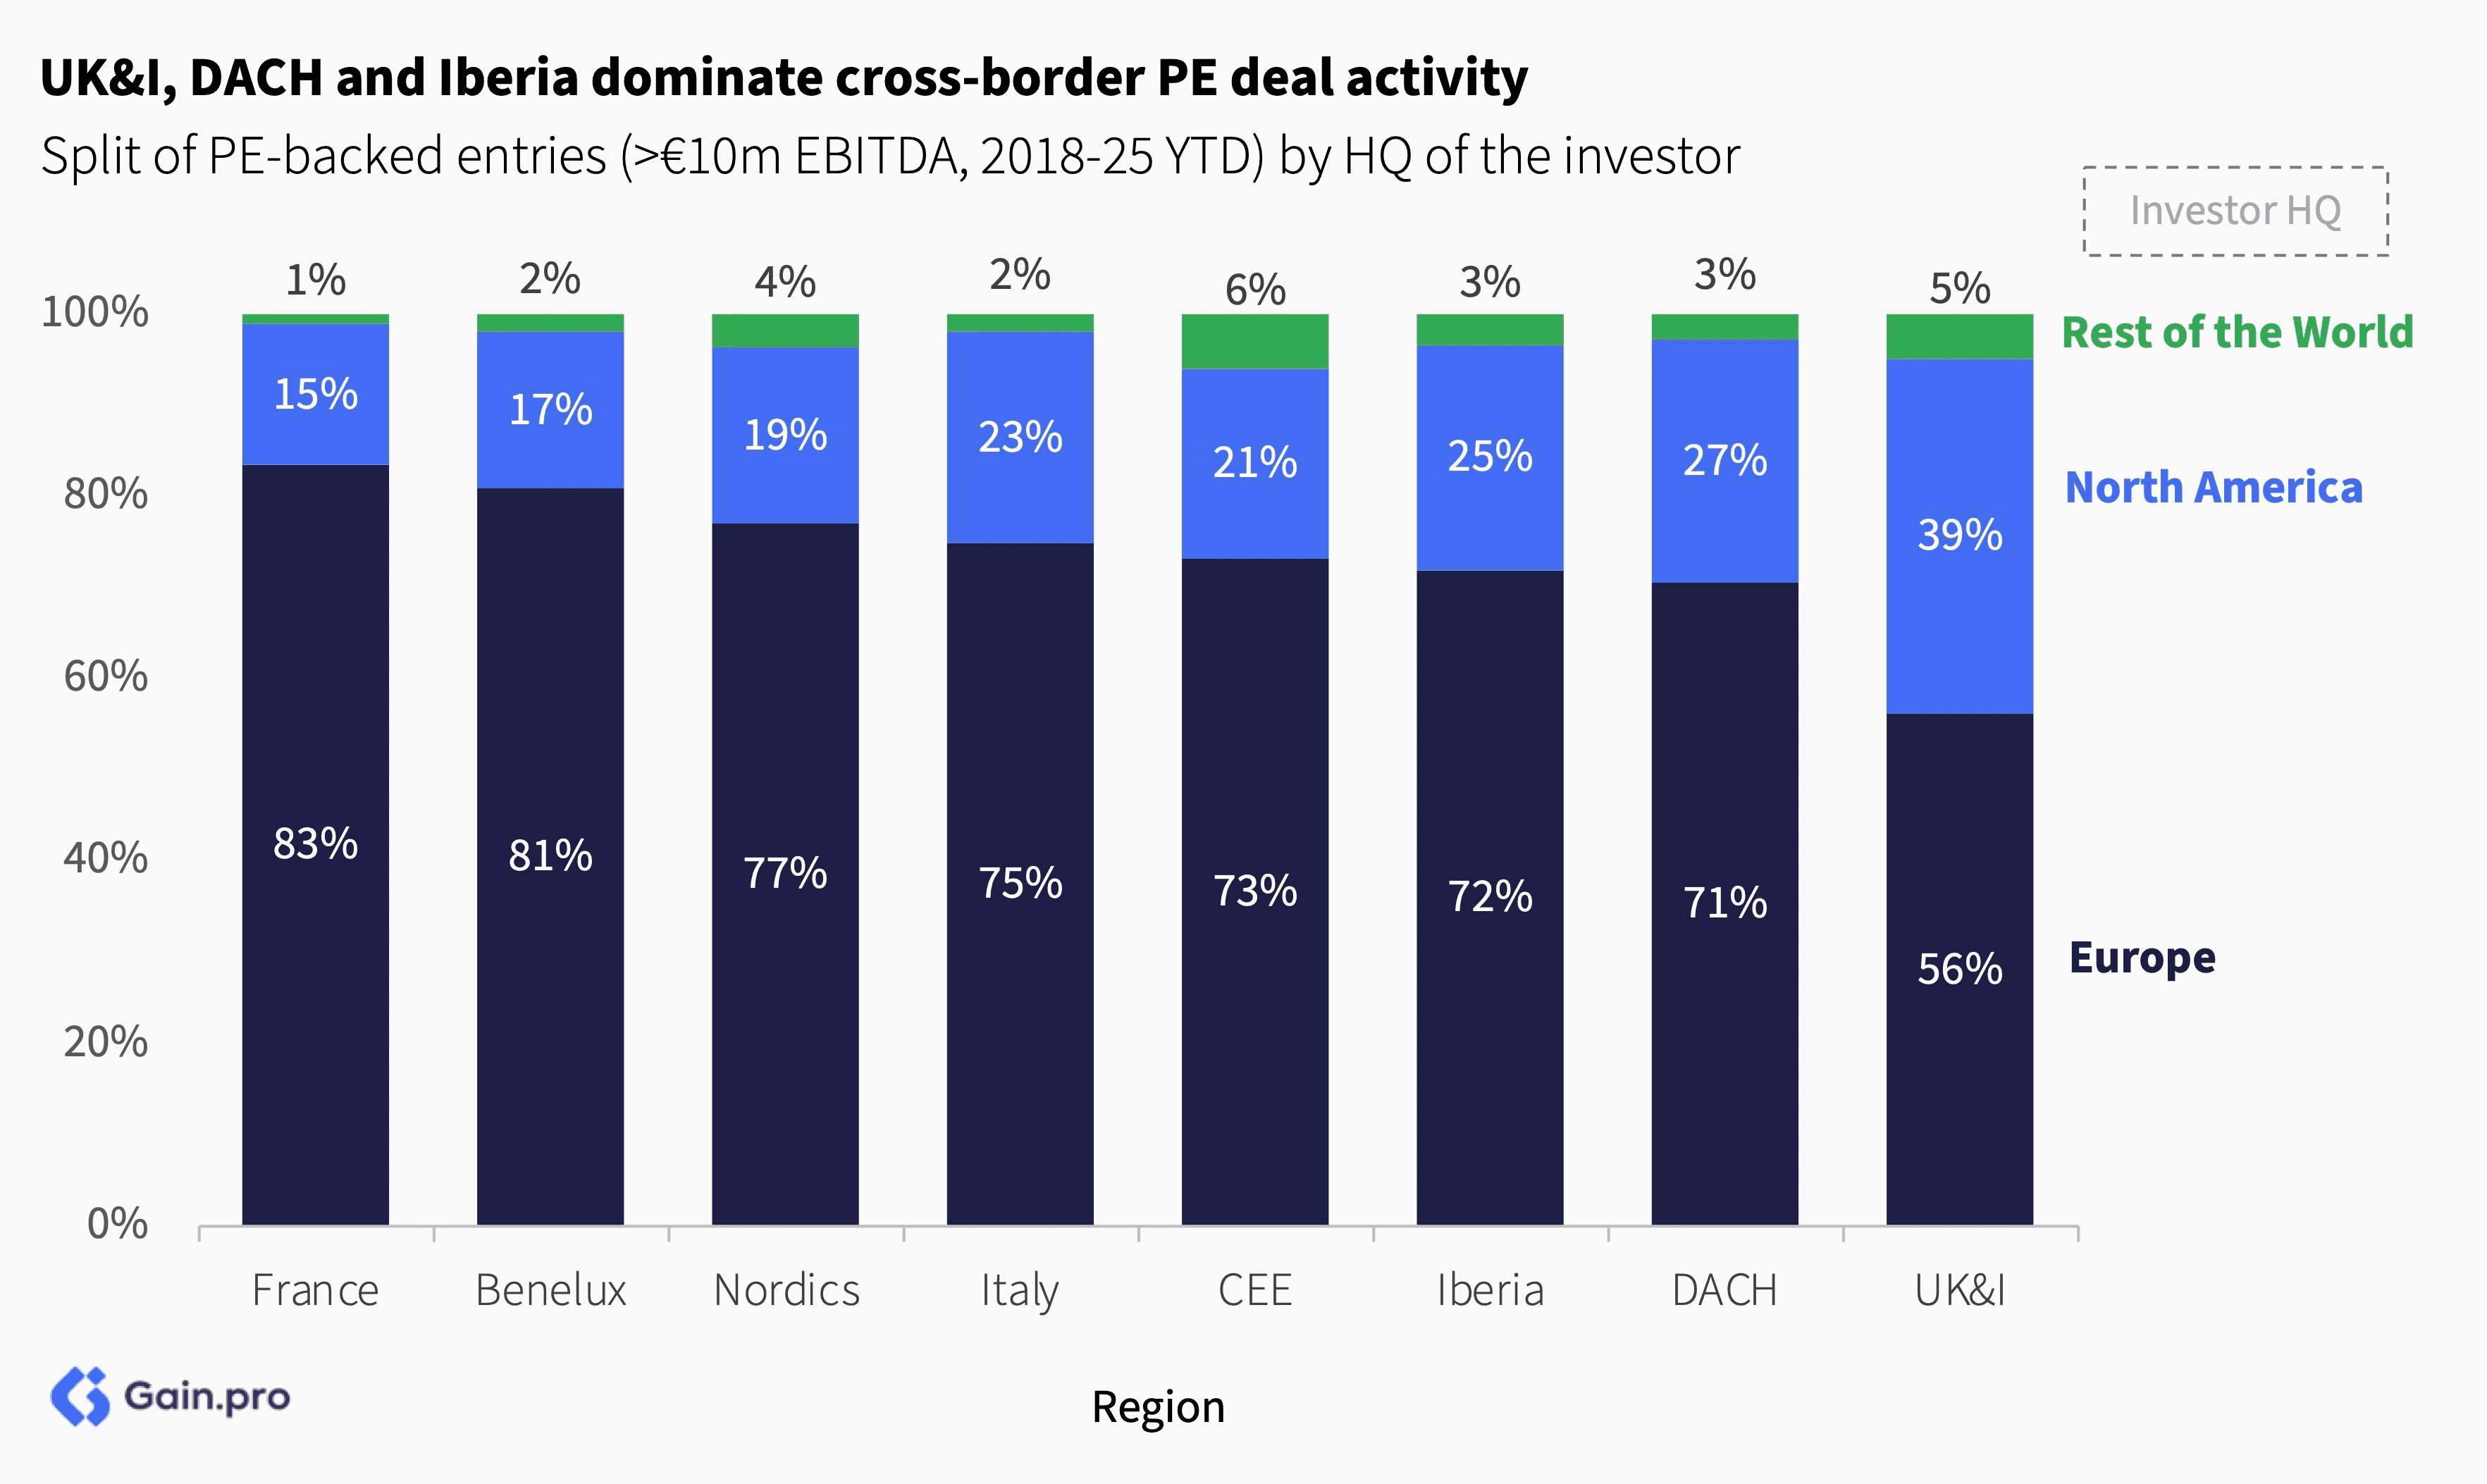
Cross-border PE activity is more prominent in UK&I, DACH and Iberia compared to other European regions. France, in contrast, has a limited share of international investors — only 15% of entries above €10m EBITDA involve sponsors headquartered outside the country, reflecting the dominance of local PE investors.
Chapter 02: Buy-and-Build
Overall Trend
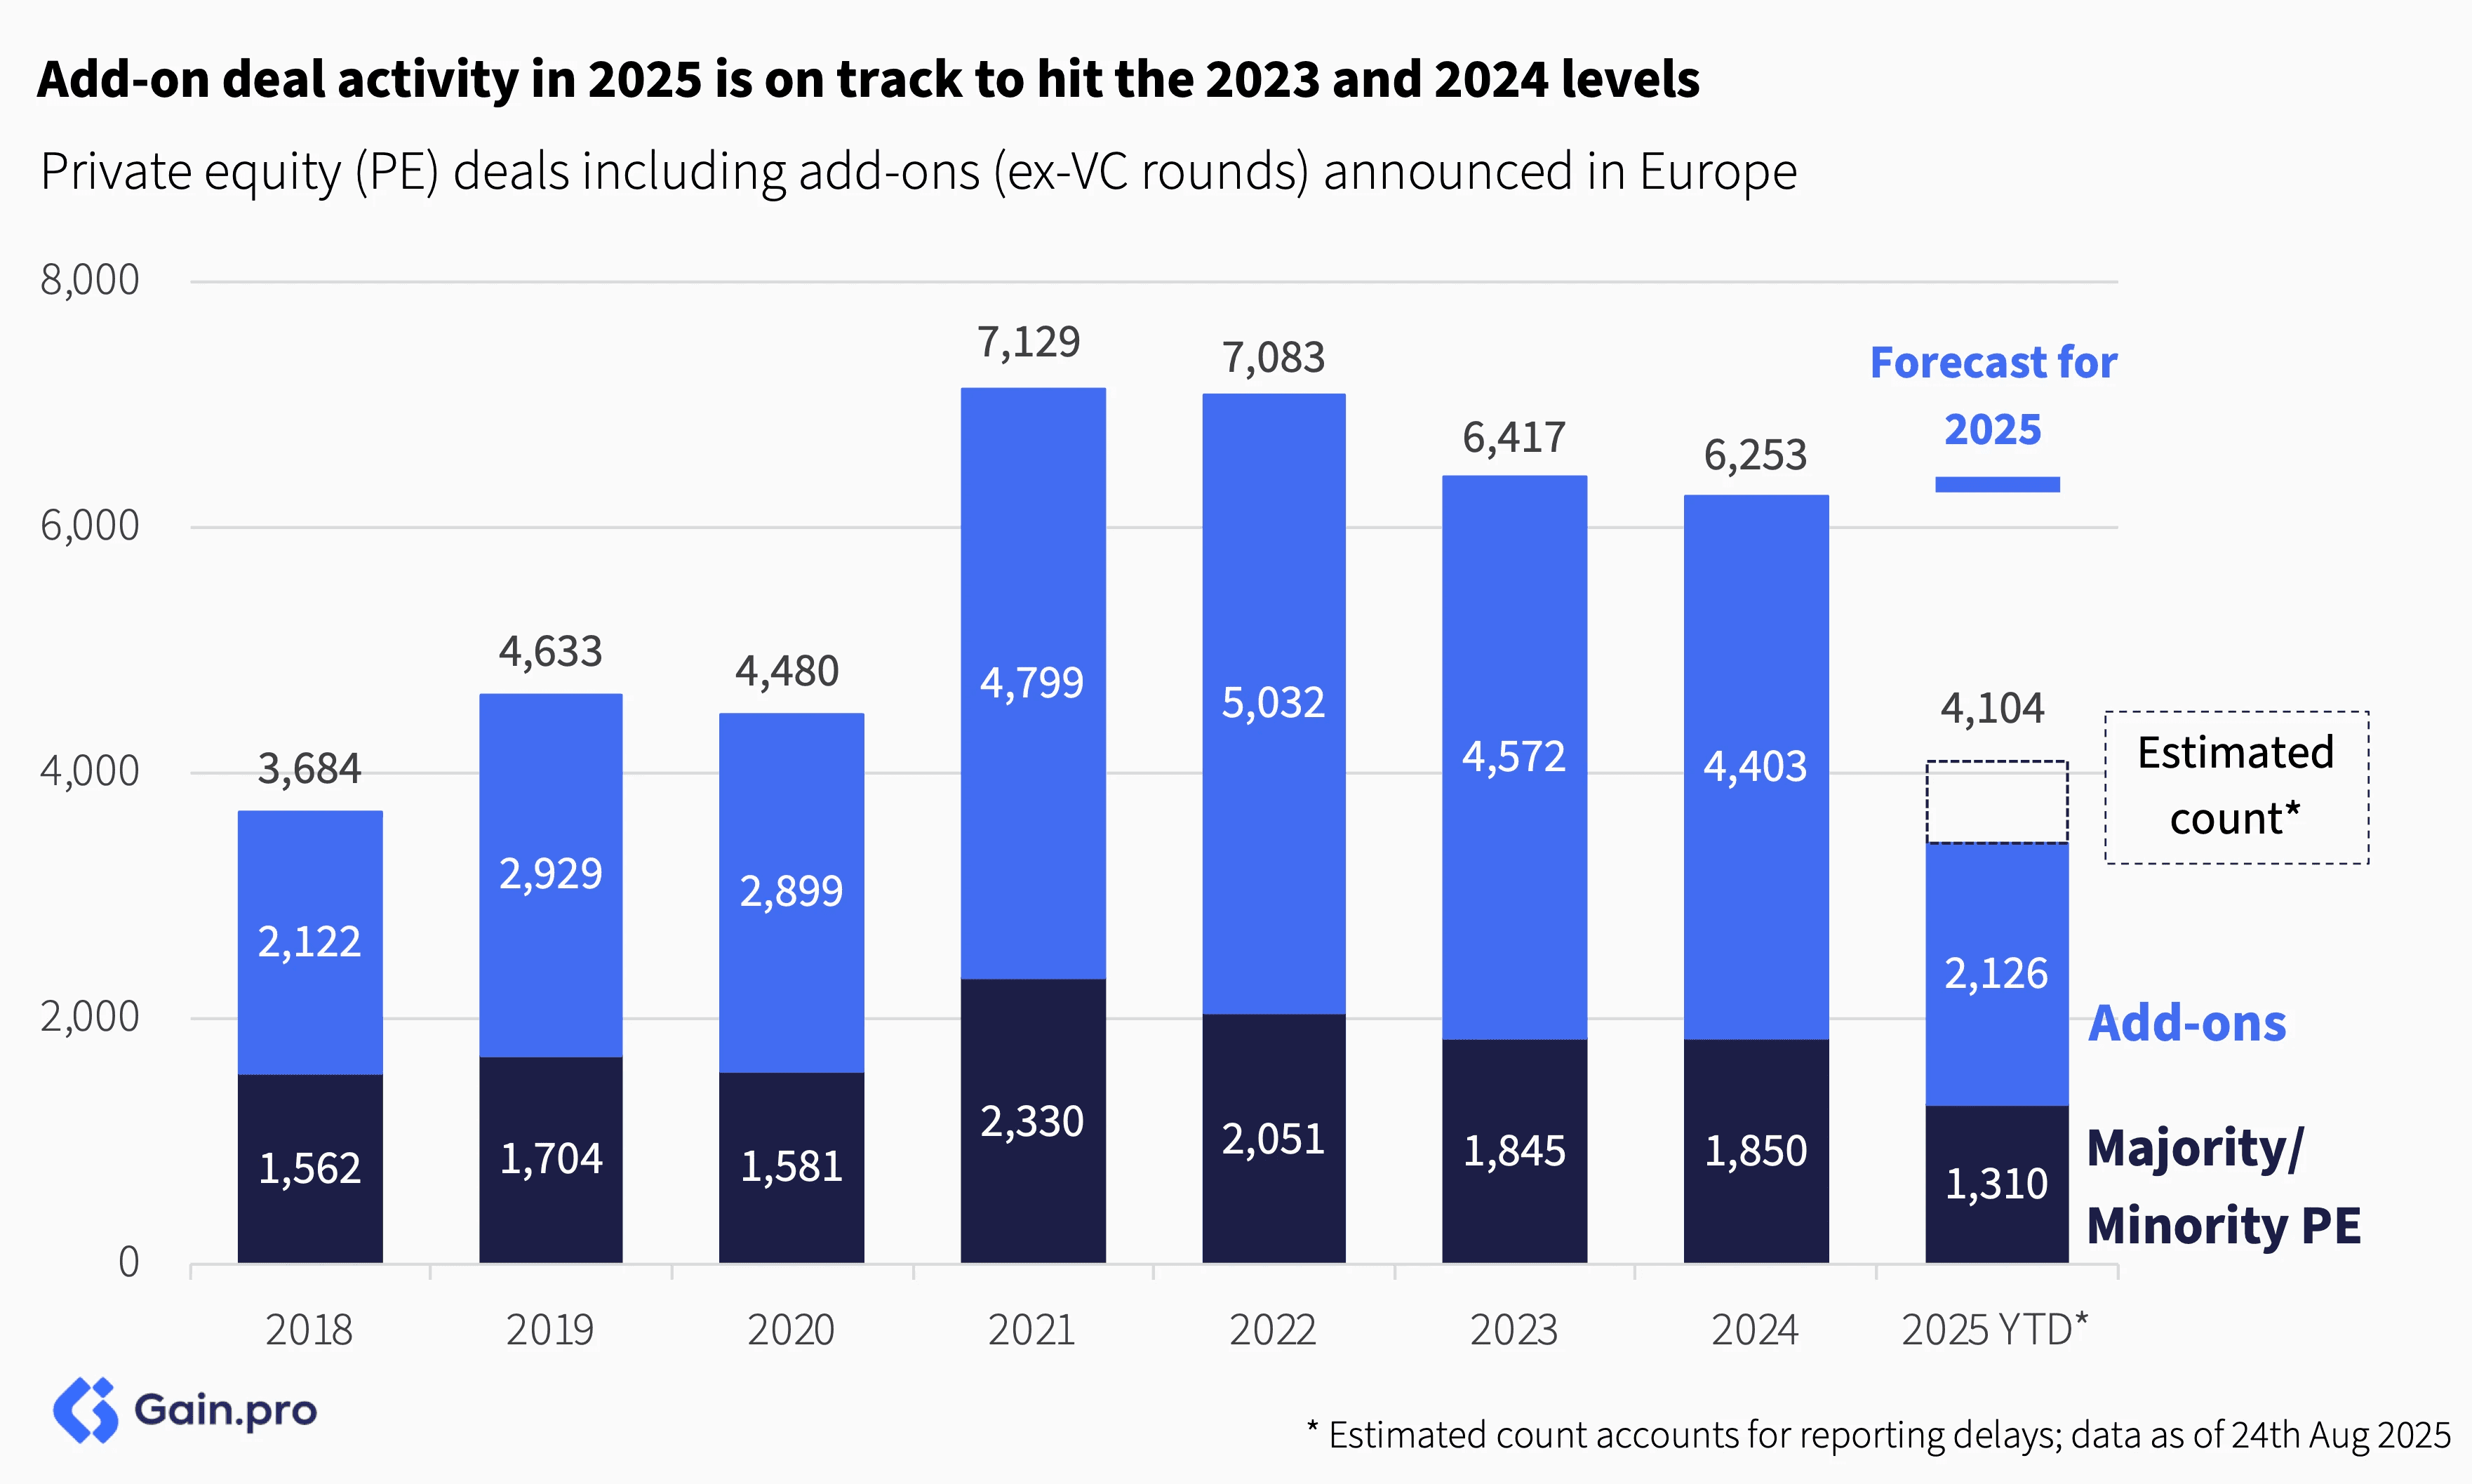
Add-on deal activity in 2025 is flat vs. 2023 and 2024. Amid a muted exit environment, sponsors have remained focused on portfolio value creation, with buy-and-build being the key strategy.
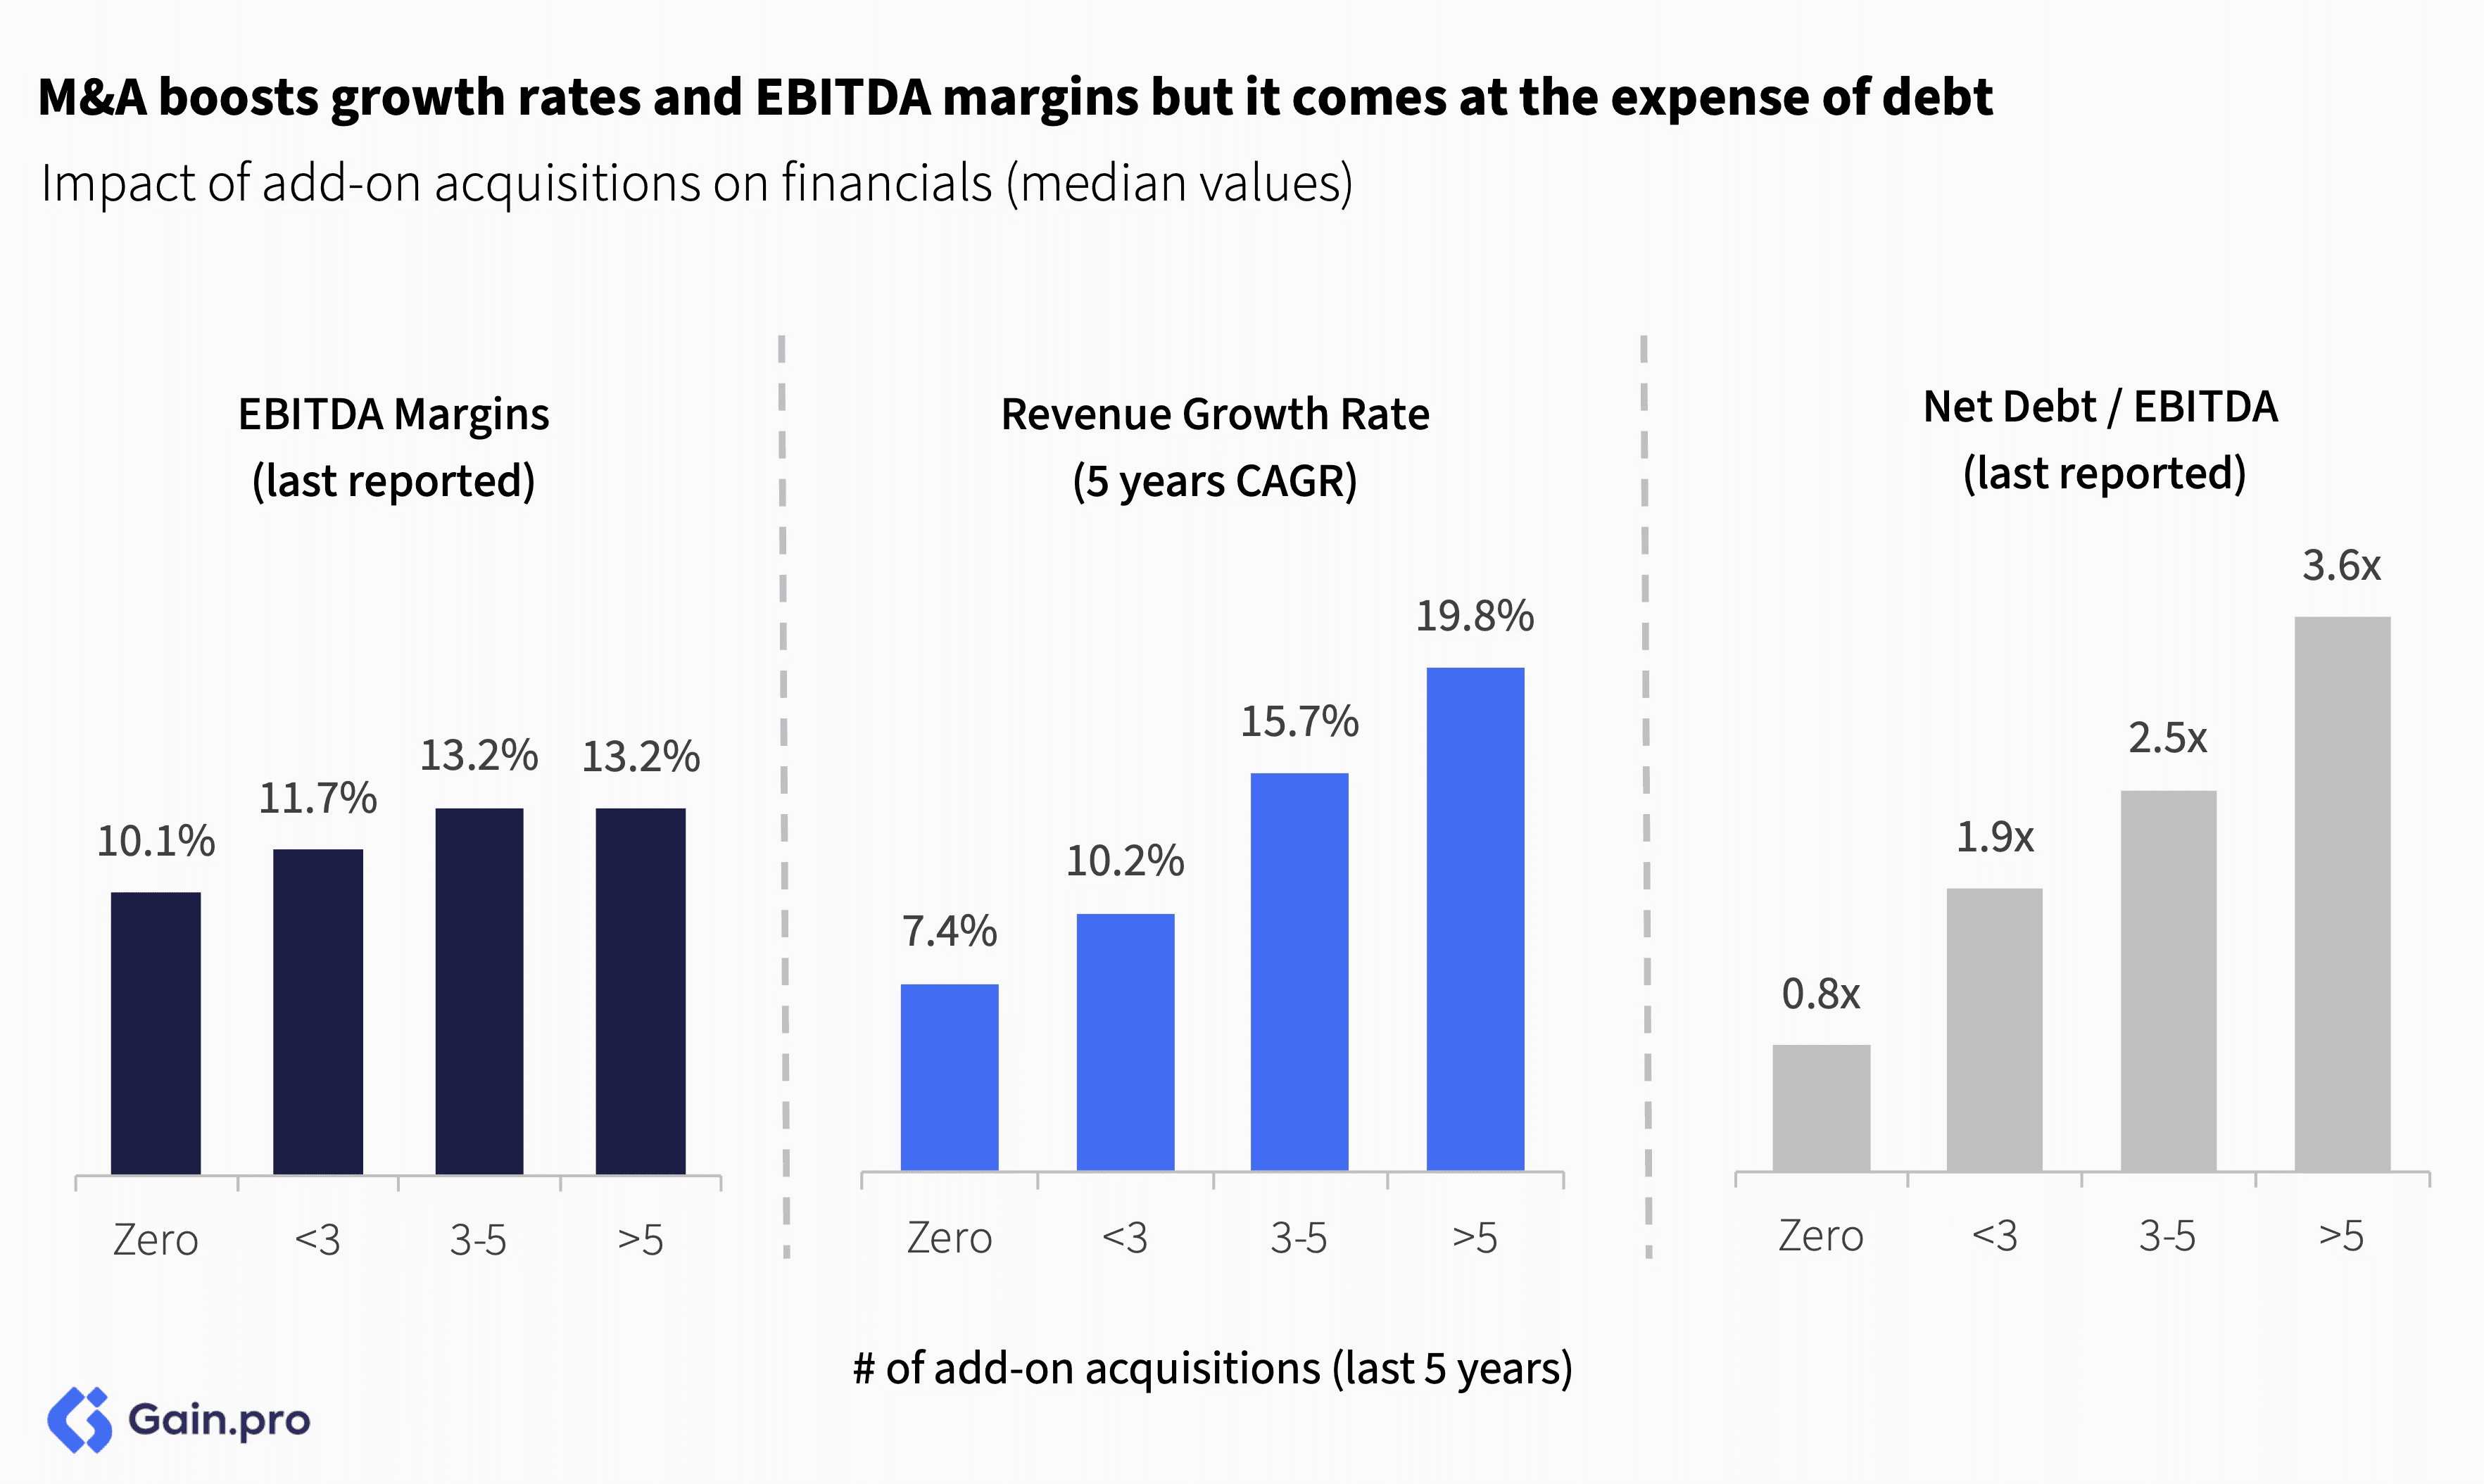
Add-ons can drive a lot of value by accelerating revenue growth and cost synergies. PE-backed businesses with over 5 acquisitions grew at a 5-year CAGR of 19.8% compared to 7.4% for businesses with no acquisitions. These businesses also benefit from improved margins. However, we do see an increase in debt to finance those acquisitions, which increases the overall risk profile of the investment.
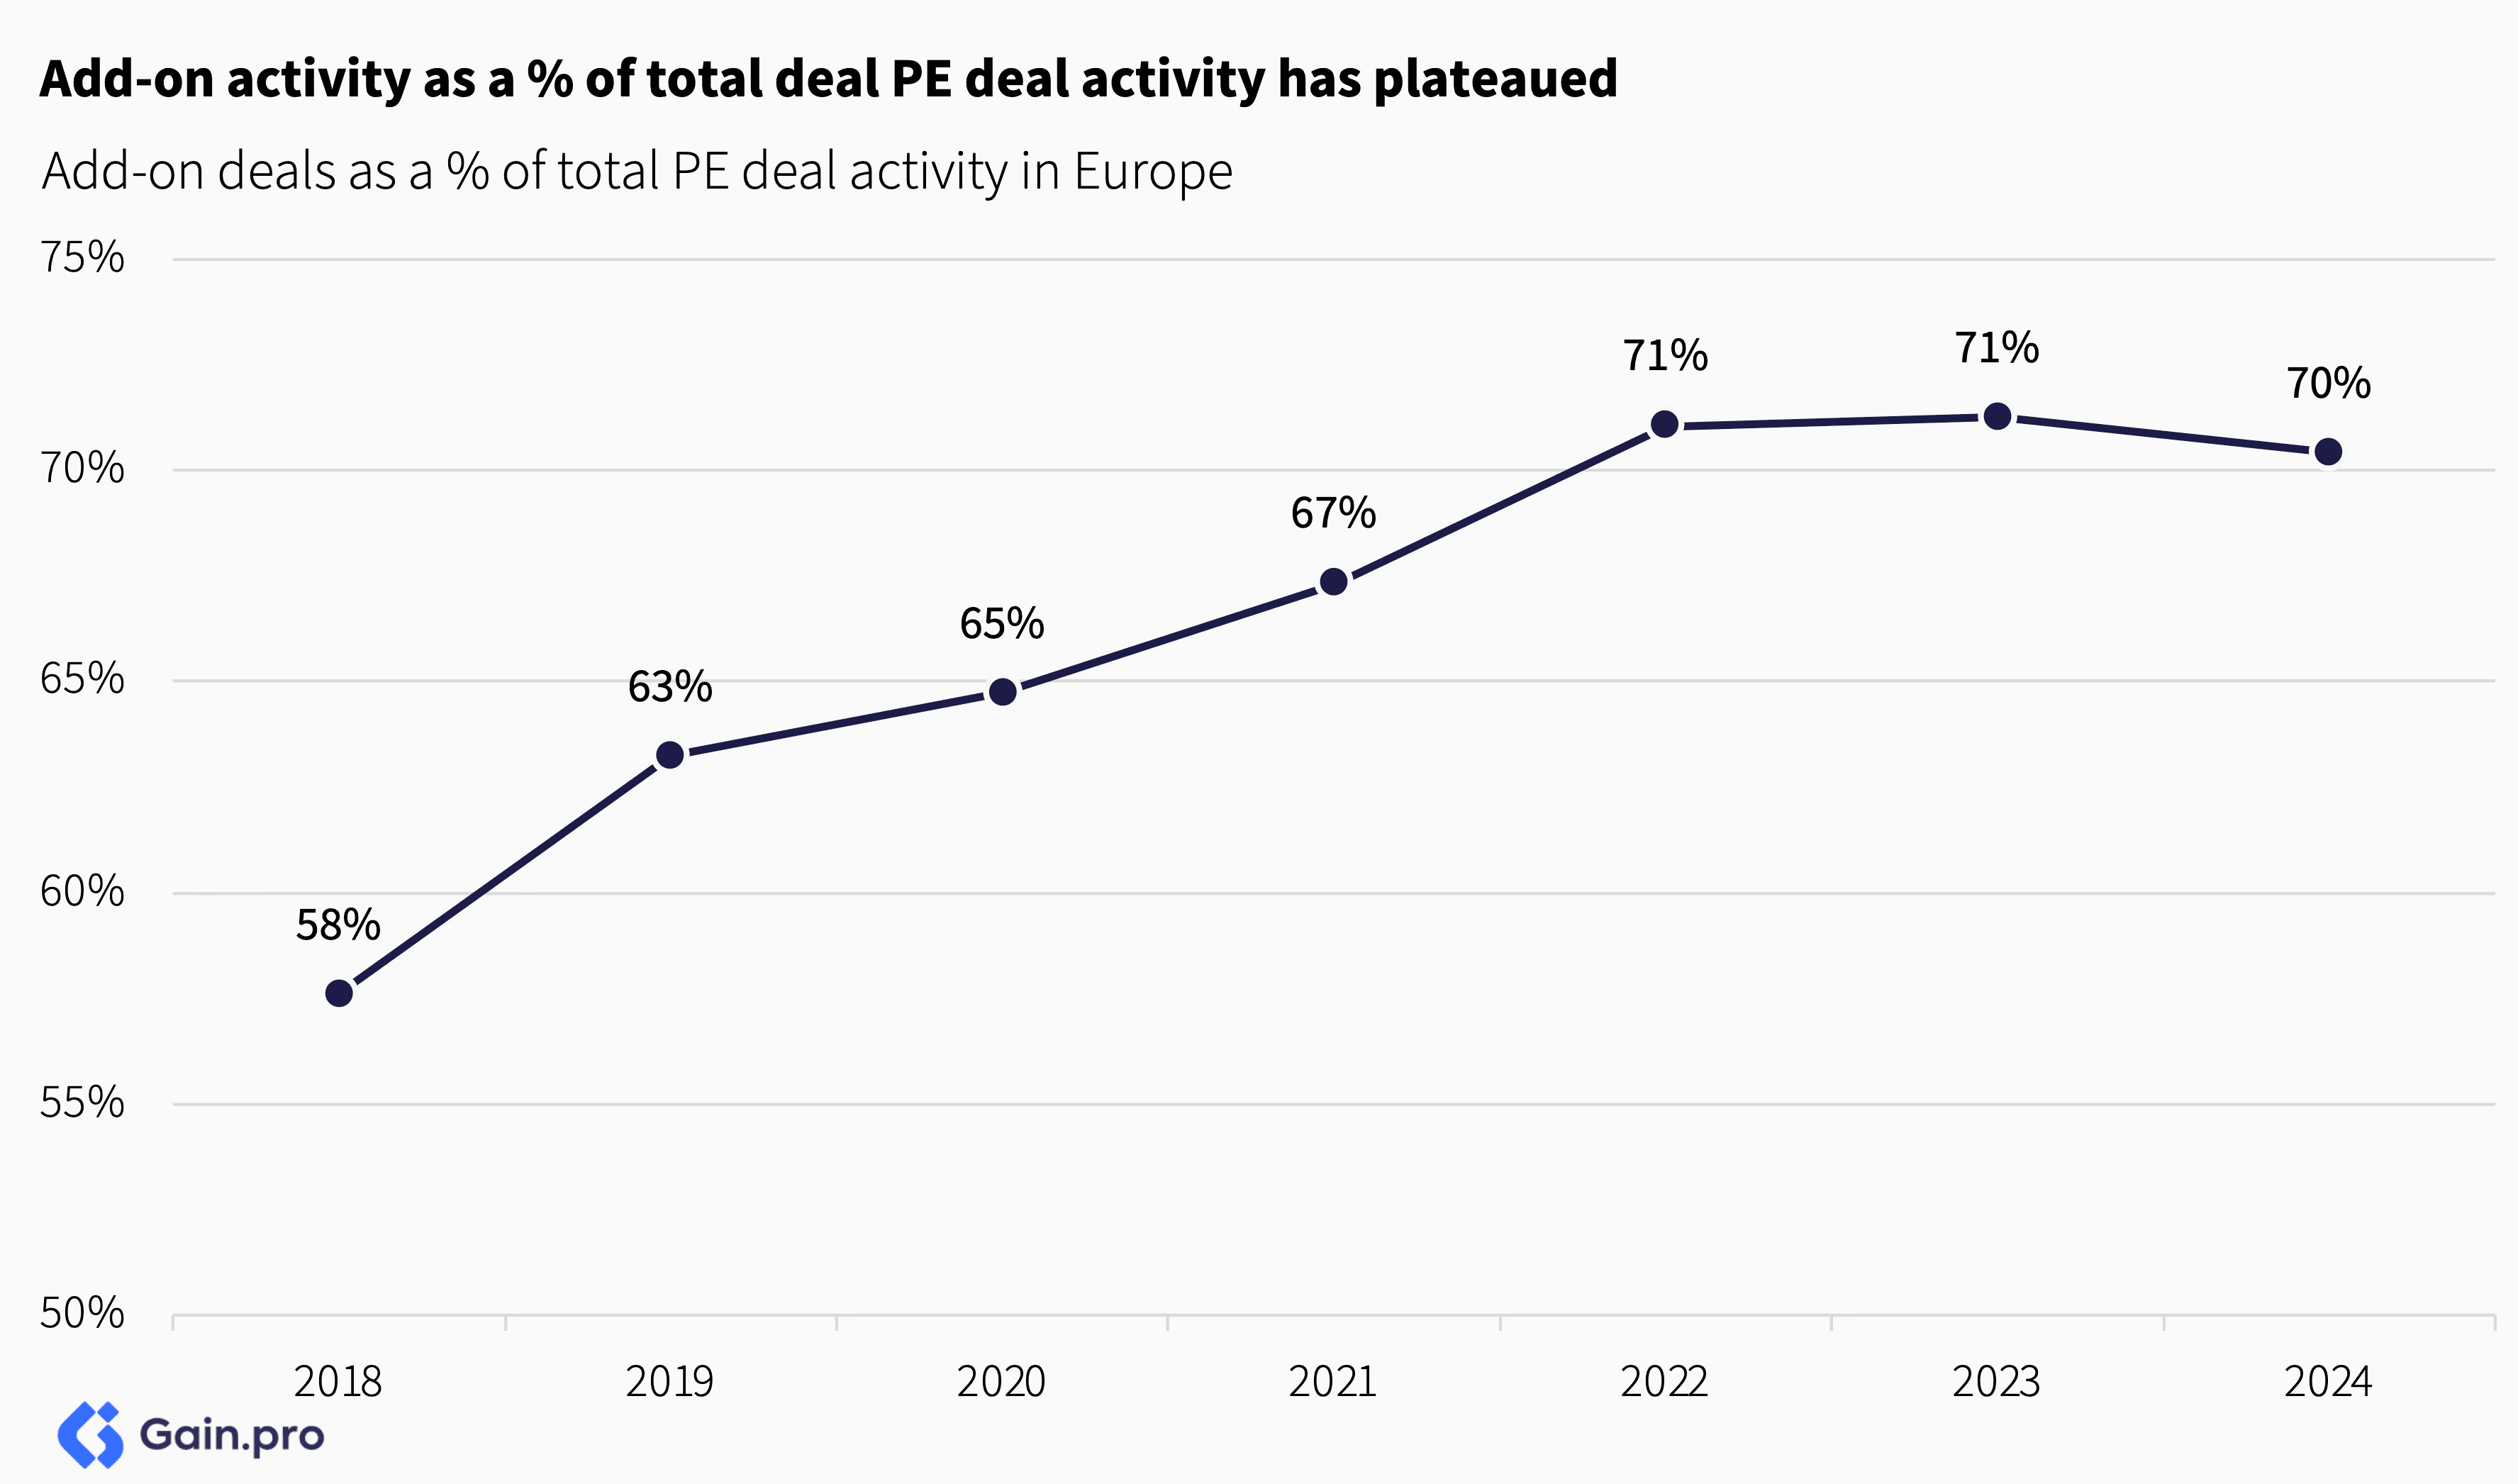
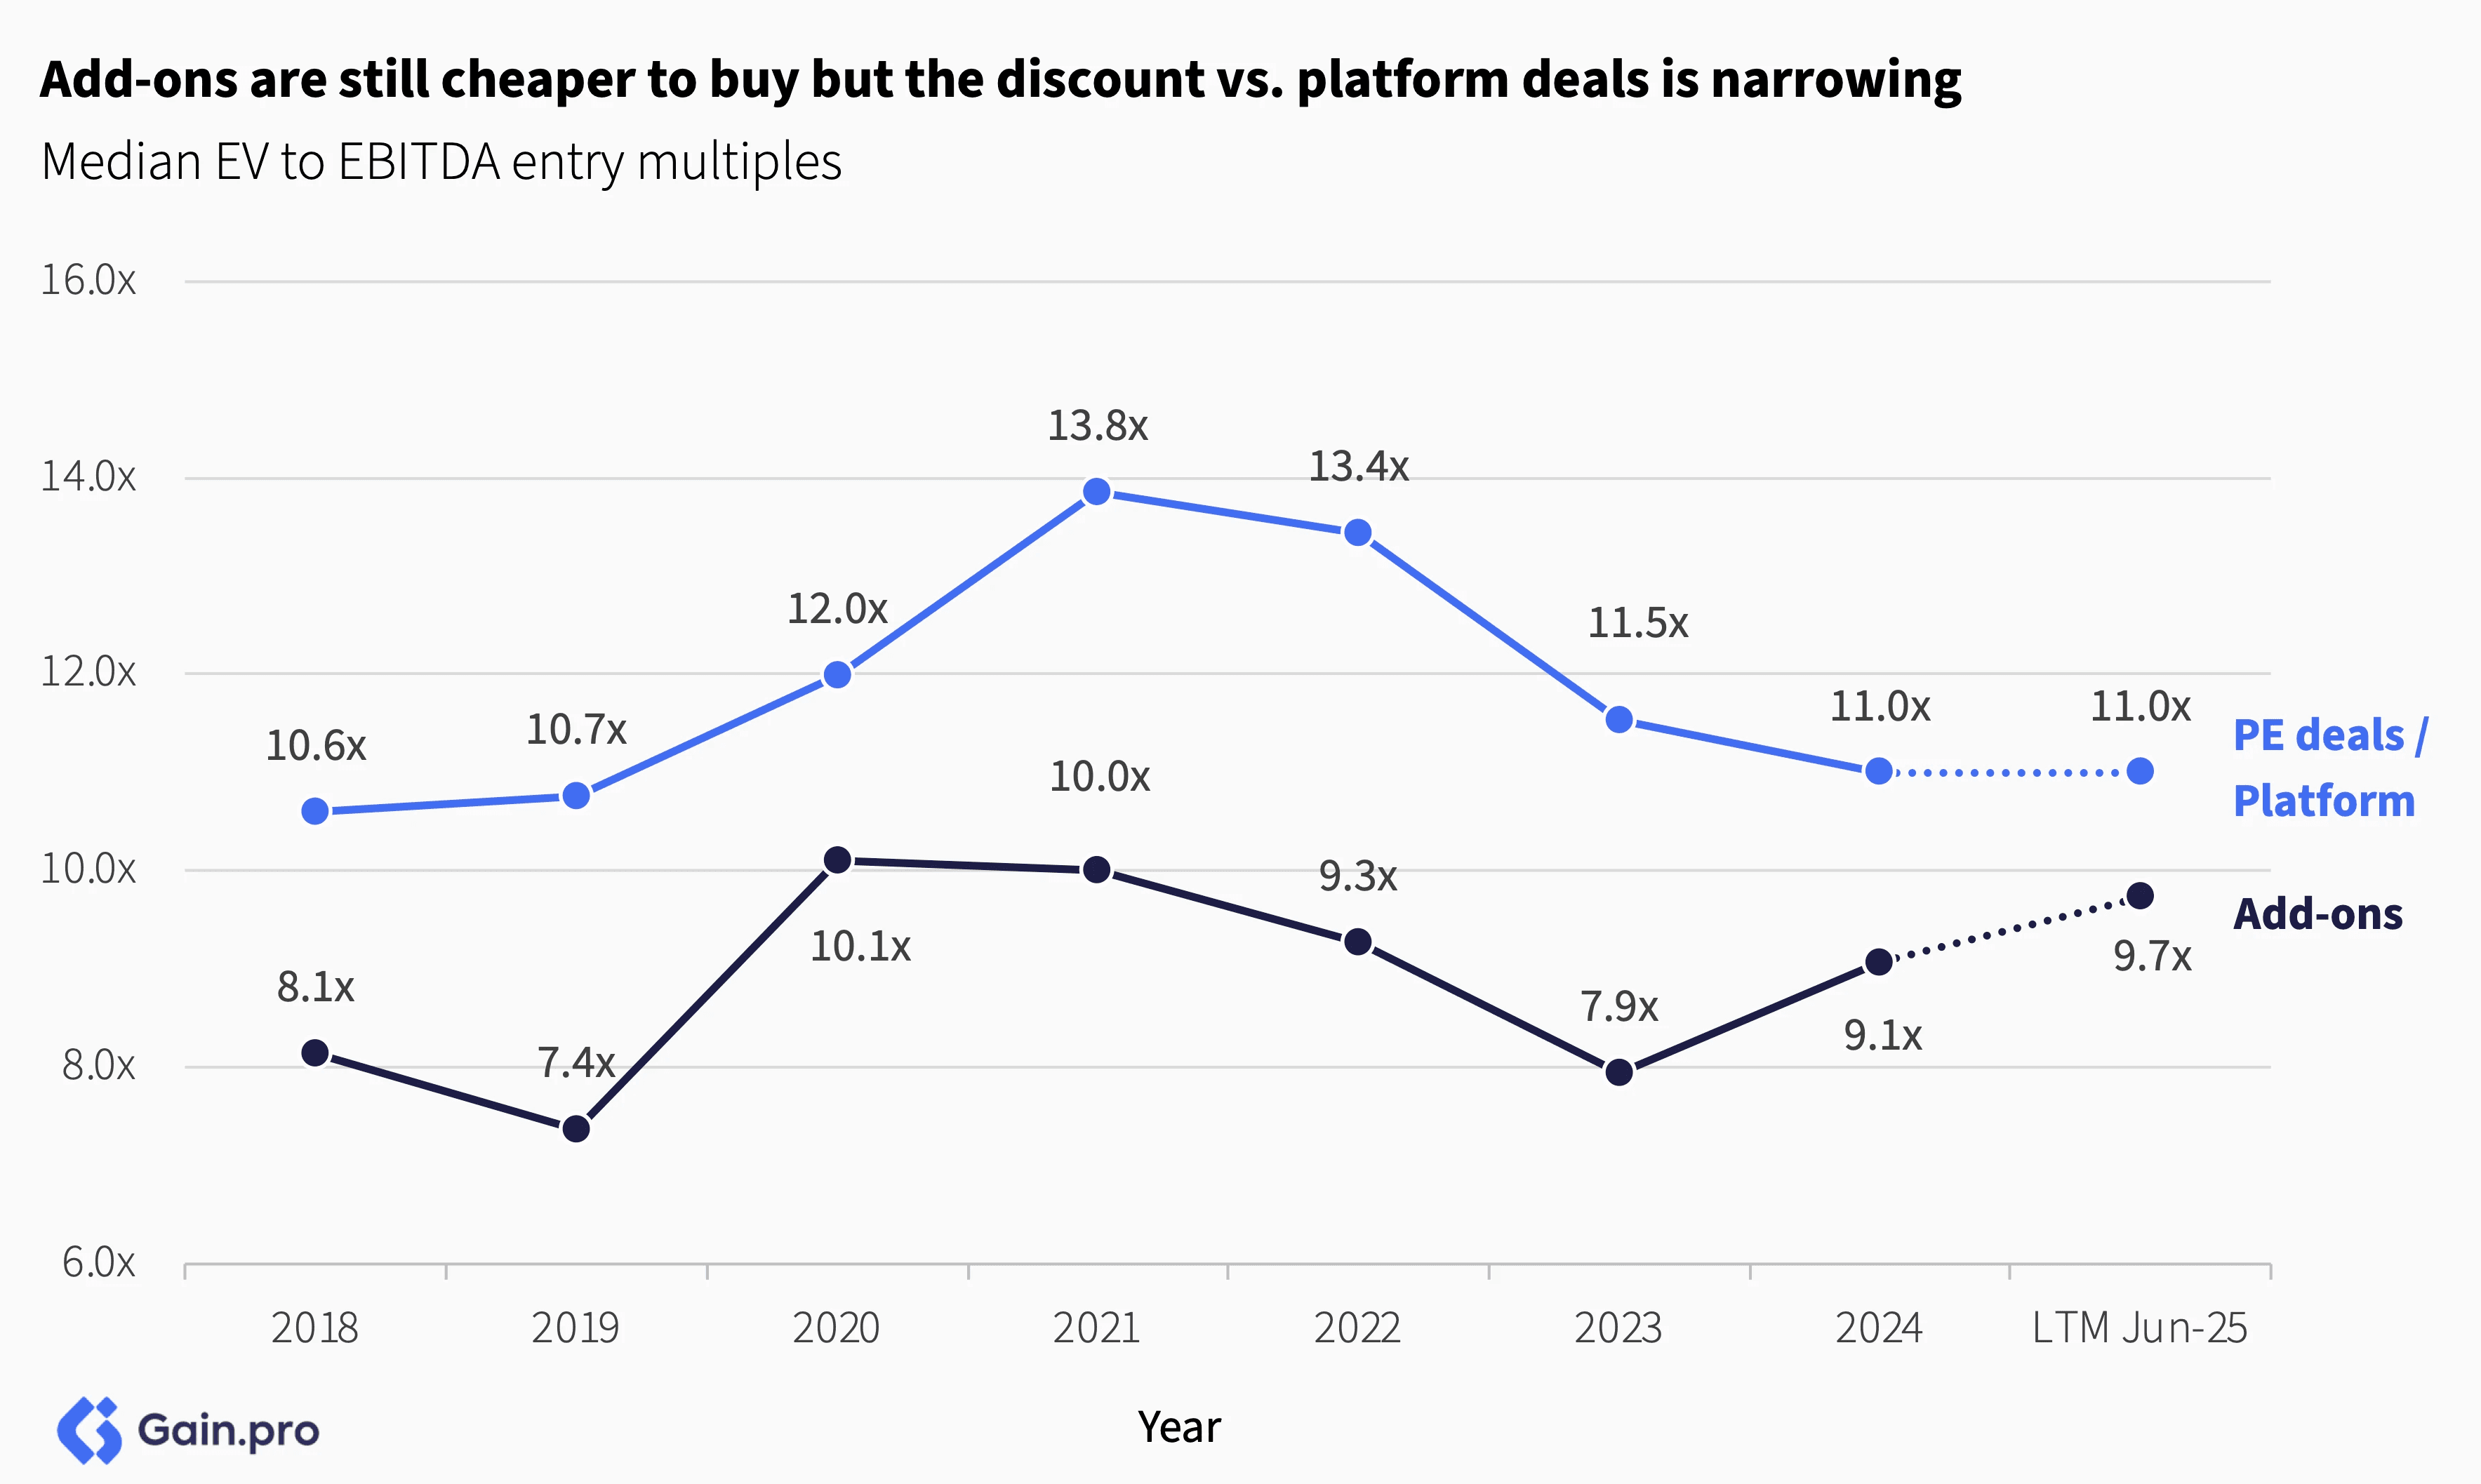
Despite the merits, add-on activity as a % of total PE deal activity has plateaued in the last few years. The recent narrowing gap between add-ons and platform multiples, integration challenges and higher financing costs have tempered further growth.
Because of their smaller size, add-on targets are often cheaper to buy (~10% cheaper) compared to platform deals. However, recent data suggests that the discount has narrowed.
Sector and Regional Insights
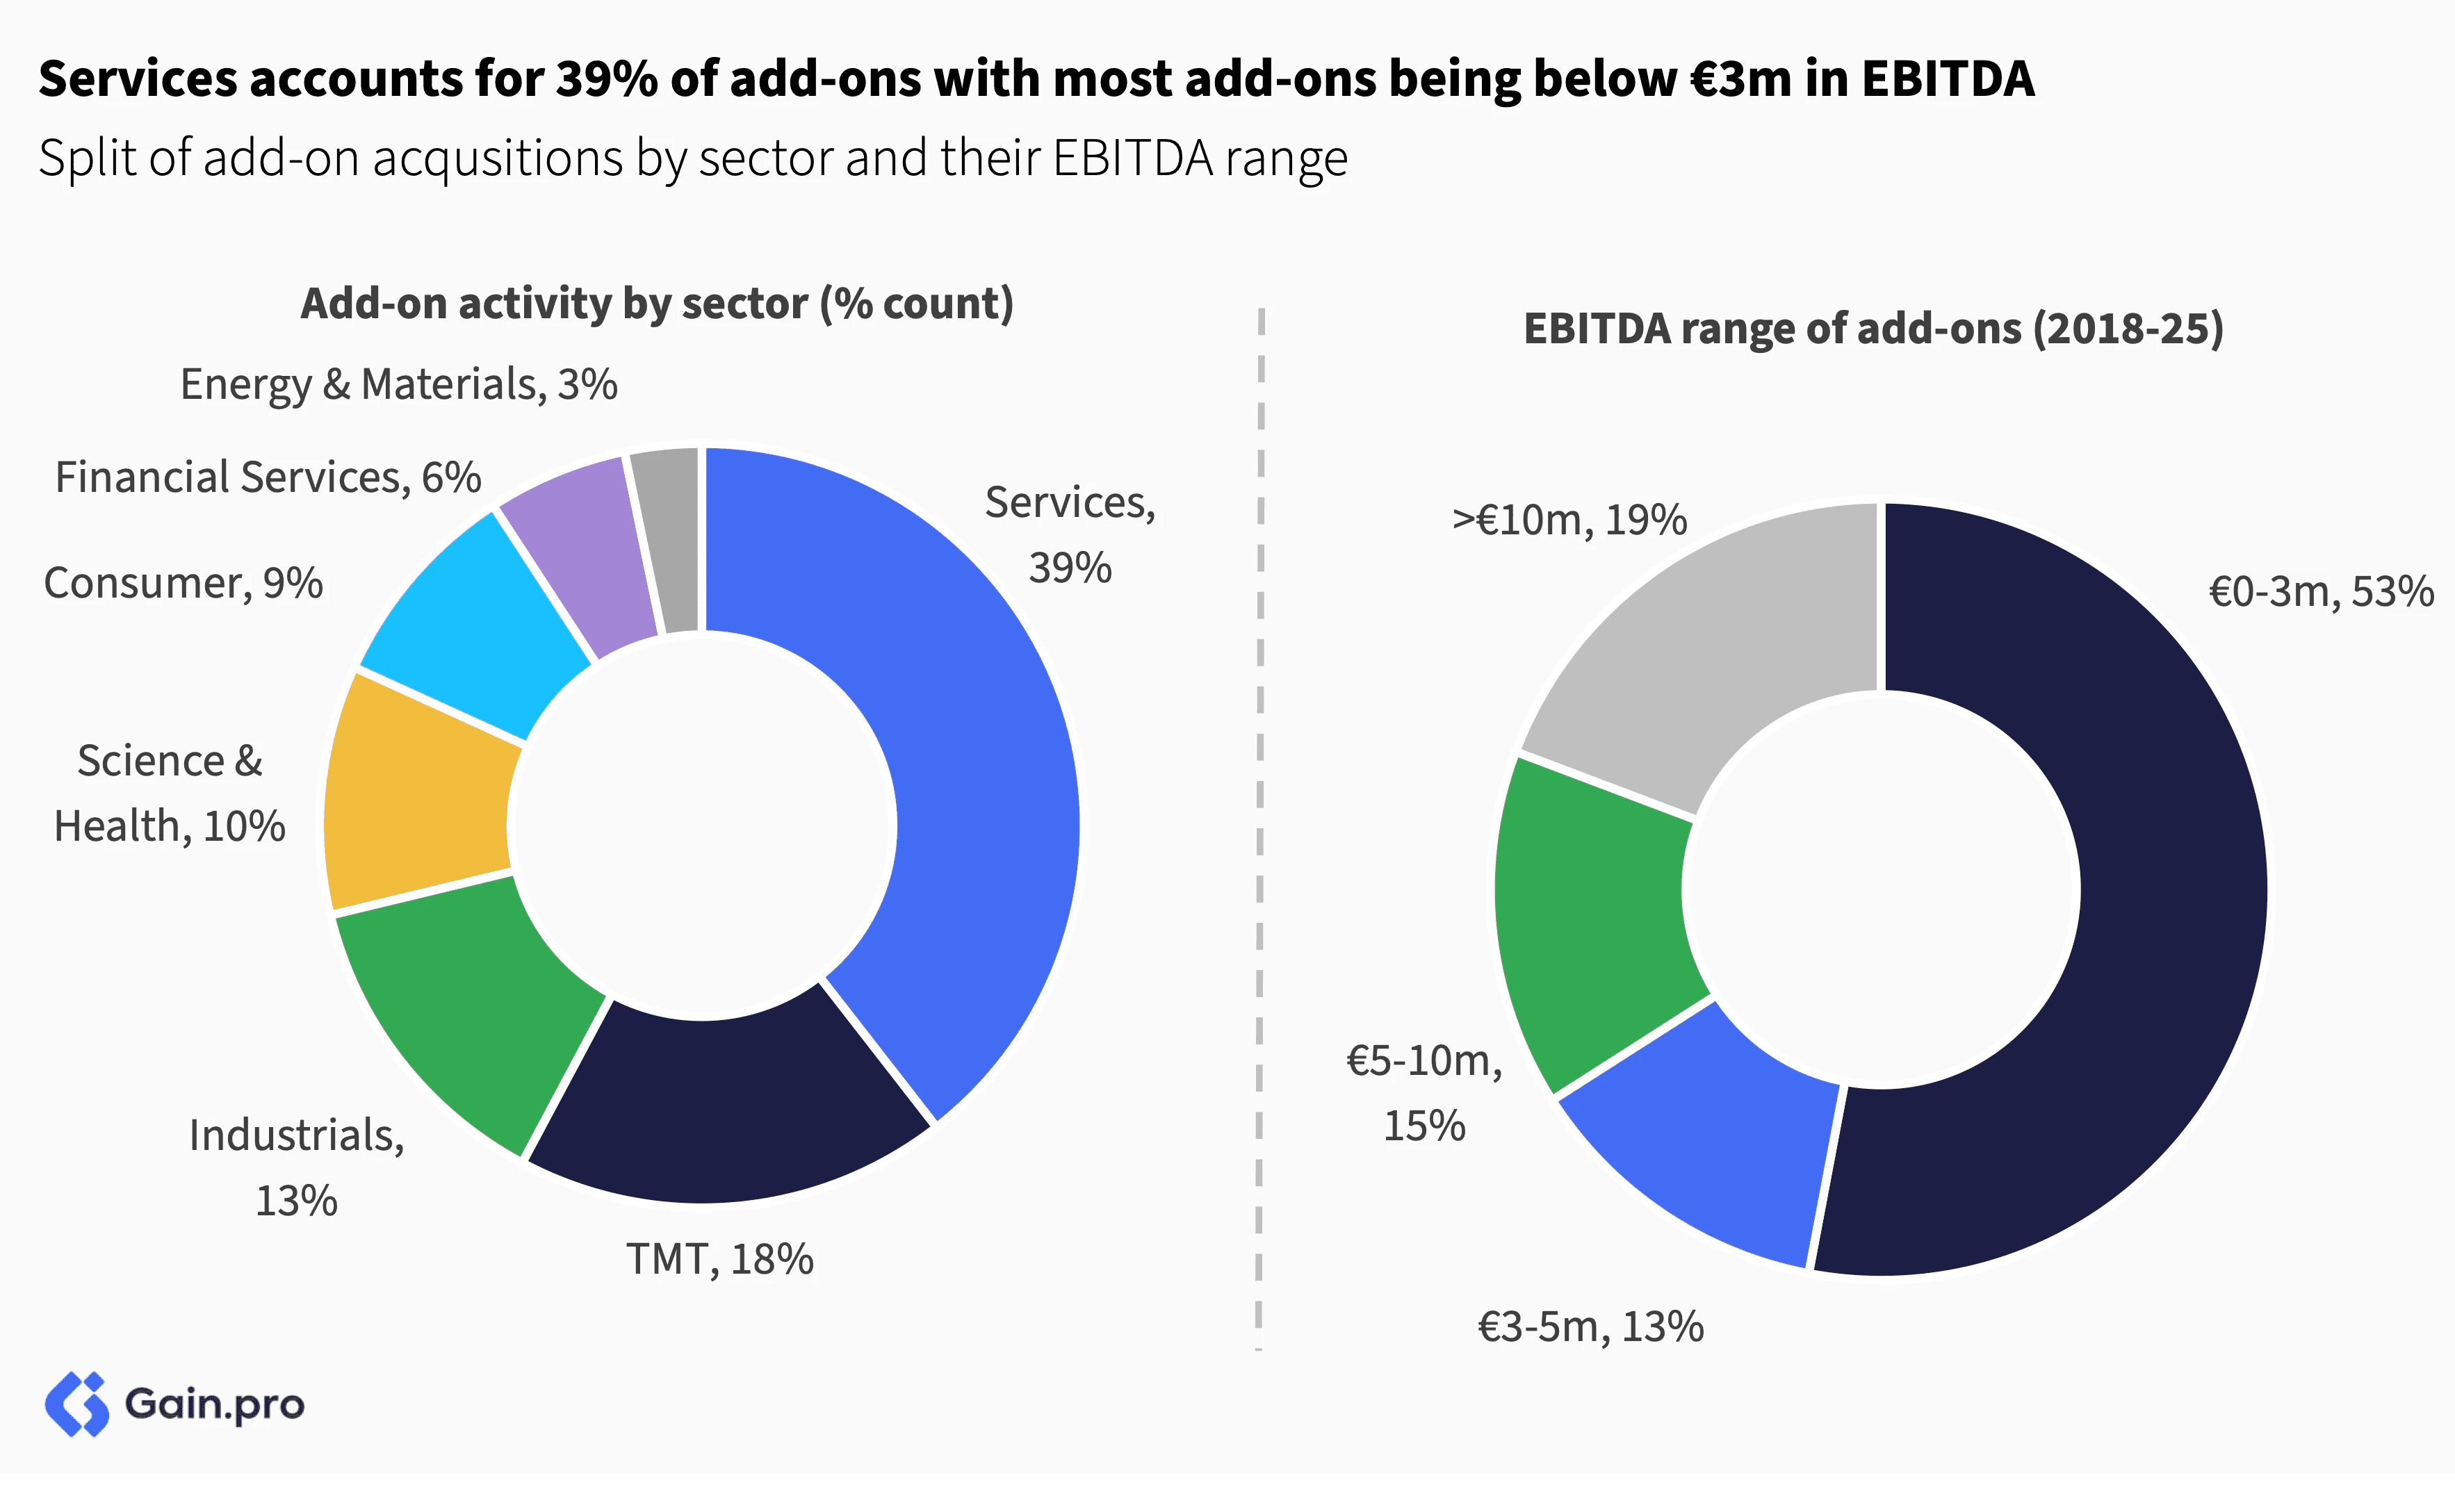
Services is the largest sector for add-ons (39% of deals), followed by TMT (18%) and Industrials (13%). Within Services, Technical and Professional Services subsectors are the most active. Most add-ons are small, with over half below €3m EBITDA transaction size.
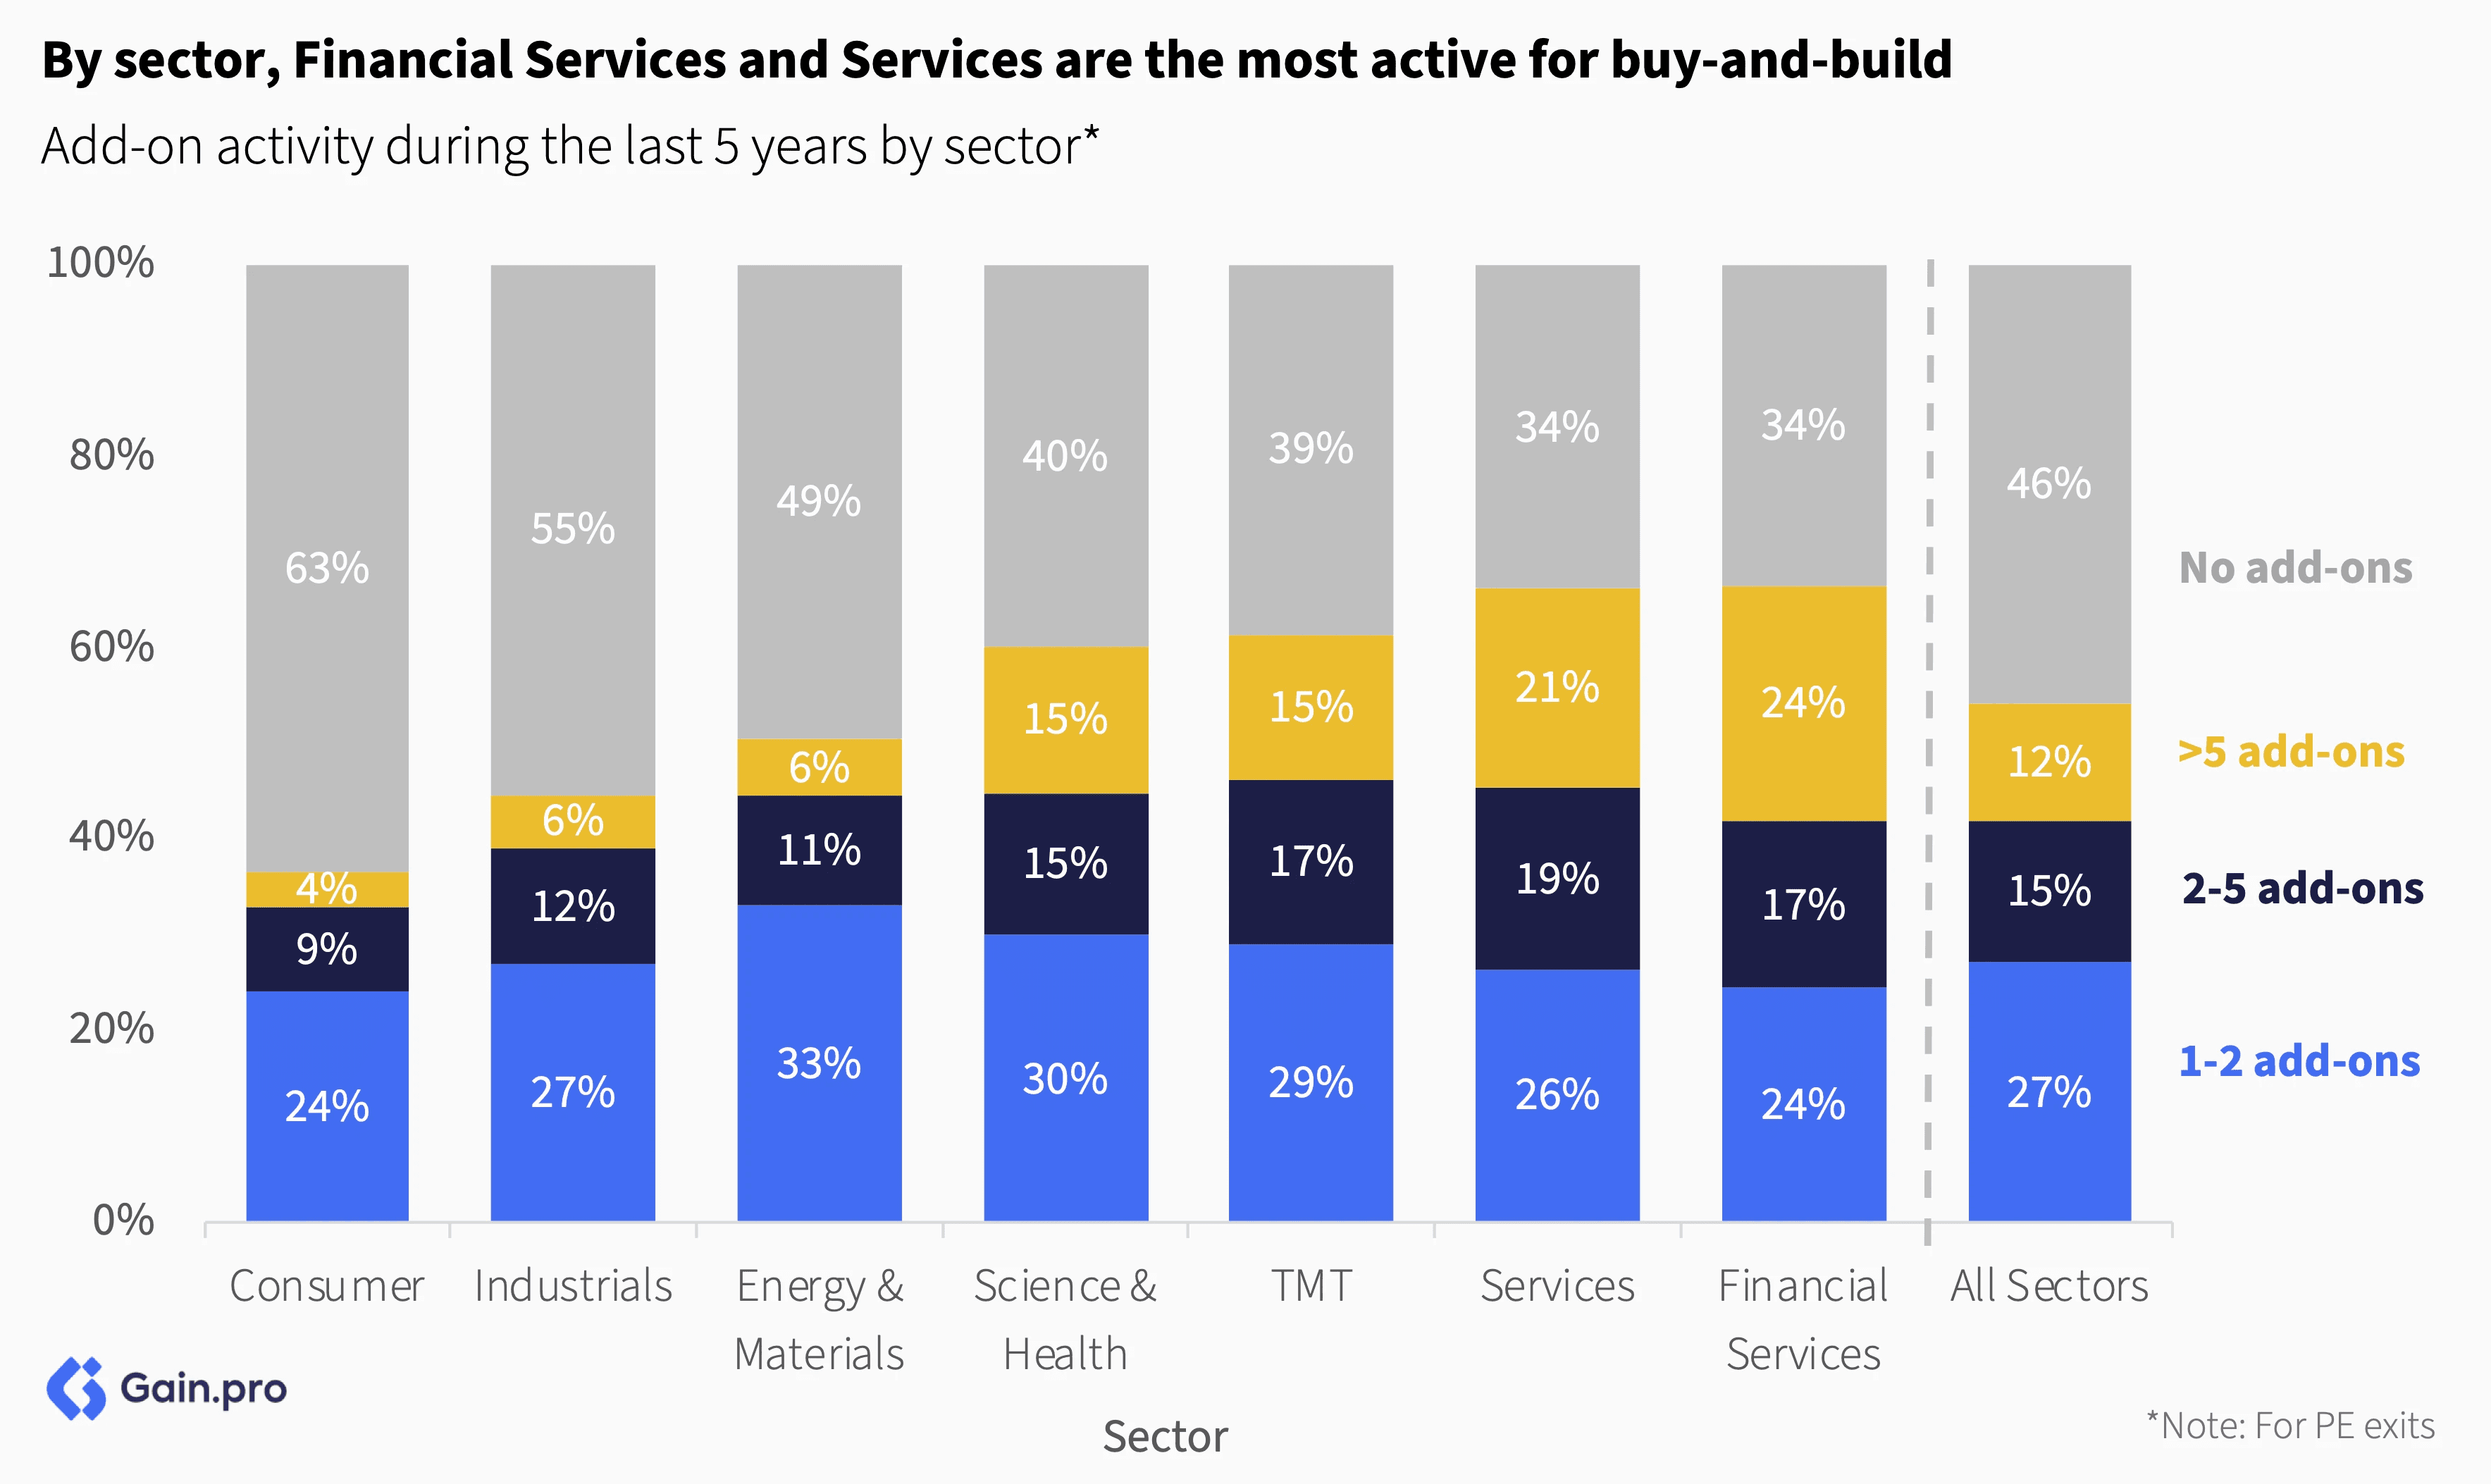
On a per asset basis, Financial Services and Services are the most active sectors for buy-and-build. We see market fragmentation along with complexities in capturing organic growth as the key reasons for increased add-on activity in these sectors. In Financial Services, many asset managers and insurers pursue M&A to shore up their AUM and market share. Within Services, we still see a multiple arbitrage story driving value.
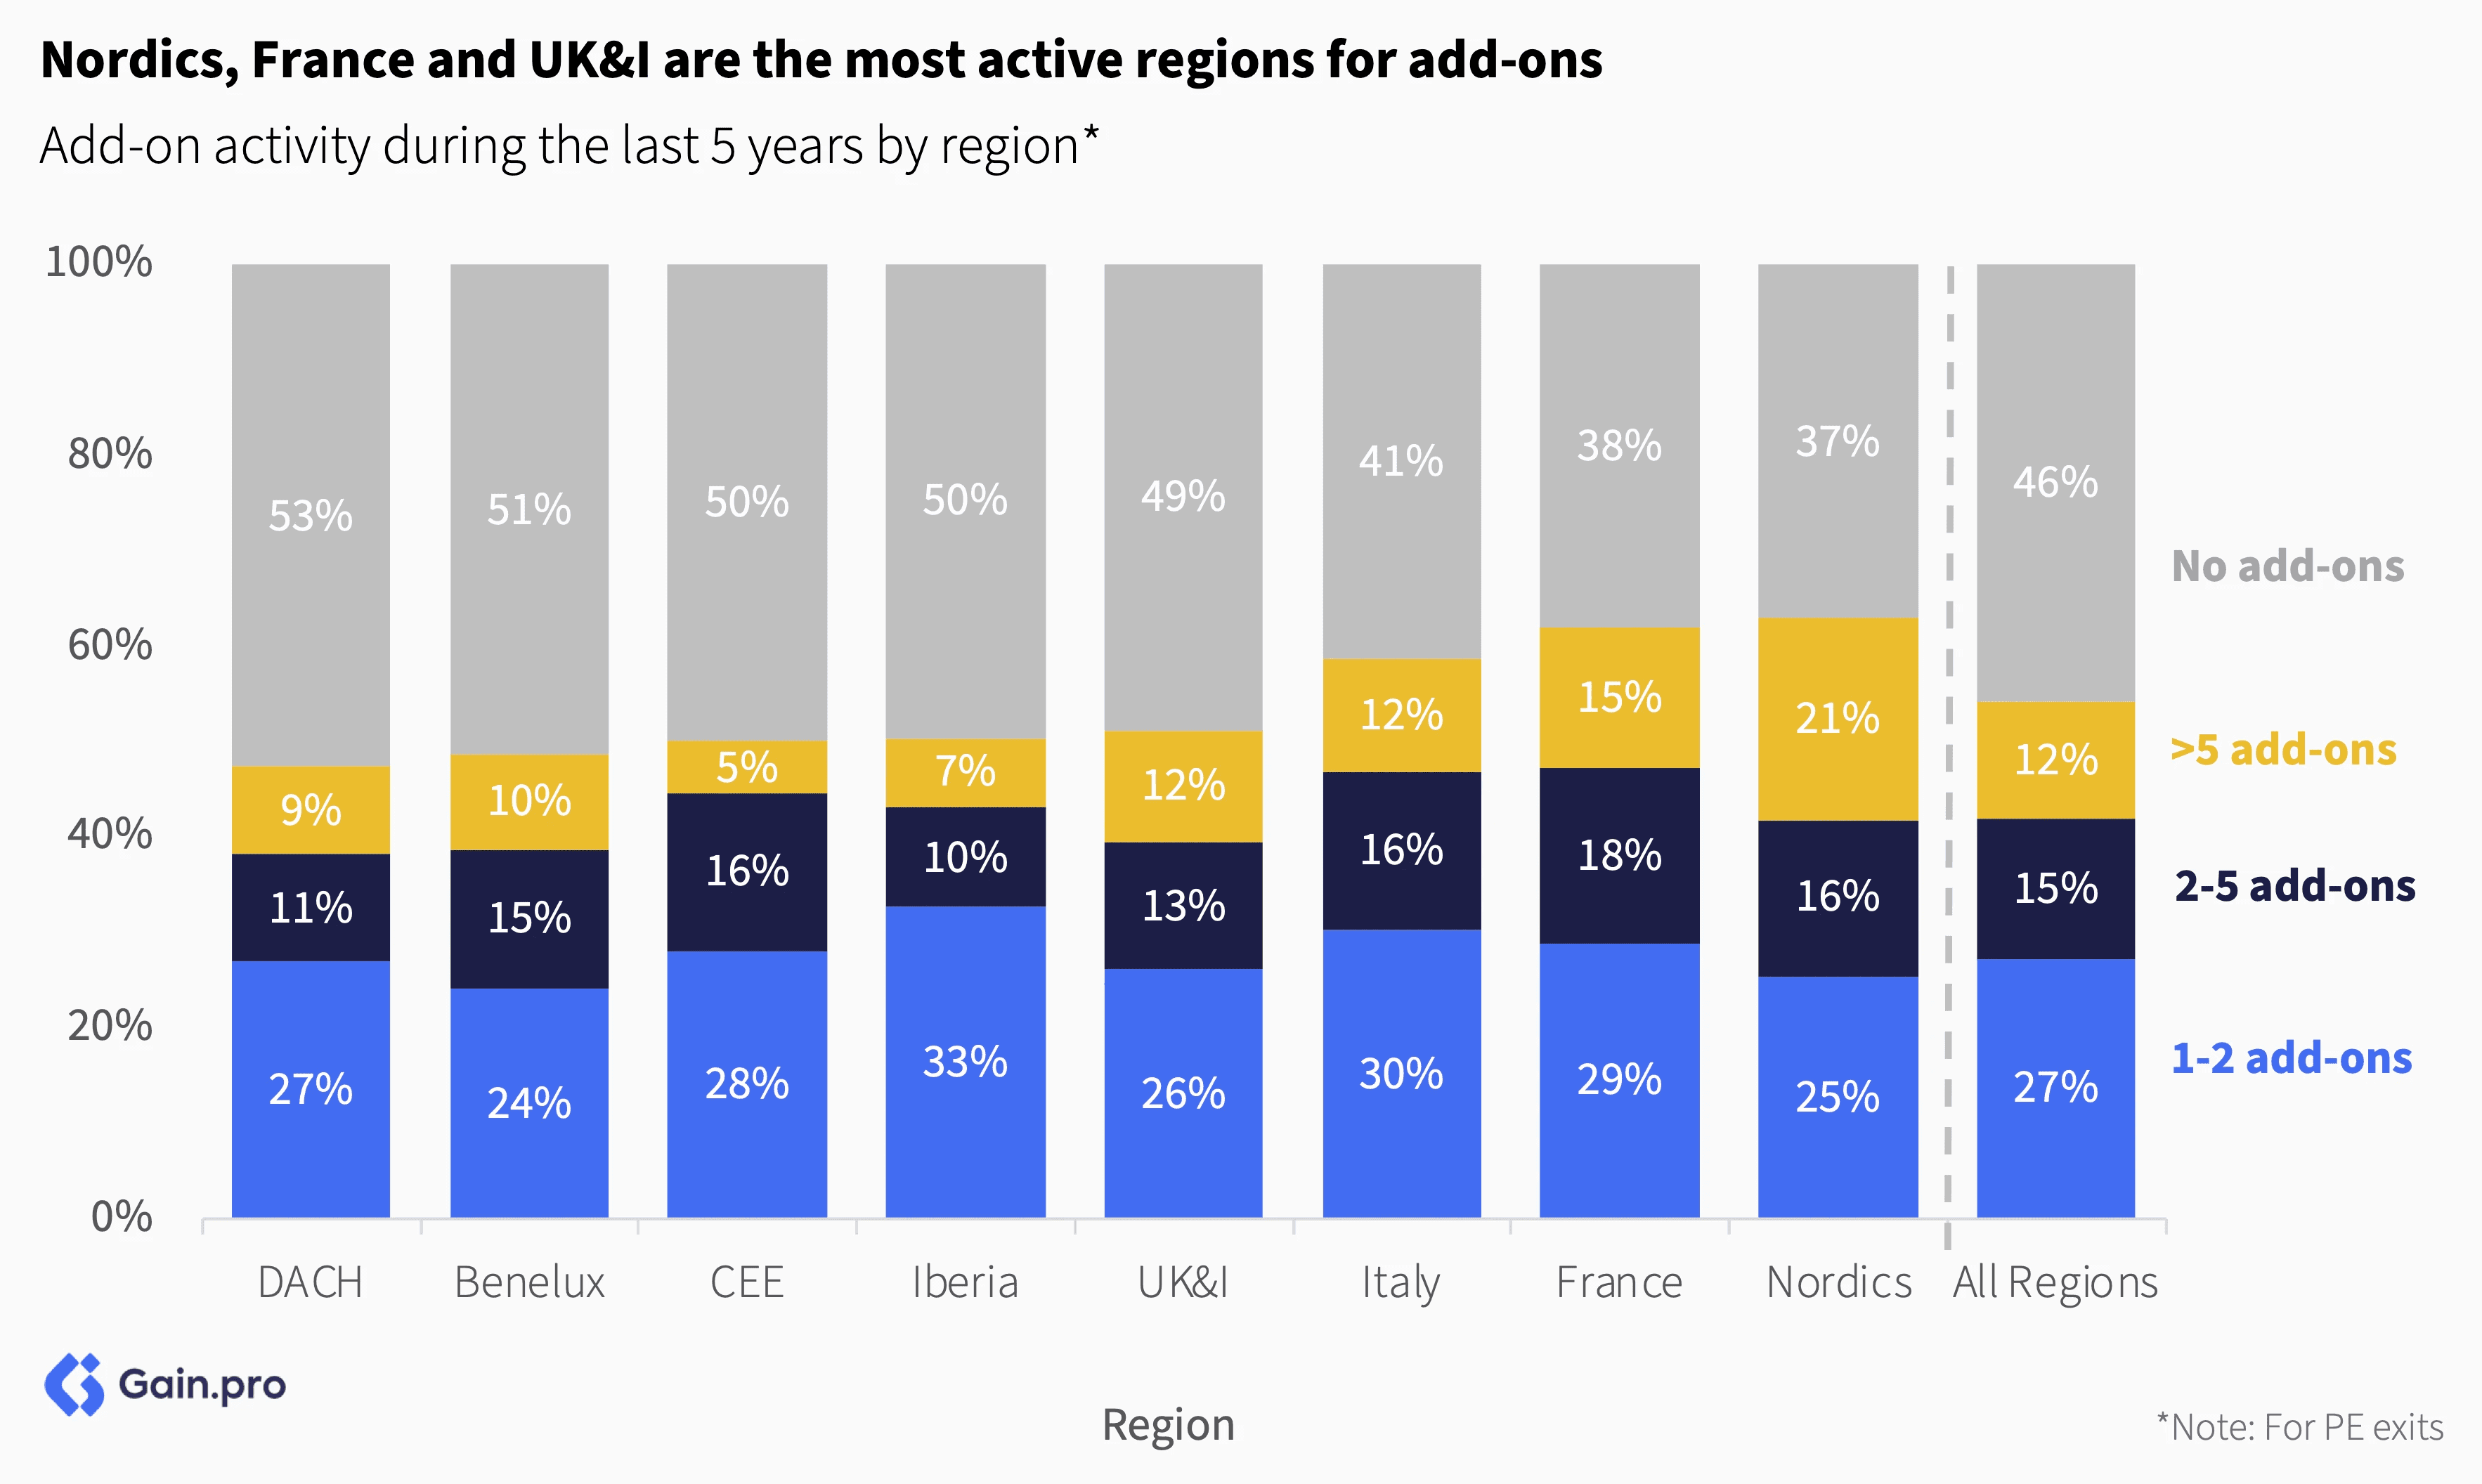
The Nordics and France are the most active regions for buy-and-build activity. Over 60% of assets in these regions pursue add-ons. The Nordics benefit from a dual advantage with both (i) high prevalence of Services & TMT sectors that naturally favor add-on strategies, and (ii) well-integrated markets across Sweden, Denmark and Norway that create favorable conditions for successful bolt-on acquisitions.
Chapter 03: Exits
Overall Trend
Exit activity in 2025 is expected to stabilize with 4% year-over-year growth. Despite pressure on exits in order to generate LP liquidity and the focus on DPI, the pace of exits relative to the portfolio backlog remains slow.
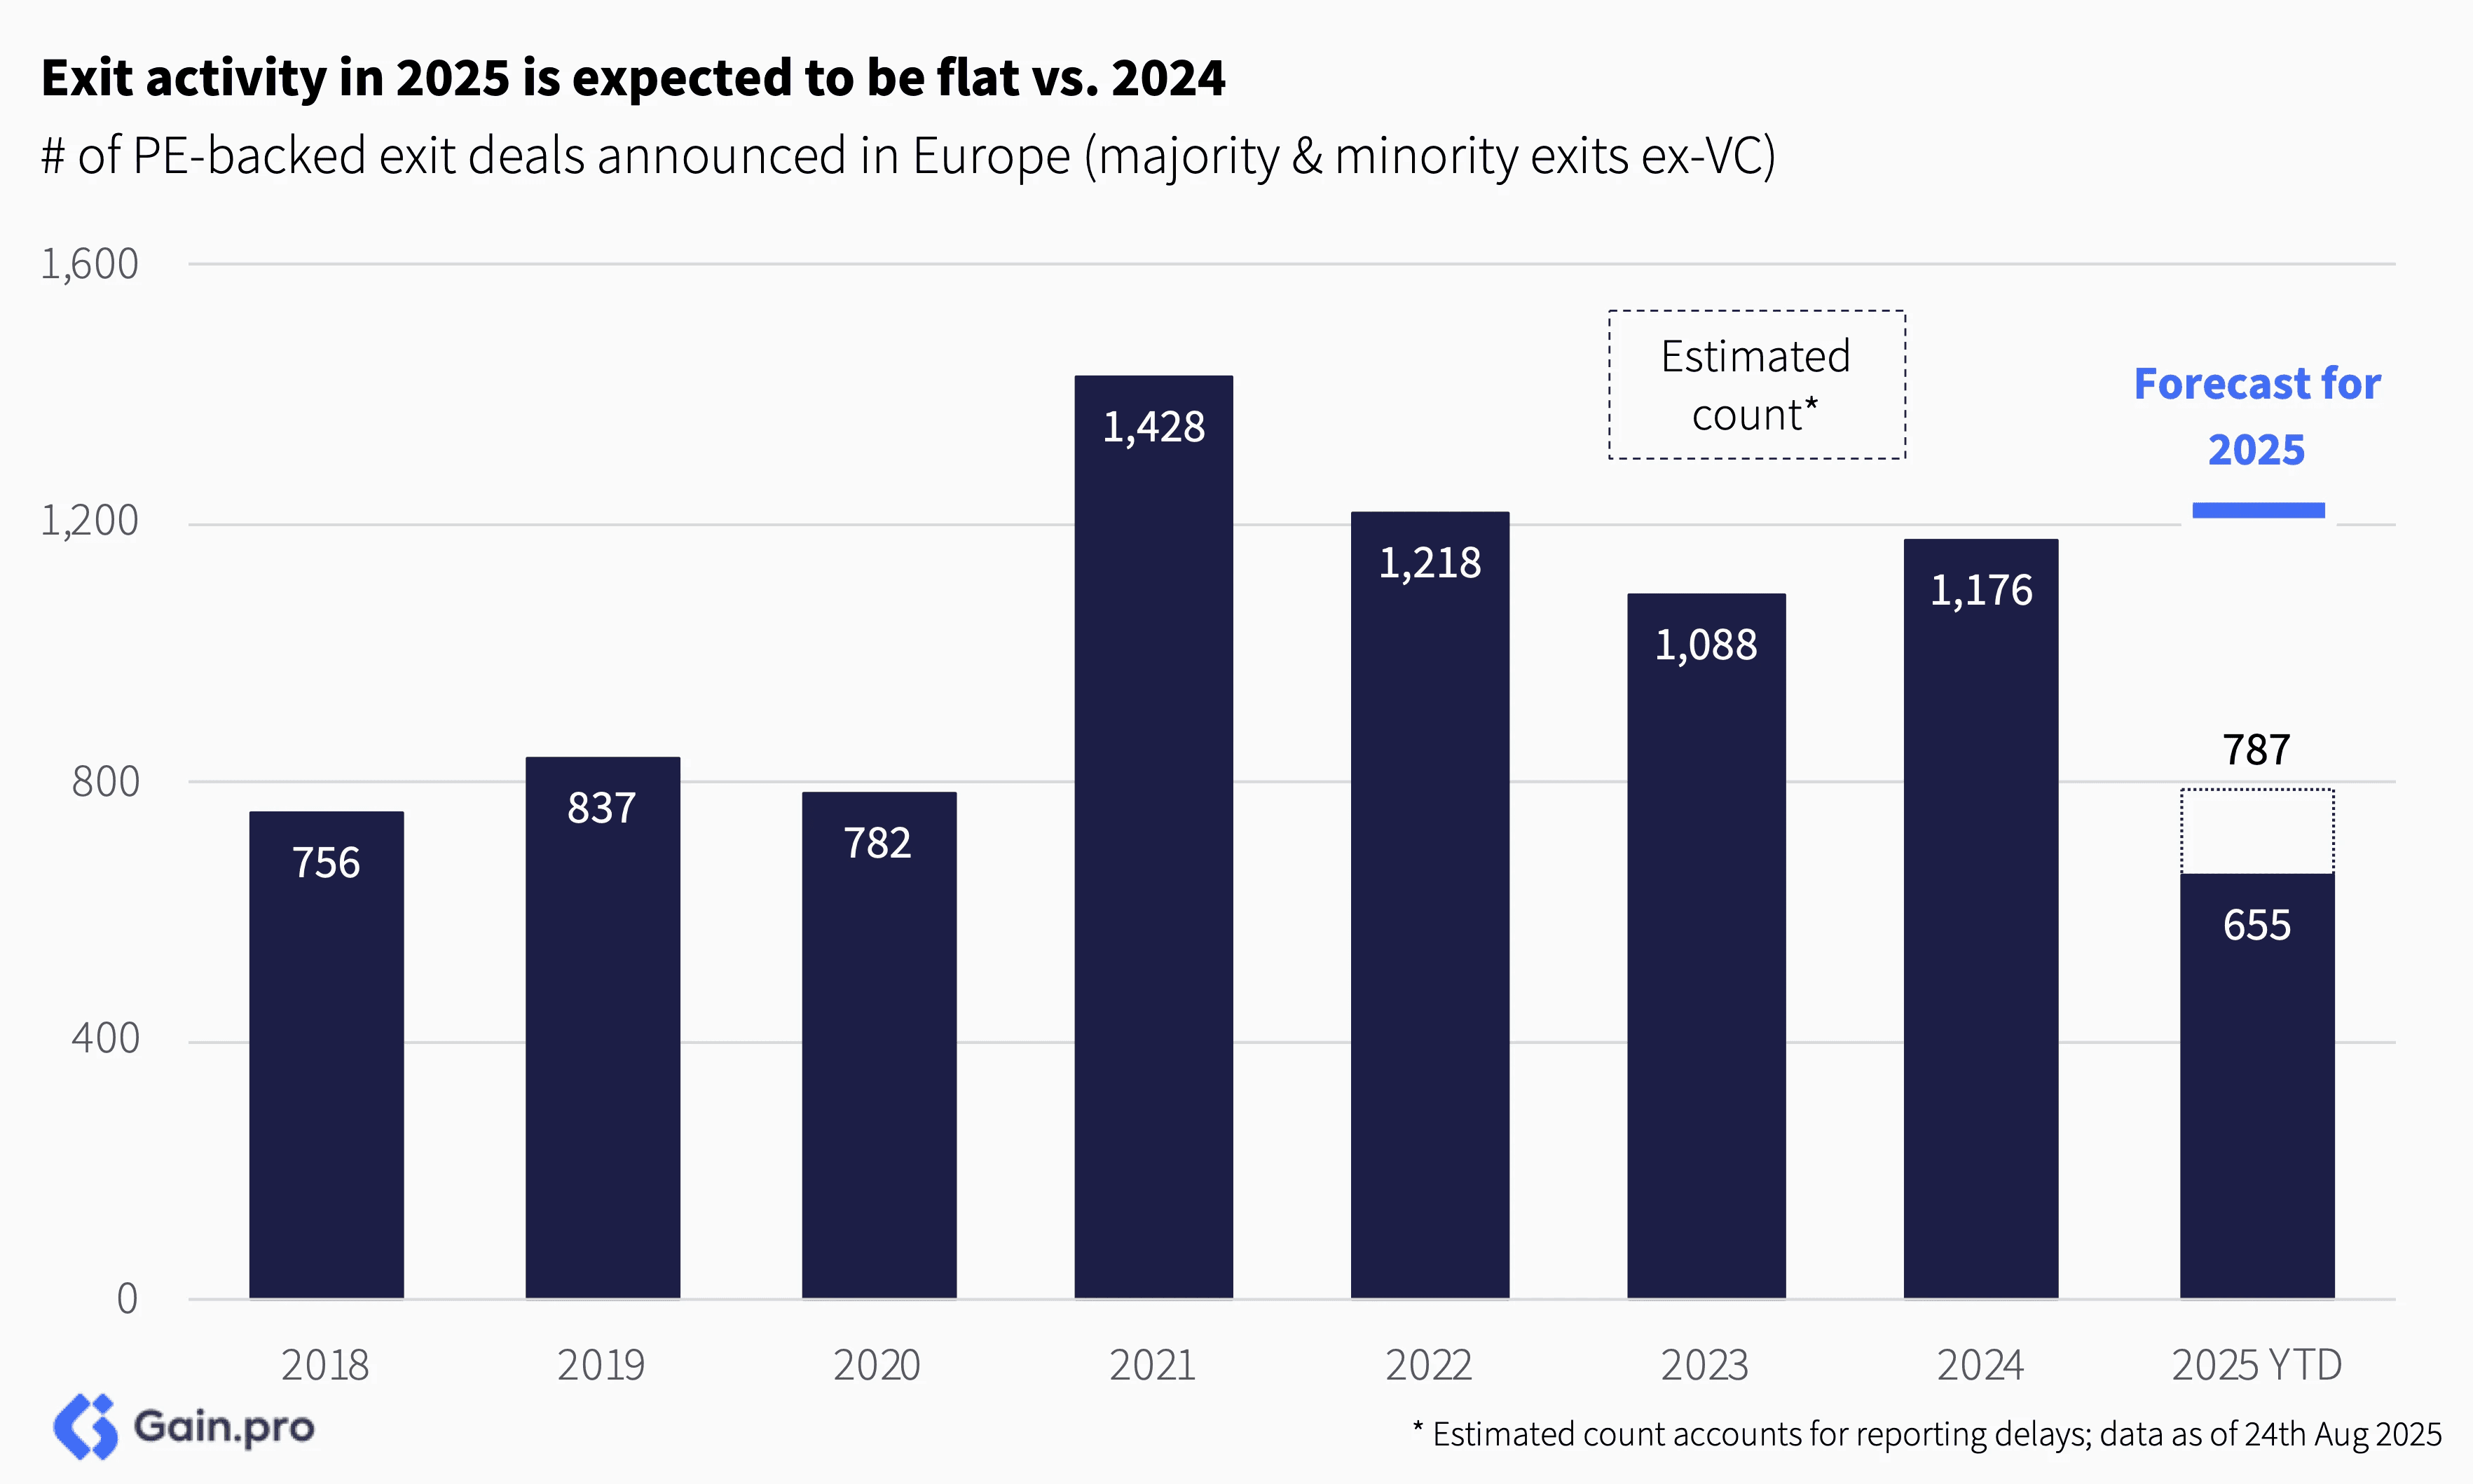
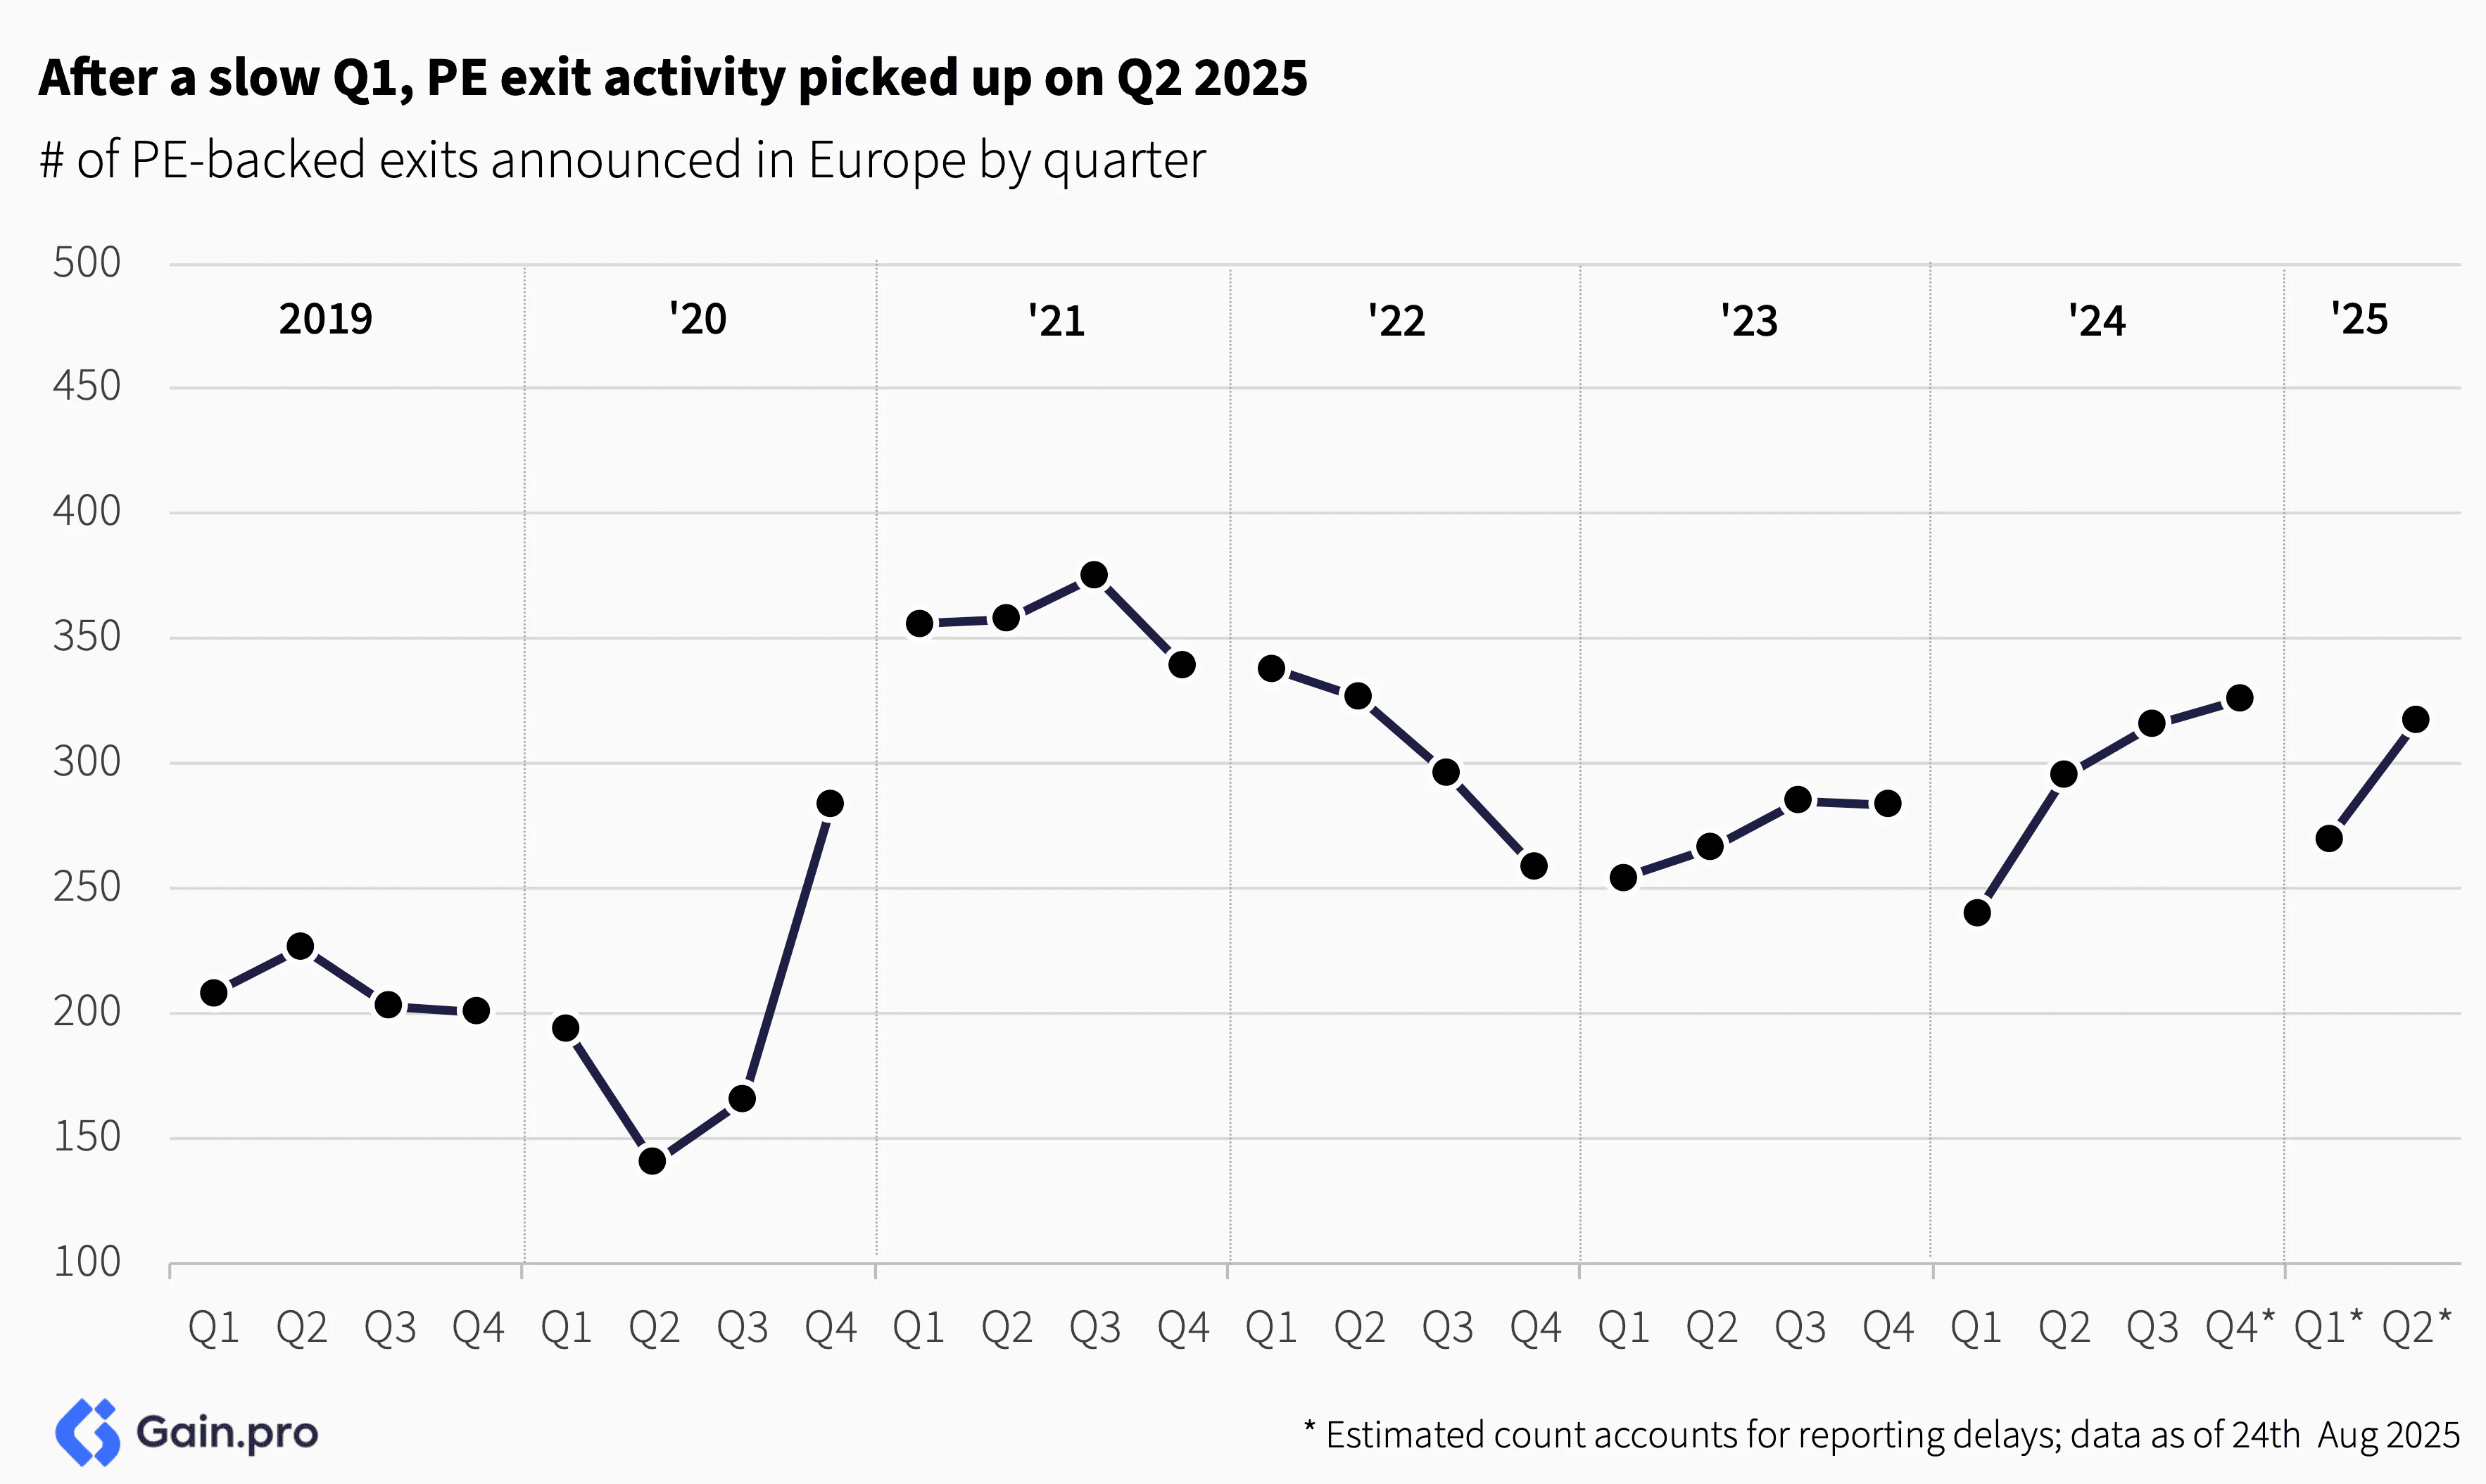
Compared to the second half of last year, PE exit activity slowed down in the first half of 2025. The year started with caution due to tariffs, trade and macro uncertainty. But as the year has progressed, we are seeing exits pick up, particularly with easing credit conditions and fund lifecycle pressures.
Holding Periods
Holding periods for PE assets are sitting near a decade-high in Europe. The median company exiting in 2025 spent 5.7 years in the portfolio, up from 4.6 years in 2020. Holding periods remain a key focus area for both GPs and LPs, given their significant impact on performance metrics such as IRR and DPI.

A third of PE assets stayed longer than 7 years in the portfolio (up from 21% in 2020/21). GPs are reluctant to sell assets at lower valuations, striving to balance LP liquidity with the potential for improved valuations going forward.
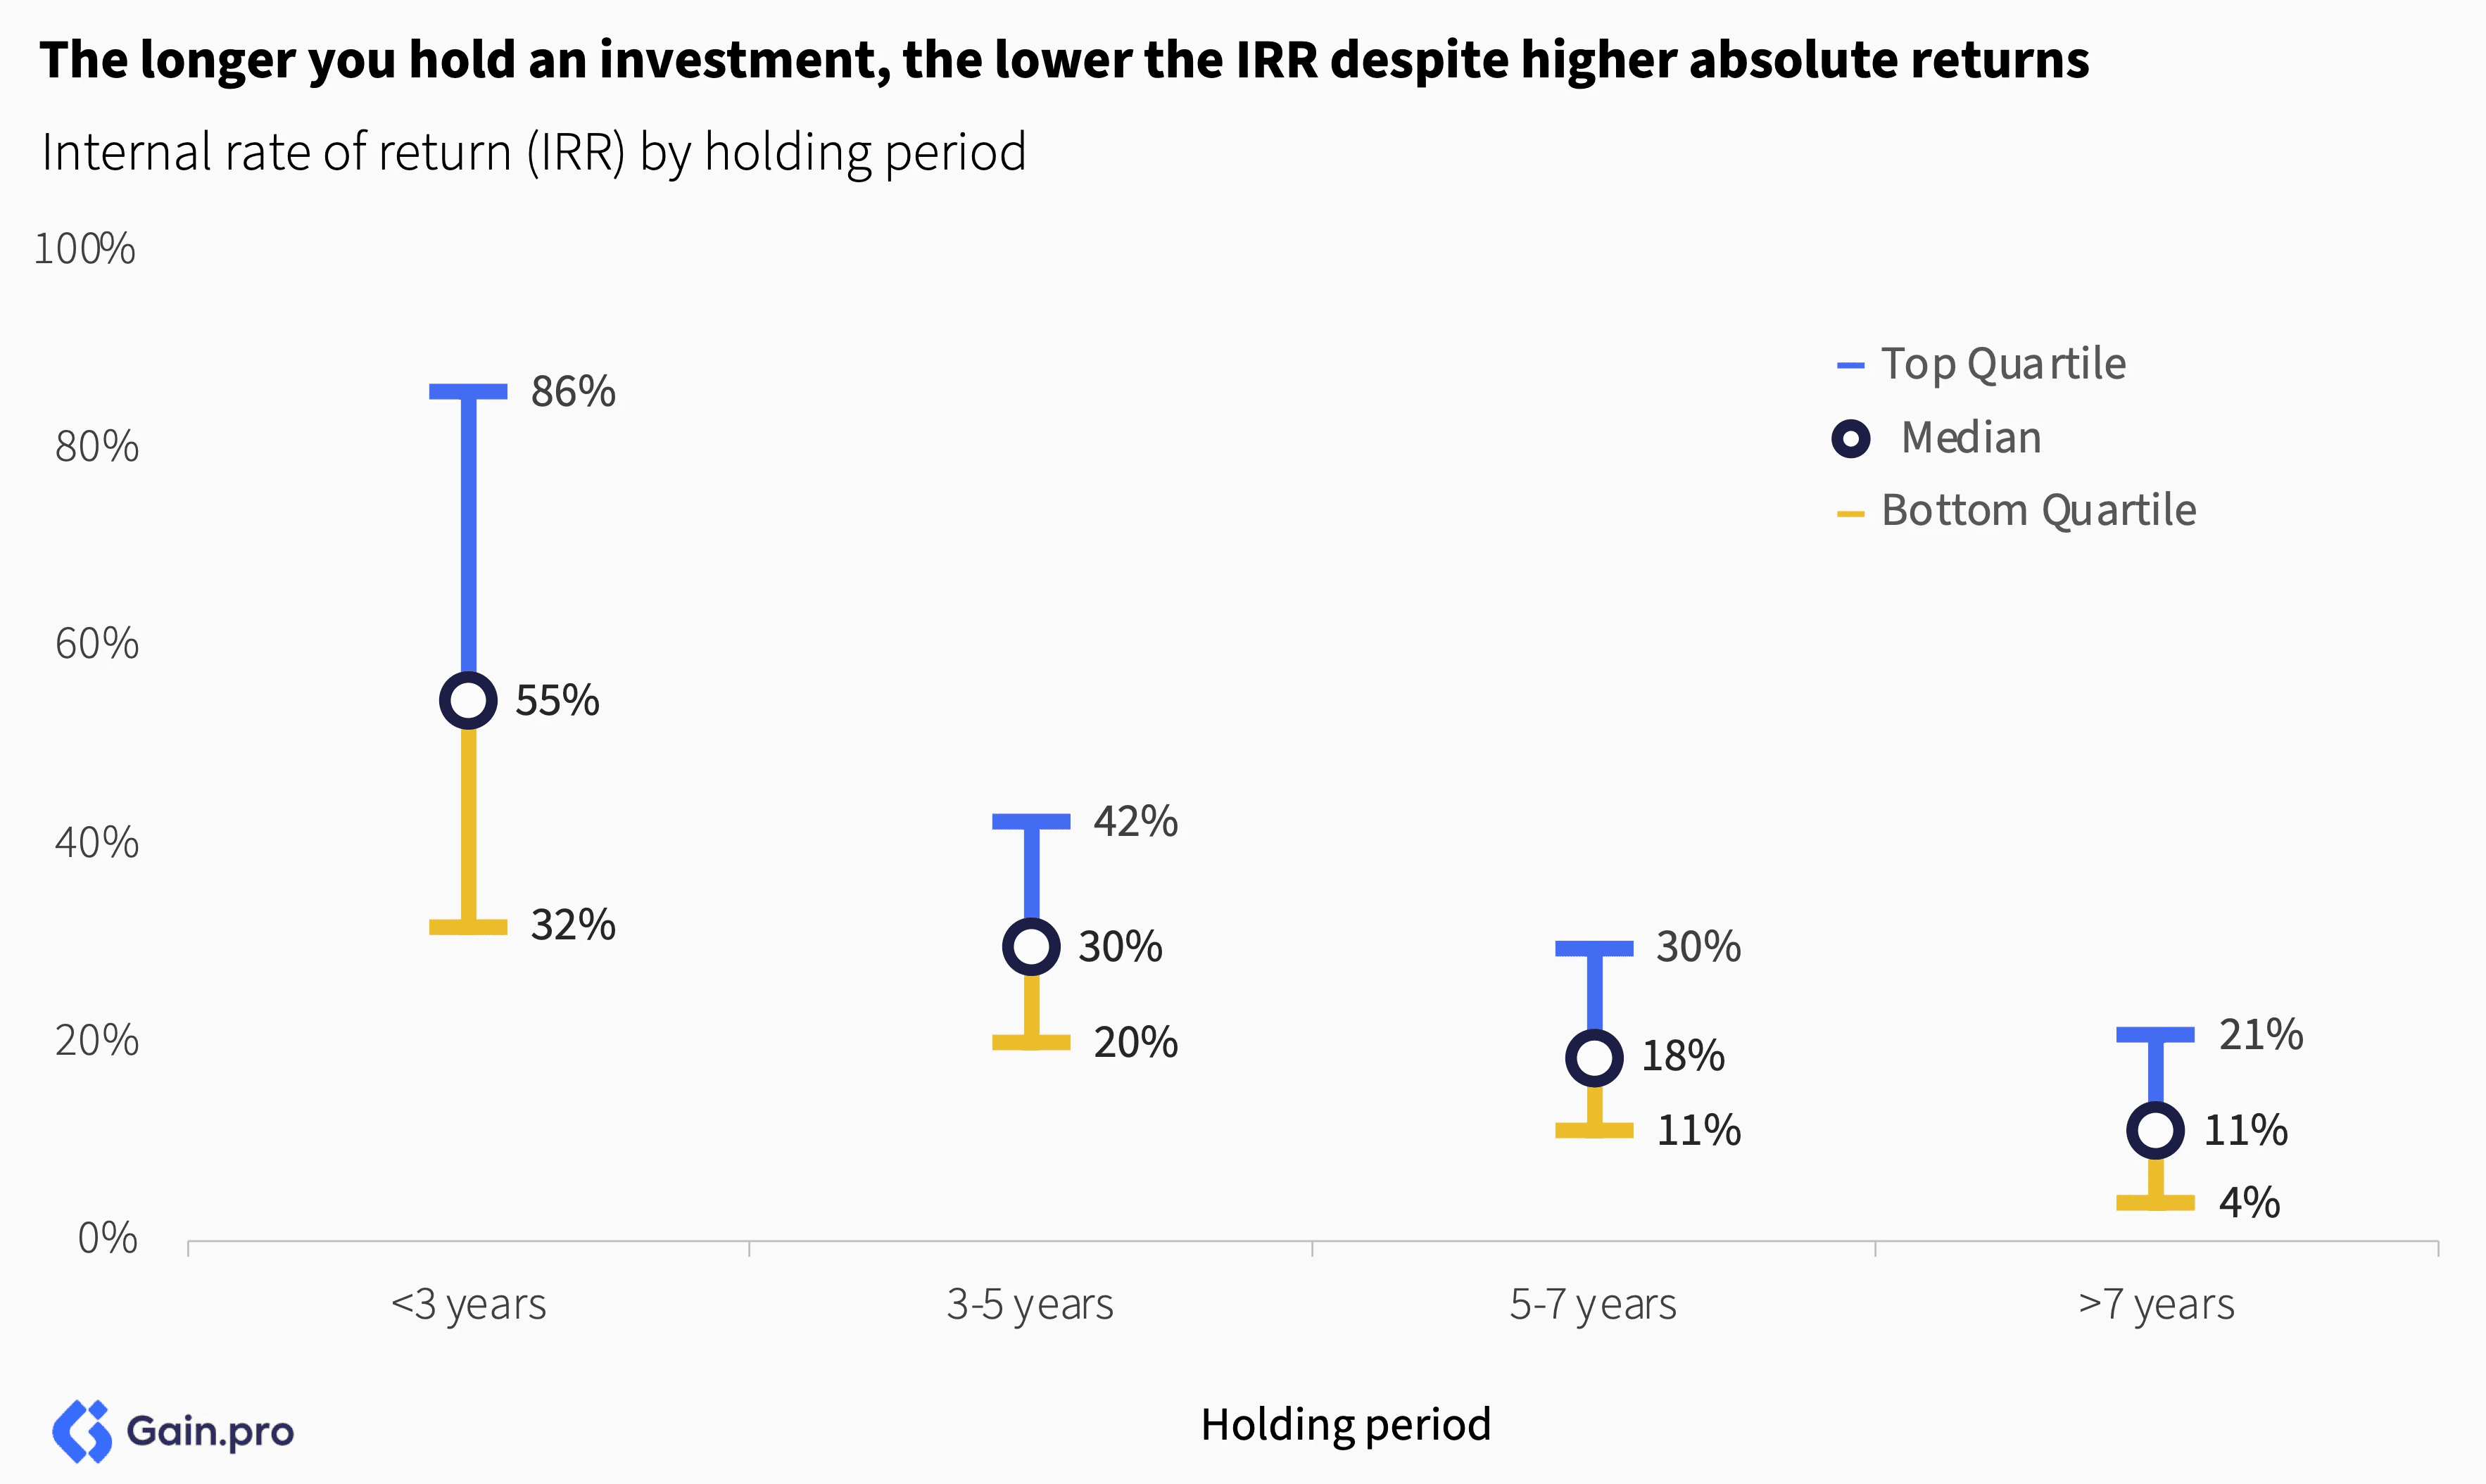
The longer you hold an investment, the lower the IRR despite higher absolute returns. For example, doubling your money in 2 years delivers a 41% IRR, while tripling it in 8 years yields only 15% IRR. This creates a fundamental tradeoff between a higher MOIC and a higher IRR, and whether you let your winners run.
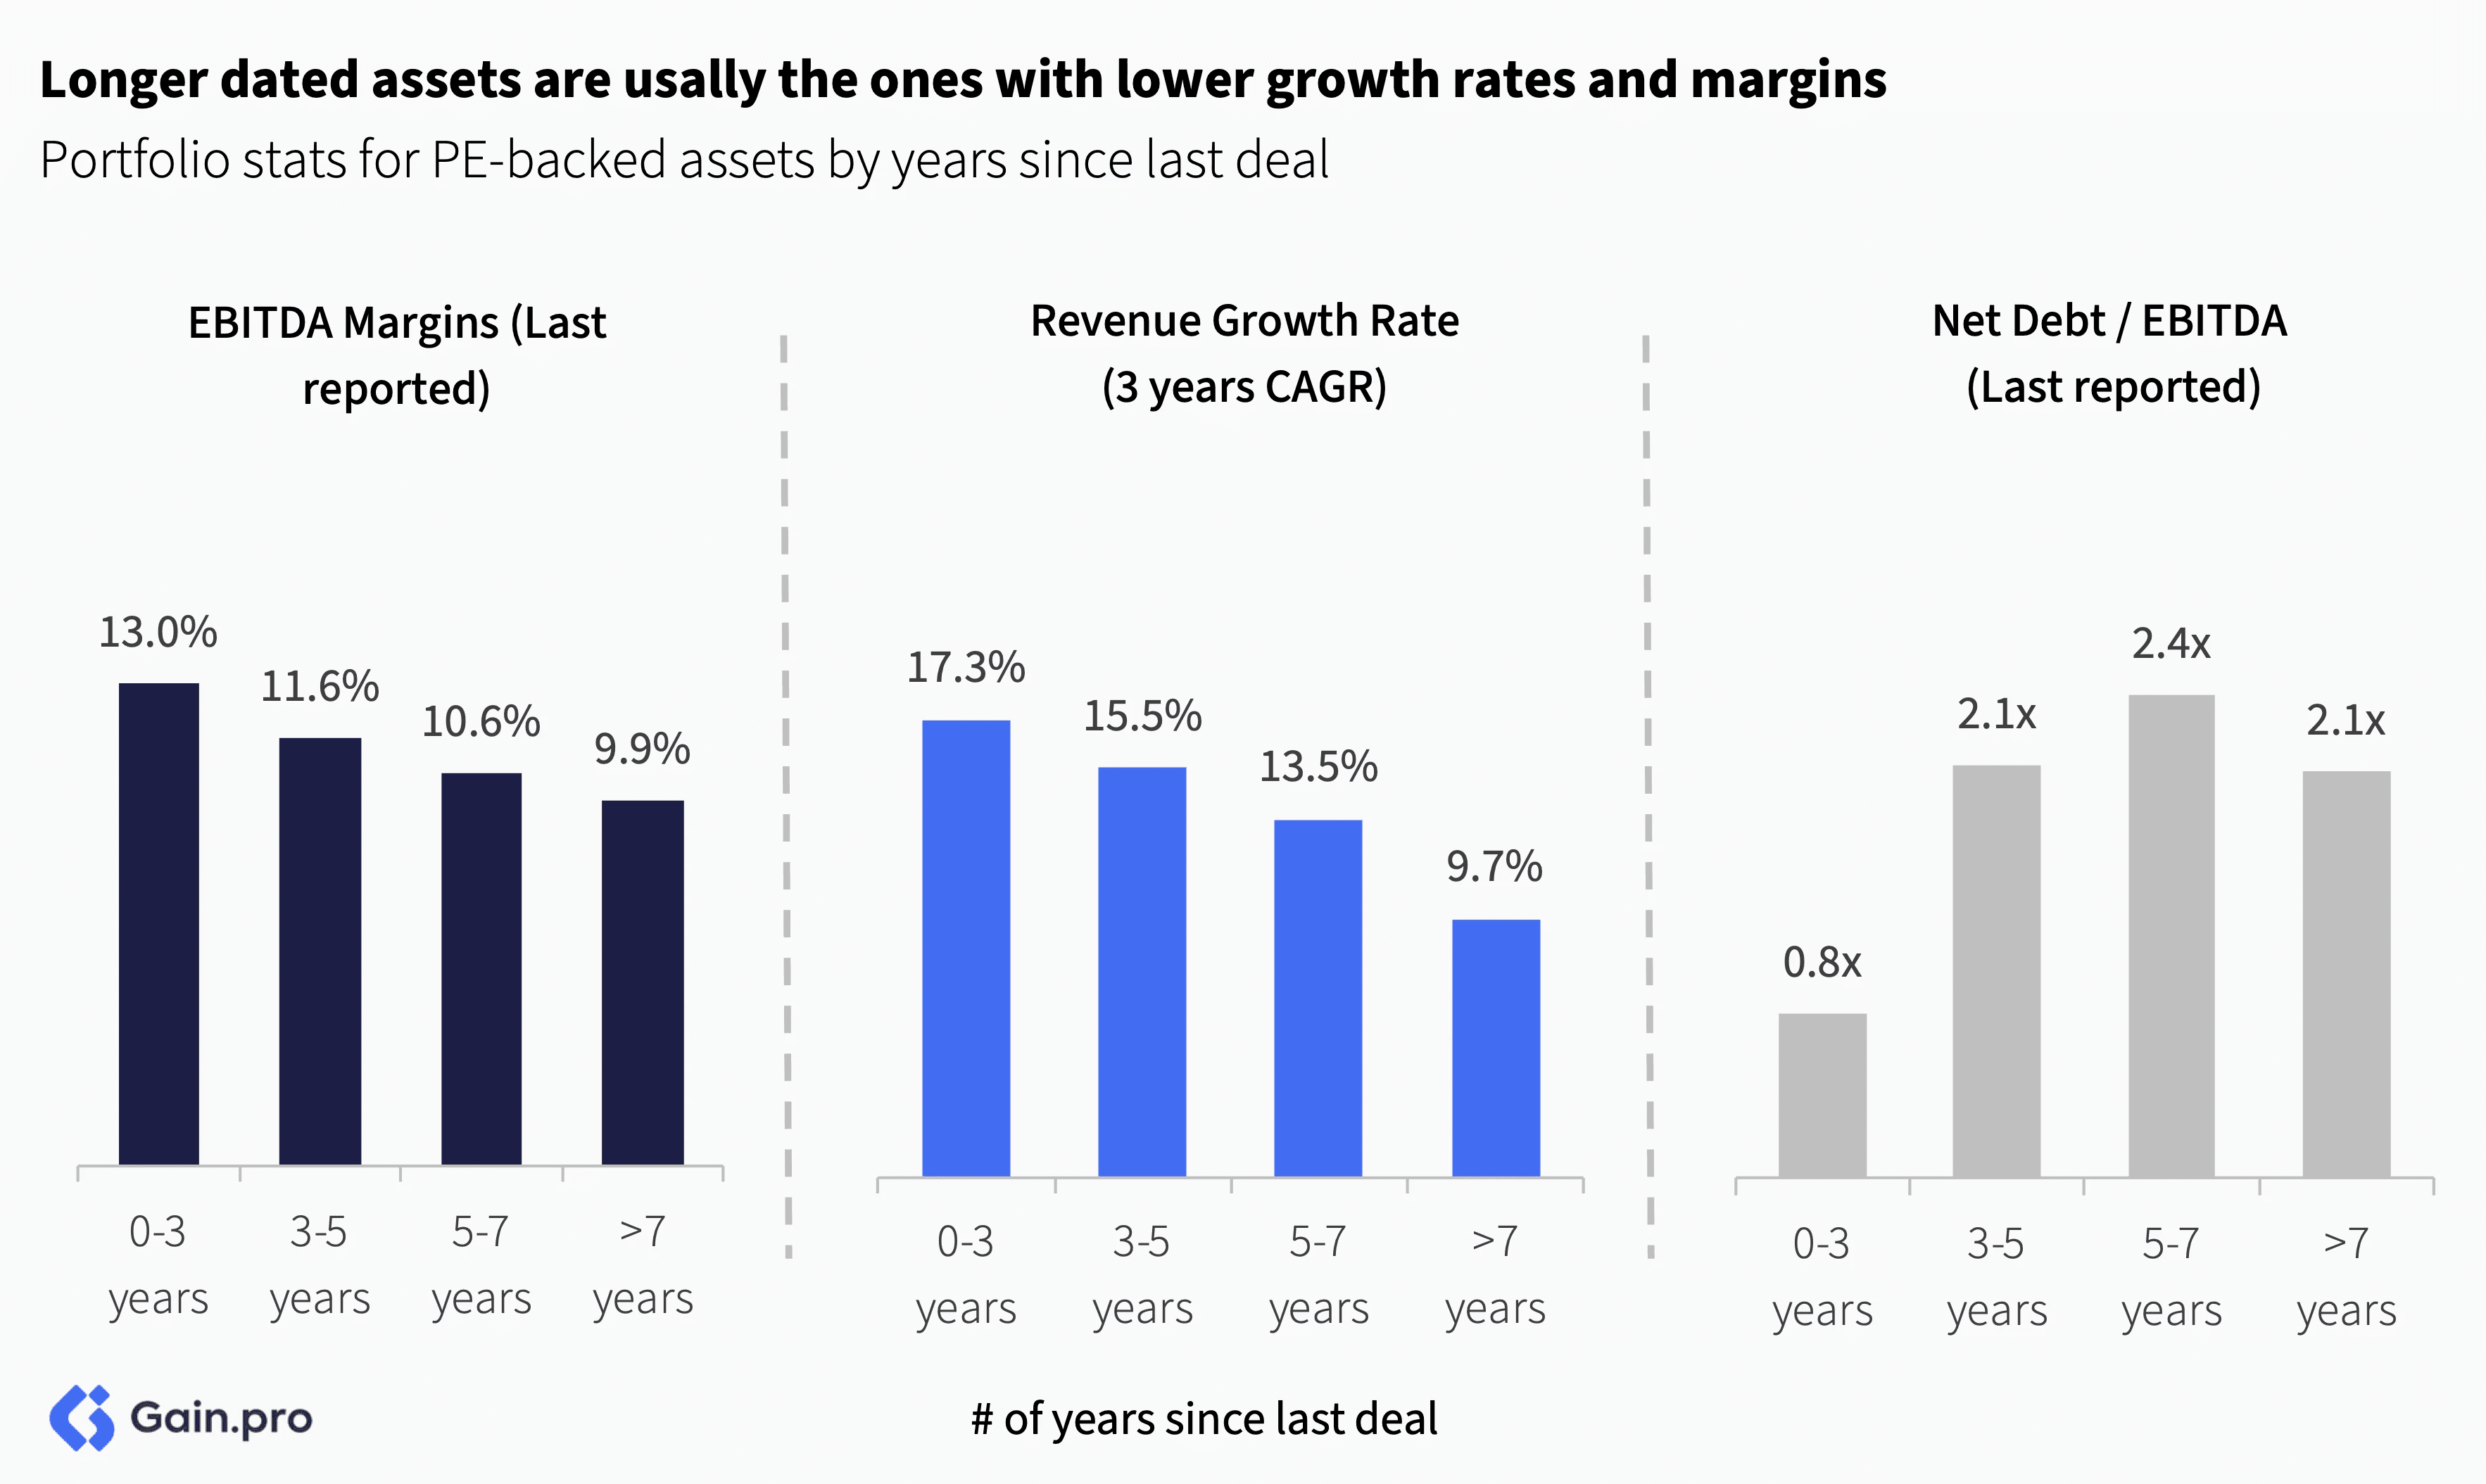
Selling some of those longer-dated assets might pose a challenge. Investors typically prioritize selling their stronger-performing assets first to demonstrate DPI and returns to LPs, meaning the remaining assets left behind are the ones with slower growth rates and lower margins. Exceptions do exist though where sponsors choose to retain strong-performing assets for longer by requesting fund extensions or rolling them into continuation vehicles.
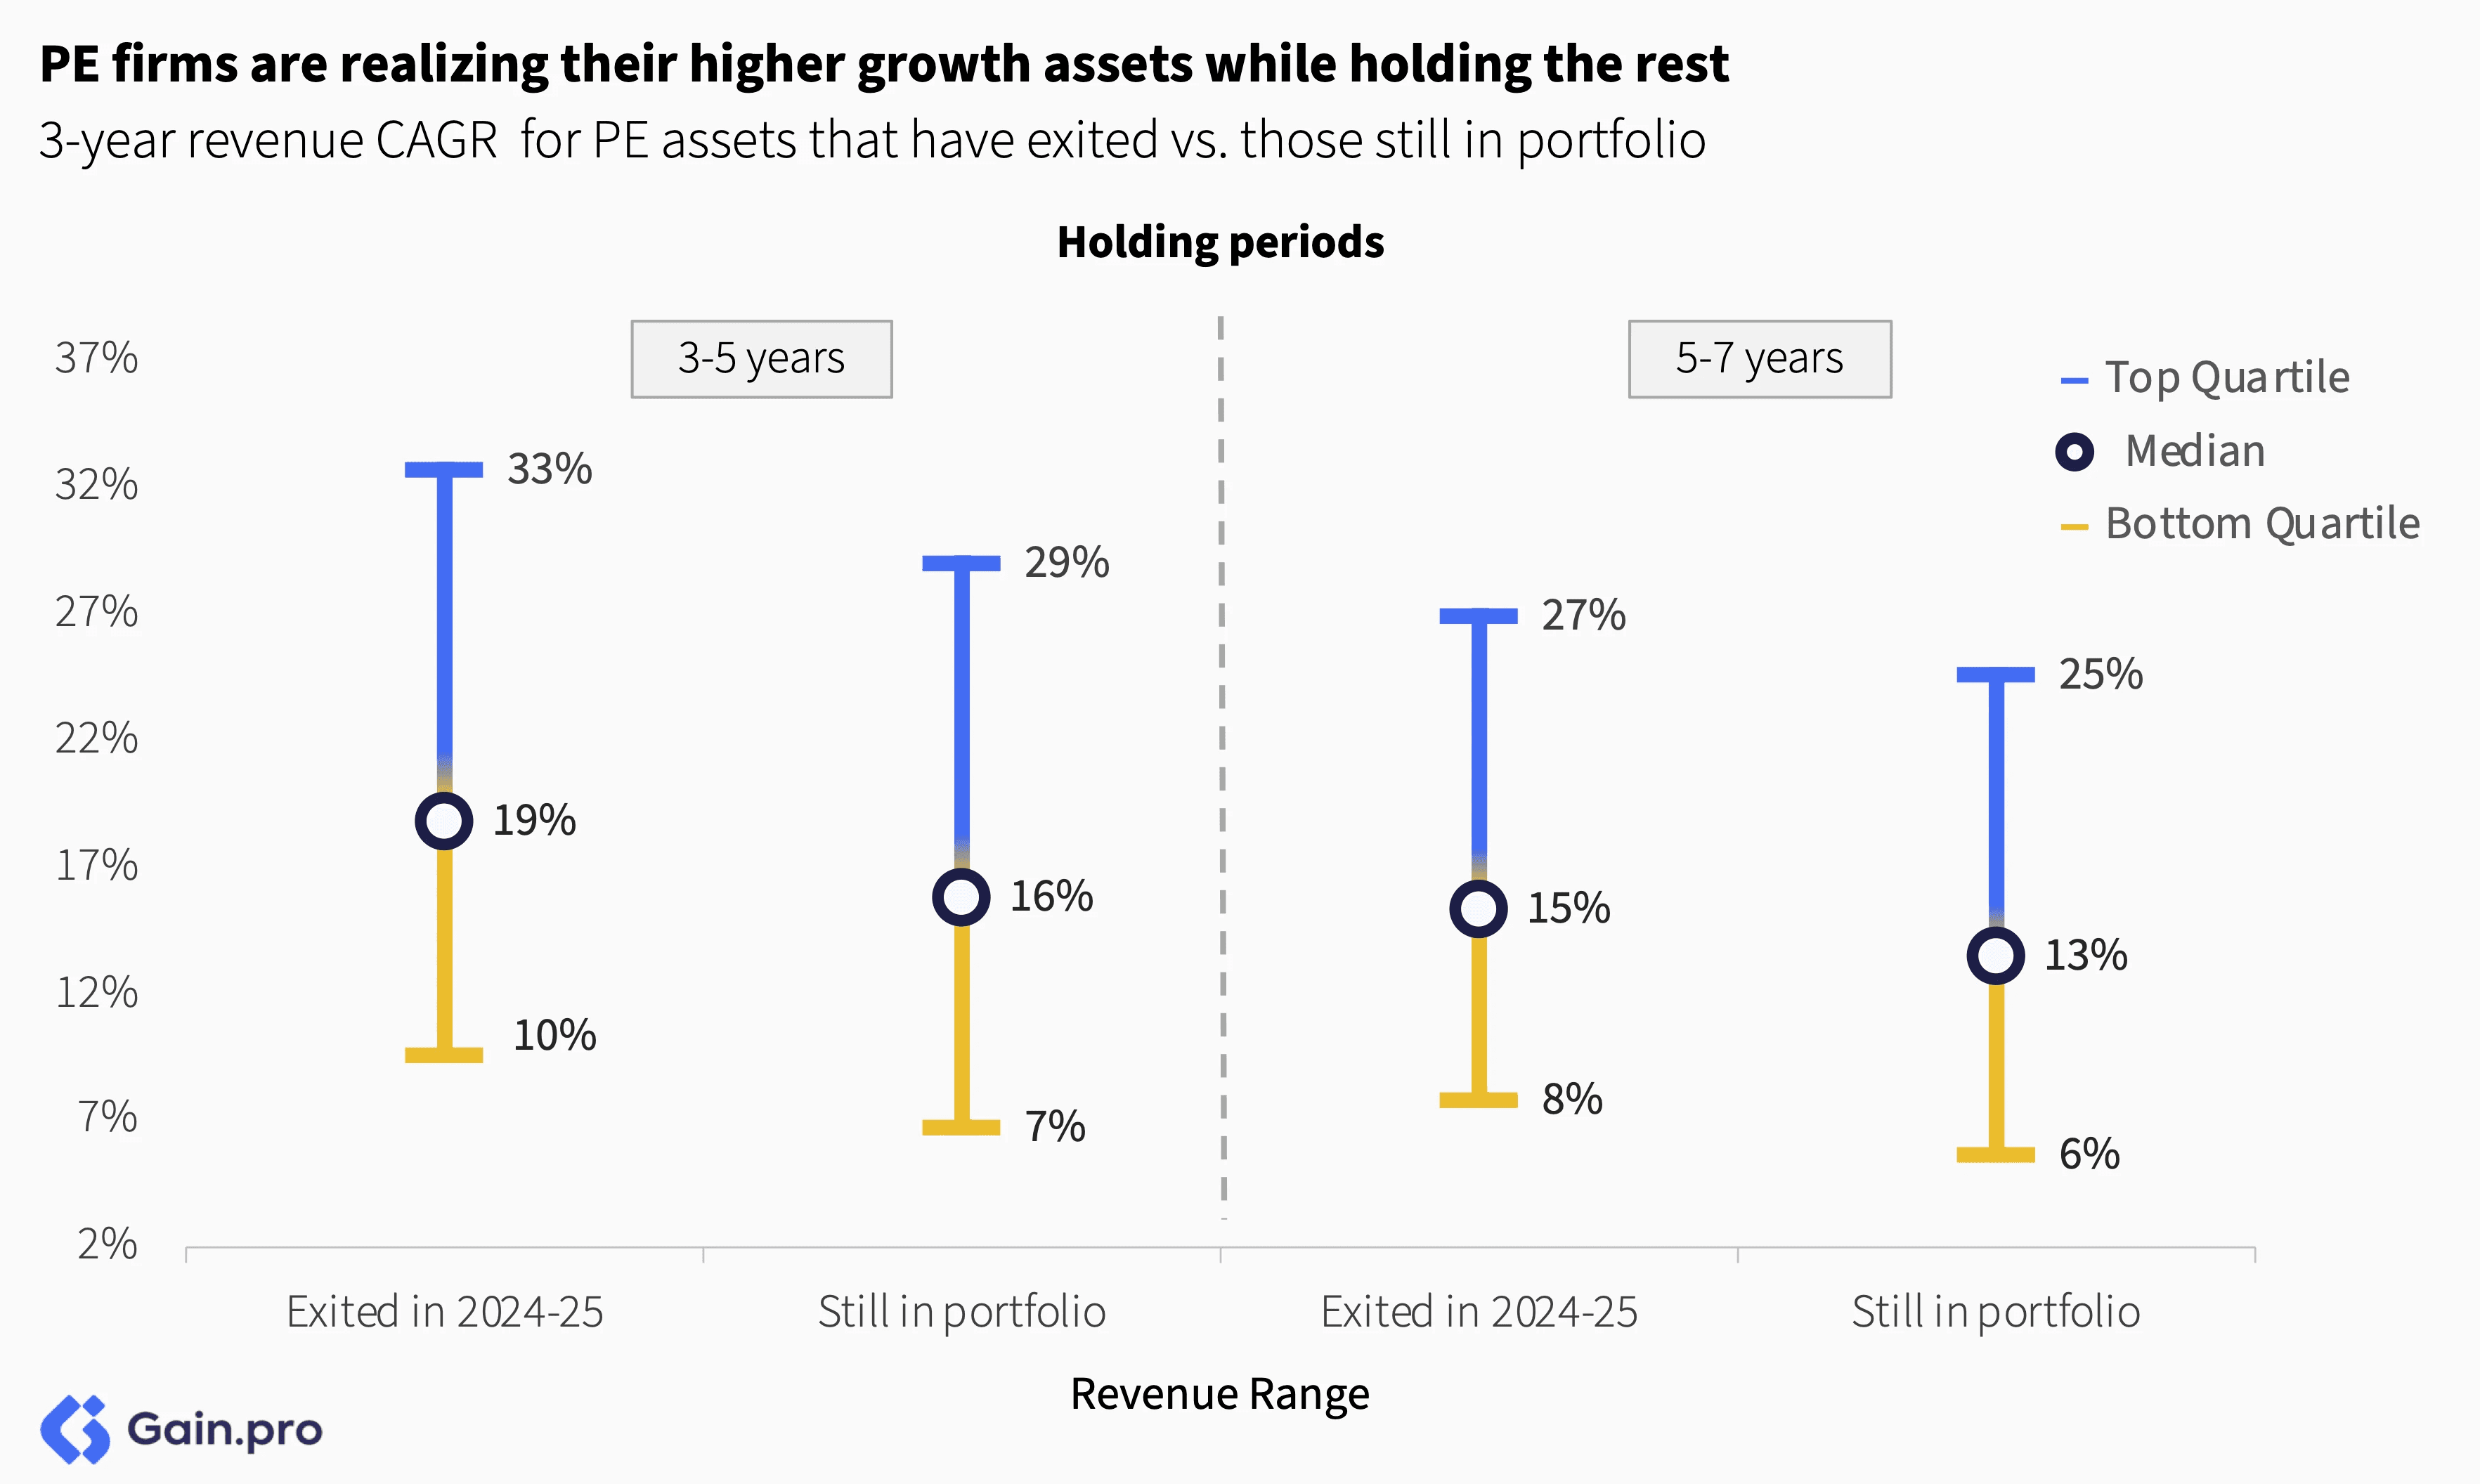
Beyond the headline stats, the exit scenario is more challenging than it looks. If you look at the data, only the strongest assets are able to find a buyer. Take growth as a proxy: among assets held for 3–5 years or 5-7 years, those that exited had a 2-3pp gap in median revenue growth over those still in the portfolio.
Exits by Sector and Region
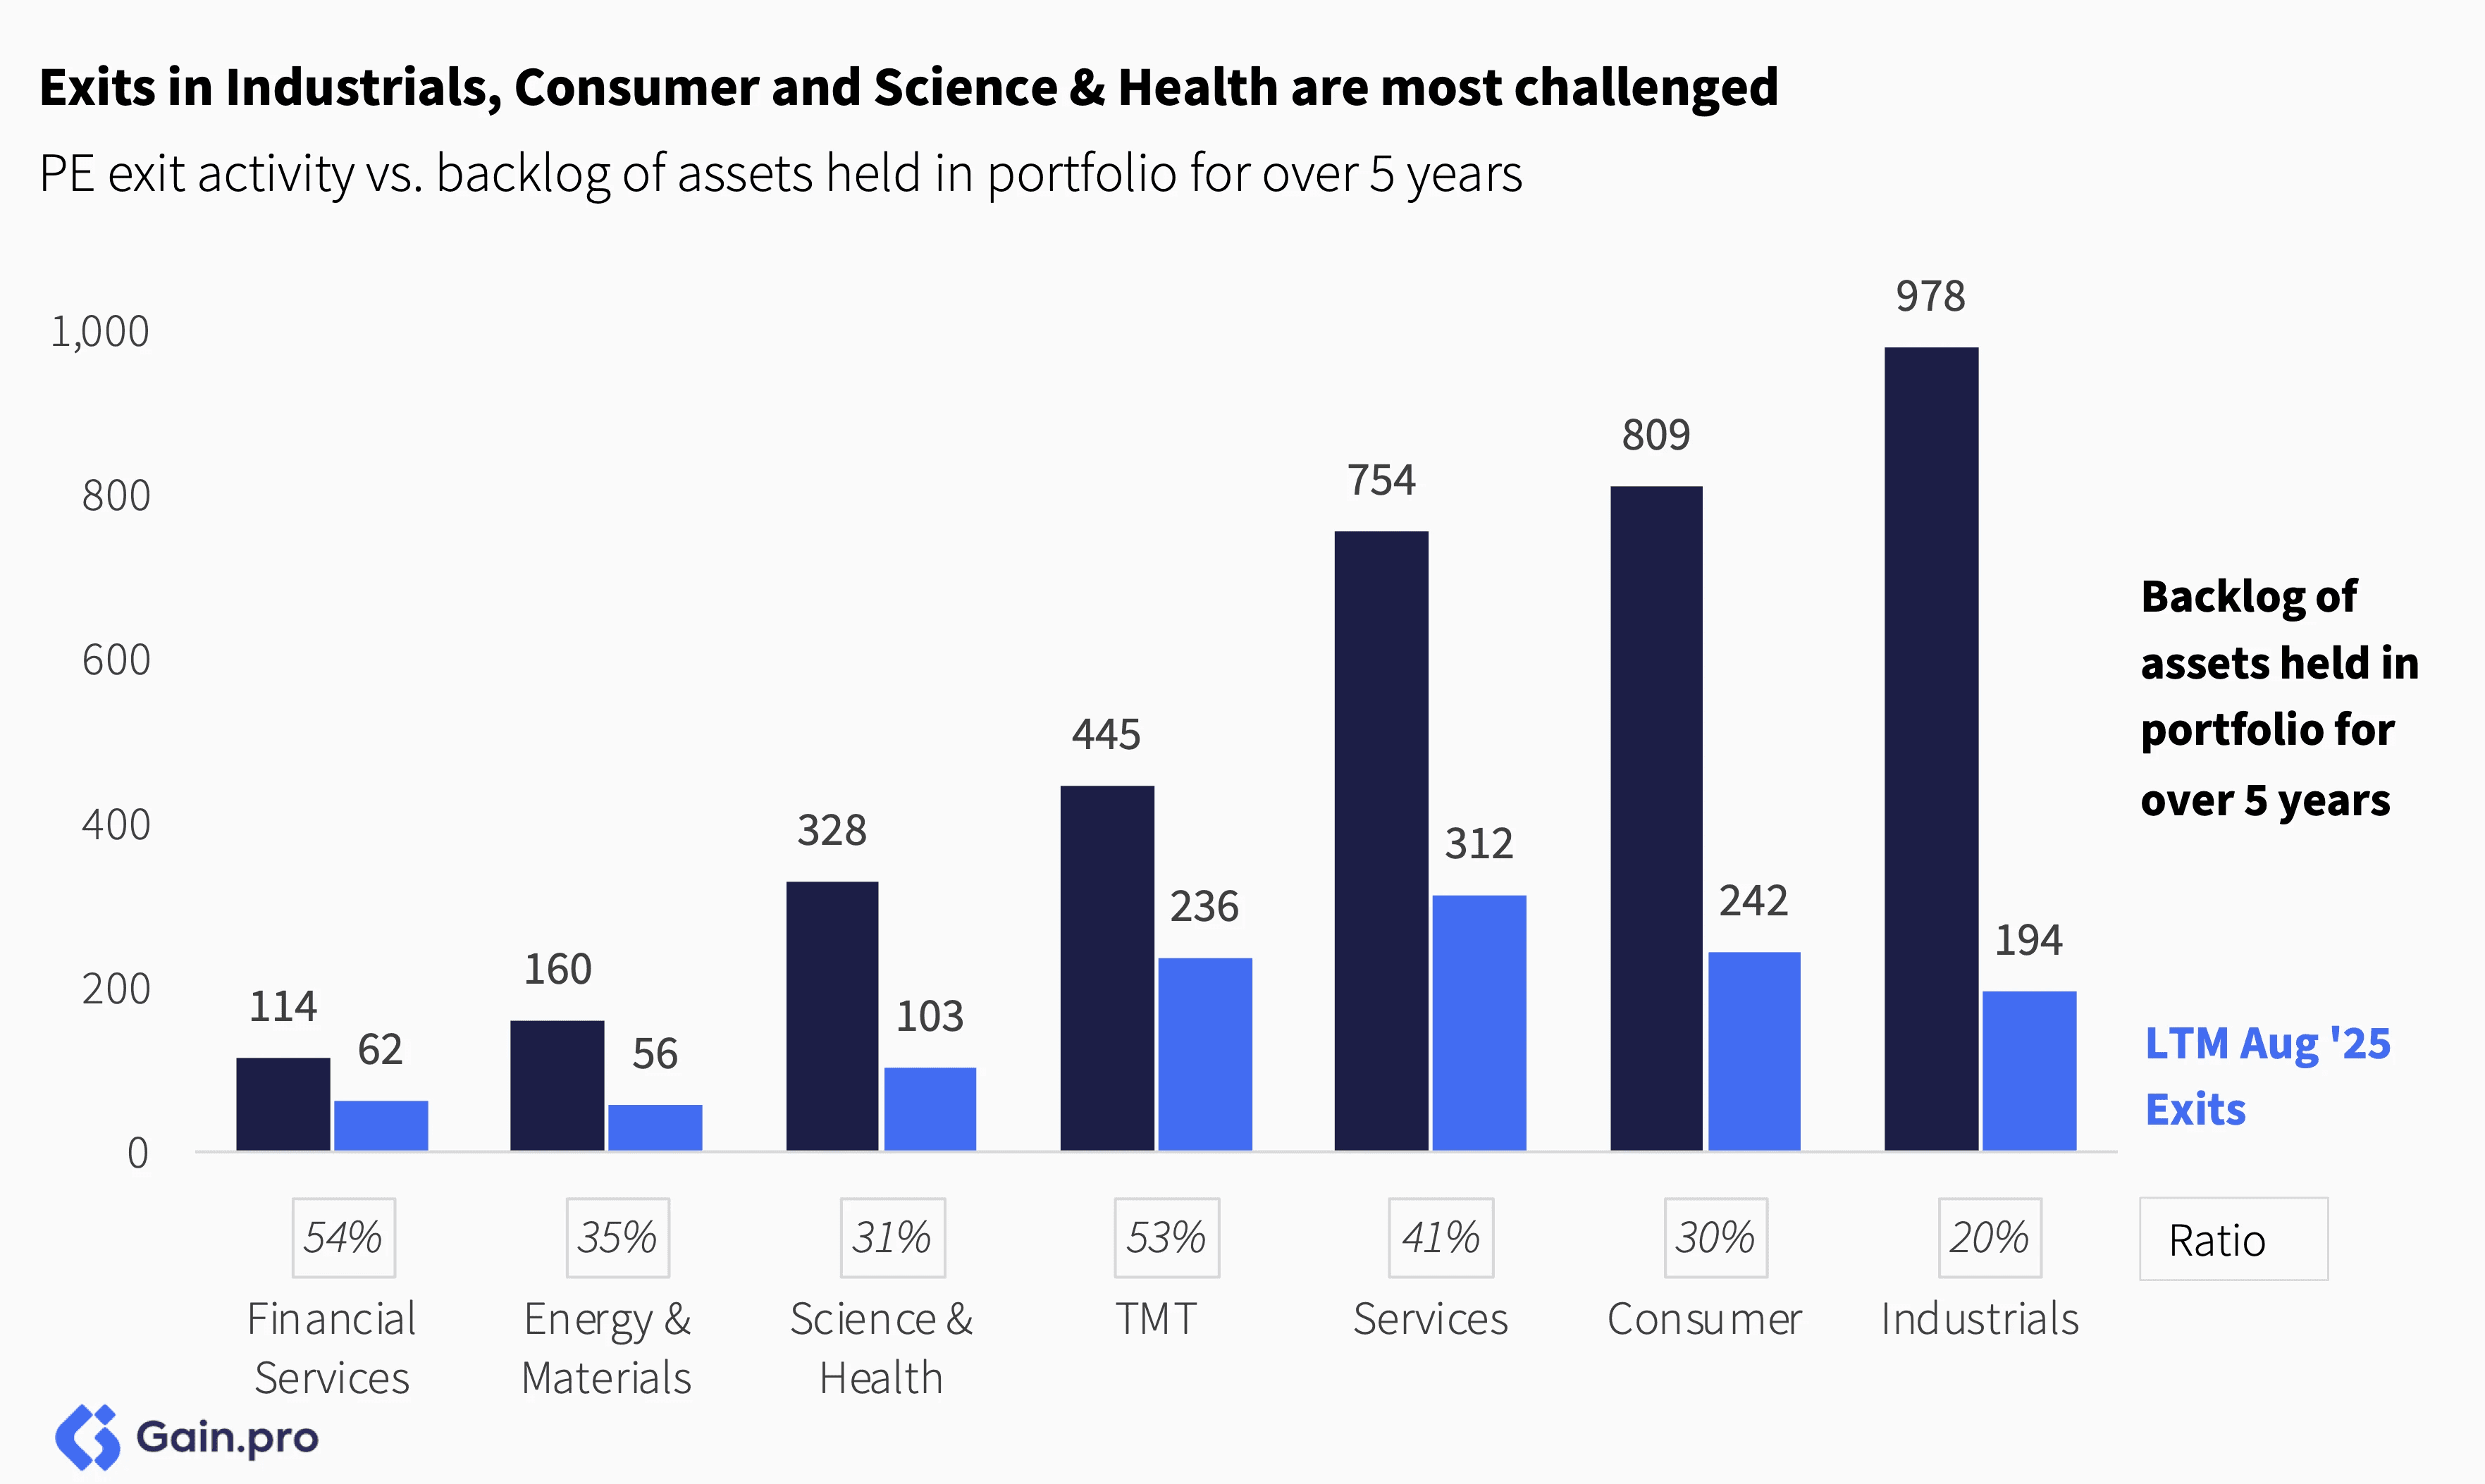
Compared to the backlog, exits in Industrials, Consumer and Science & Health are most challenged. Both Industrials and Consumer have seen growth and margins slow down, which has clouded the outlook for these assets. The Science & Health sector has been burdened by regulatory challenges, particularly in Germany. On the flip side, exits look healthier in TMT, Services and Financial Services.
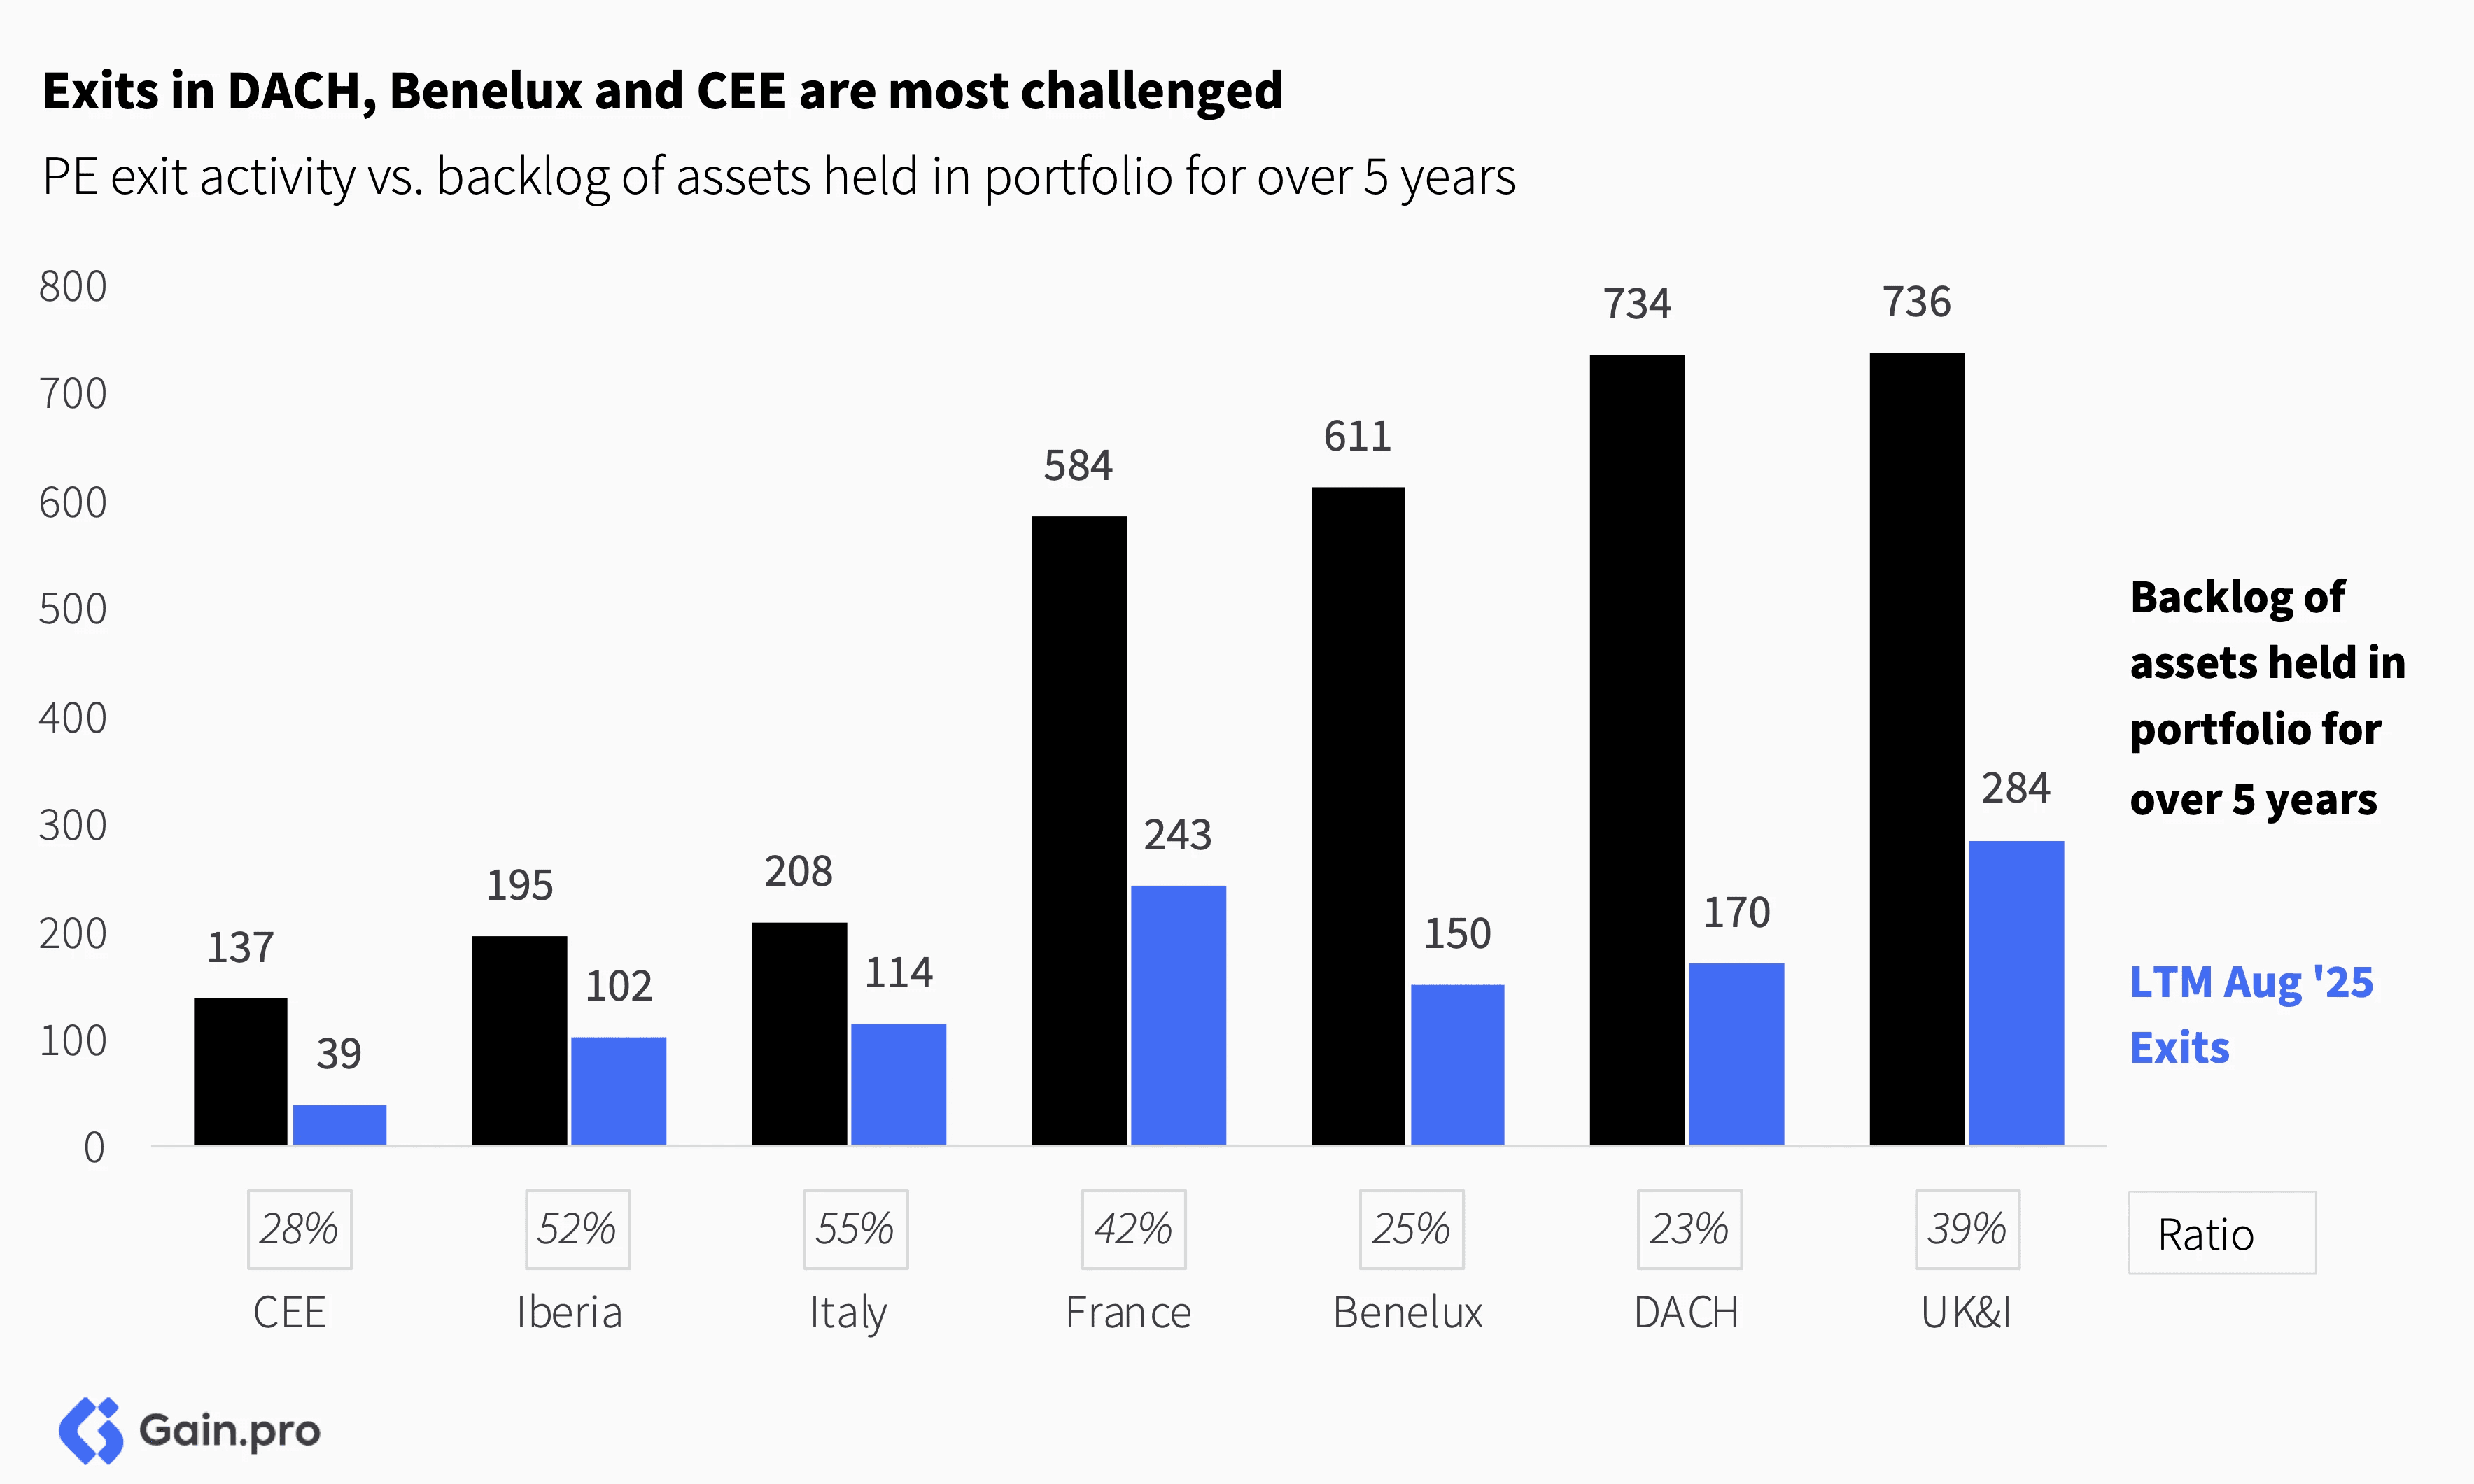
By region, exits in DACH, Benelux and CEE are most challenged. Regions such as Italy, Iberia, UK&I and France have fared better, driven by stronger growth profiles in those regions and North American investor interest.
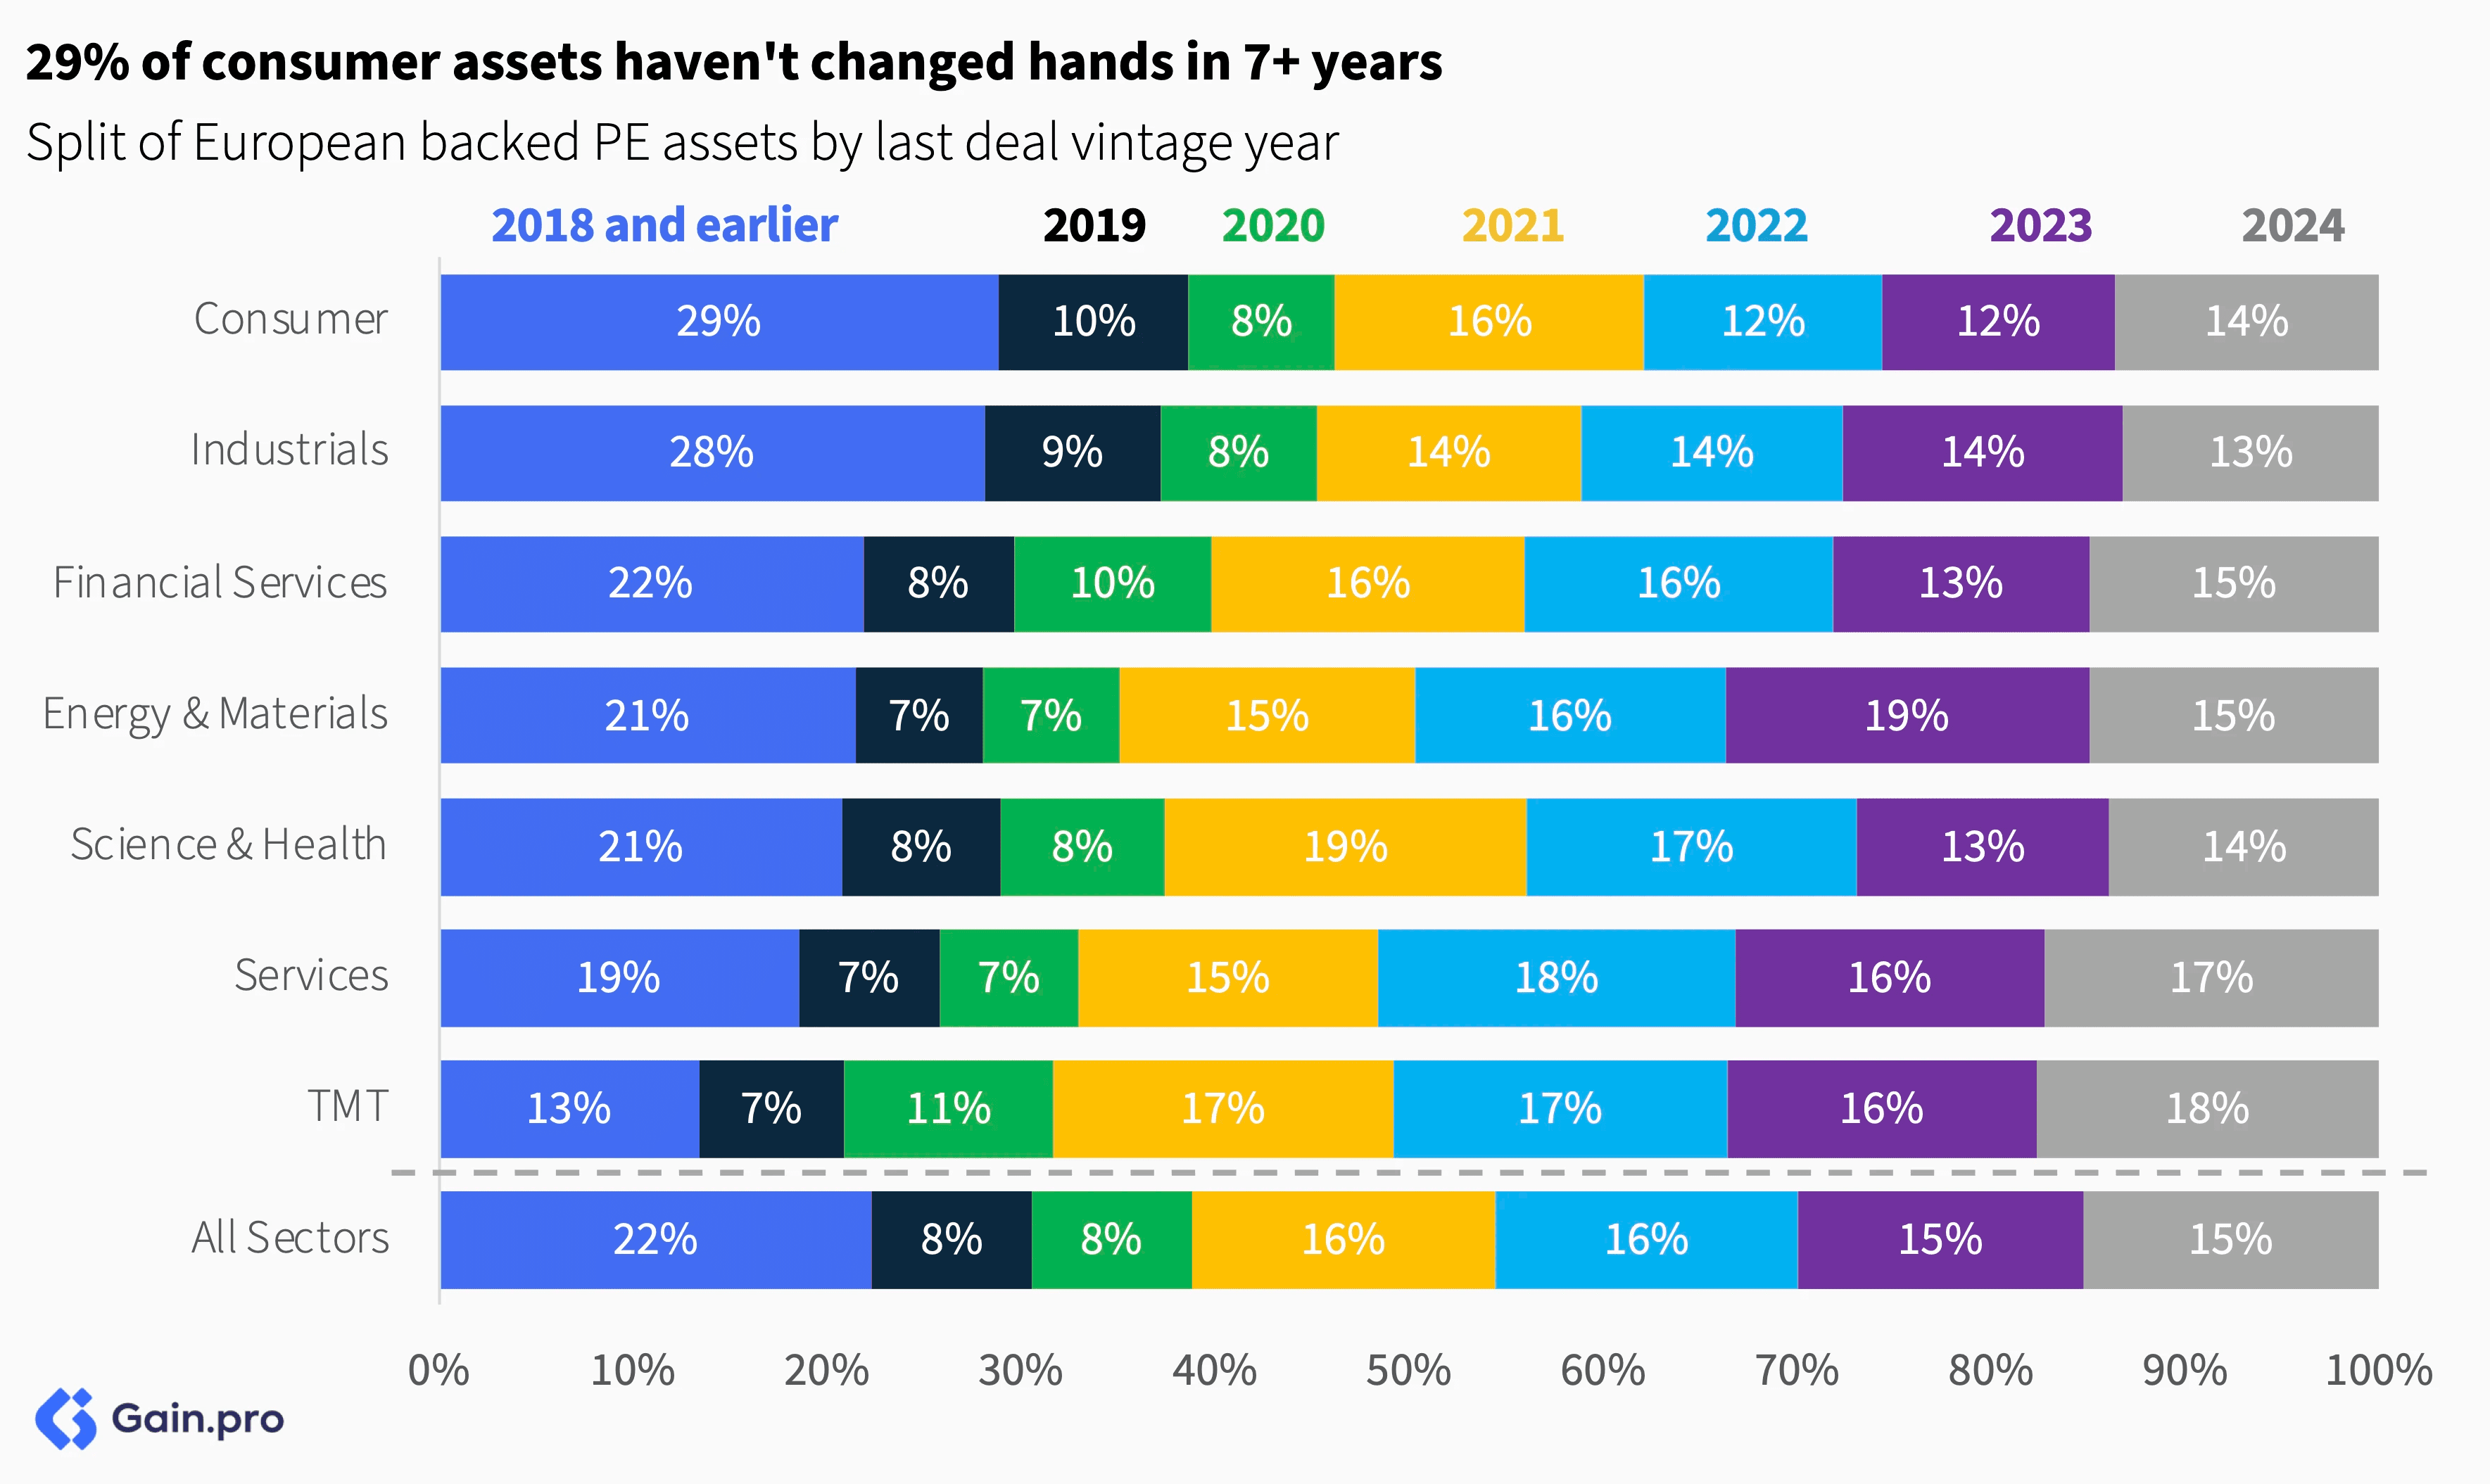
By sector, Consumer, Industrials and Financial Services have the highest share of longer-held assets. Almost 30% of assets in those sectors haven’t had an ownership transfer in the last 6 years. More broadly, the 2021 and 2022 vintage years remain the largest, comprising 32% of European PE-backed assets, driven by heightened deal activity during that period.
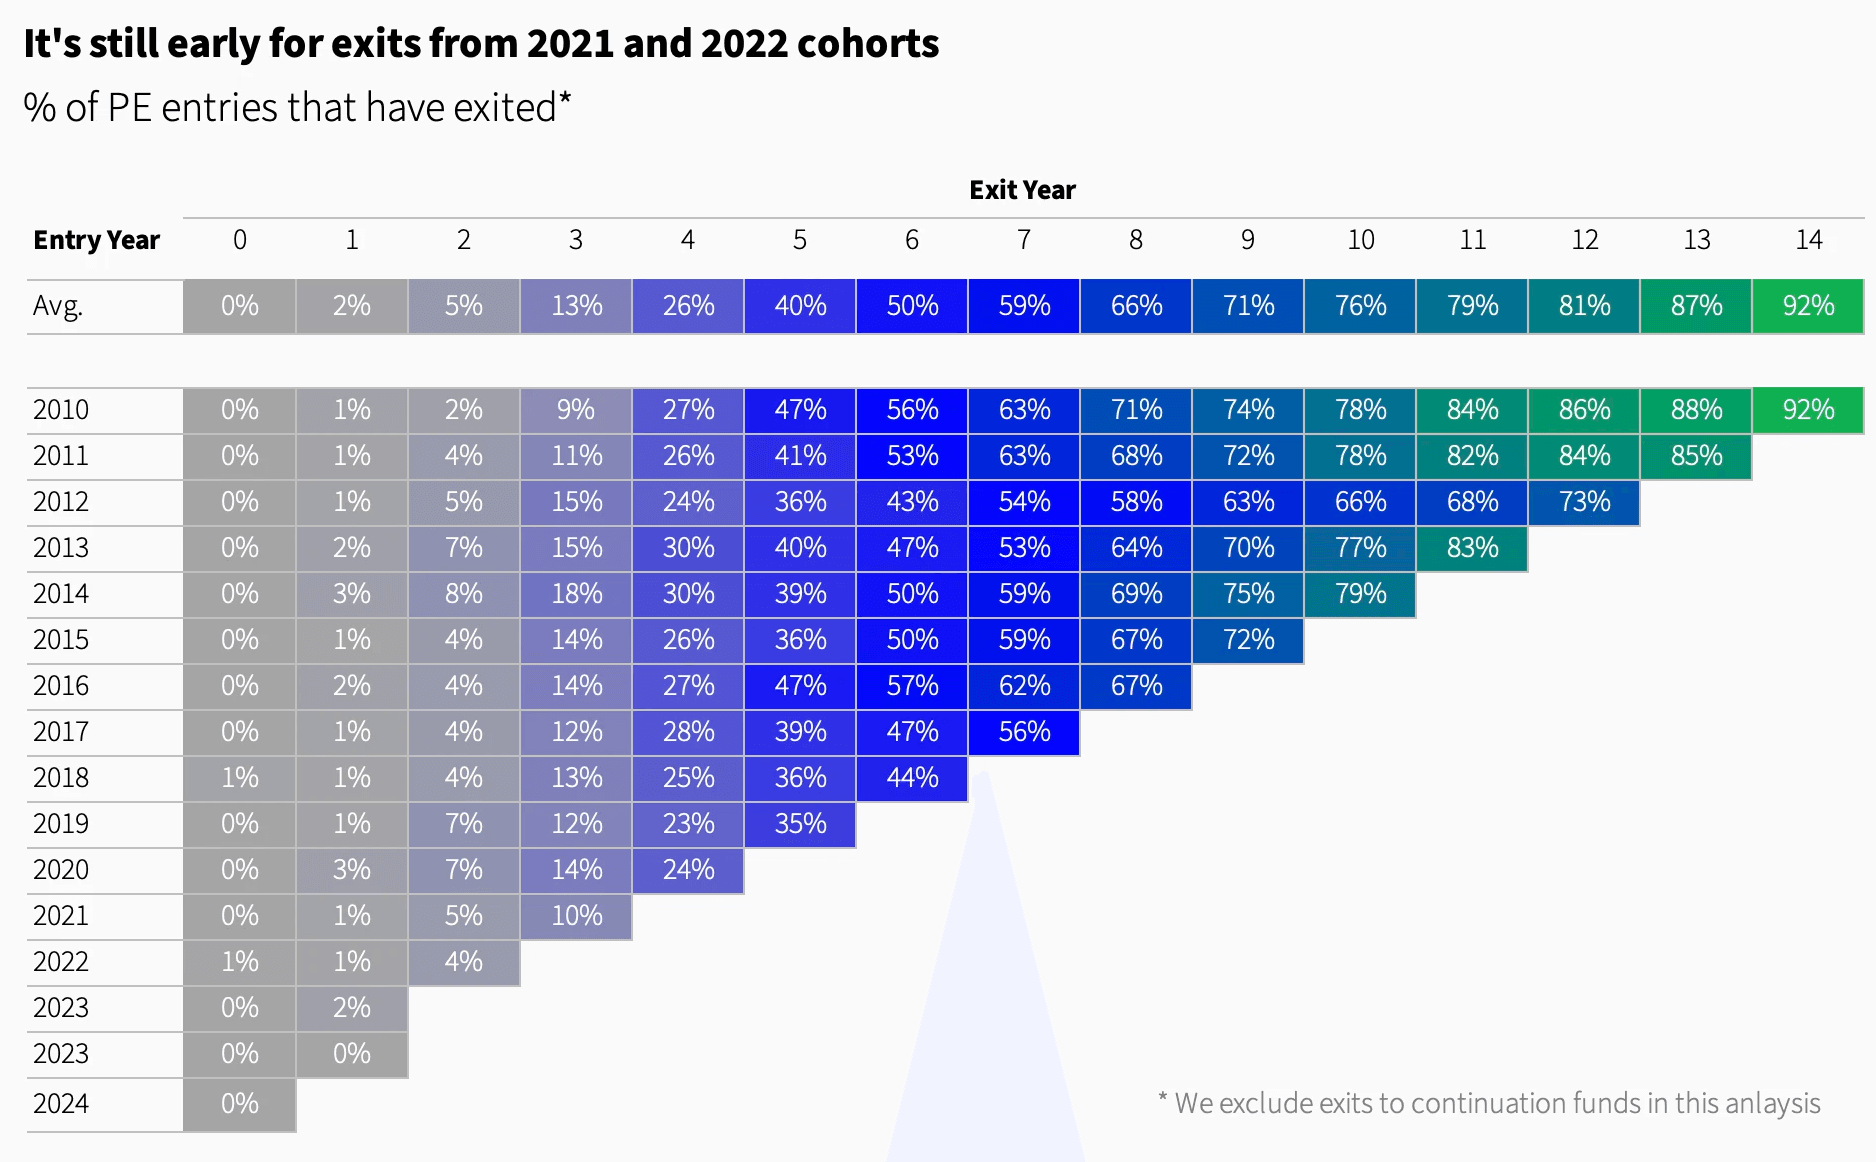
Typically, PE exits ramp up in year 4. 2025 and 2026 will be pivotal years to watch for PE exits from the high entry-valuation cohorts of 2021 and 2022.
Of all sectors, Consumer has the longest holding period. The sector has endured a challenging few years, marked by COVID-related disruption, slowing growth and cost inflation. More recently, it faces additional headwinds including from trade tariffs.
Exits by Deal Type
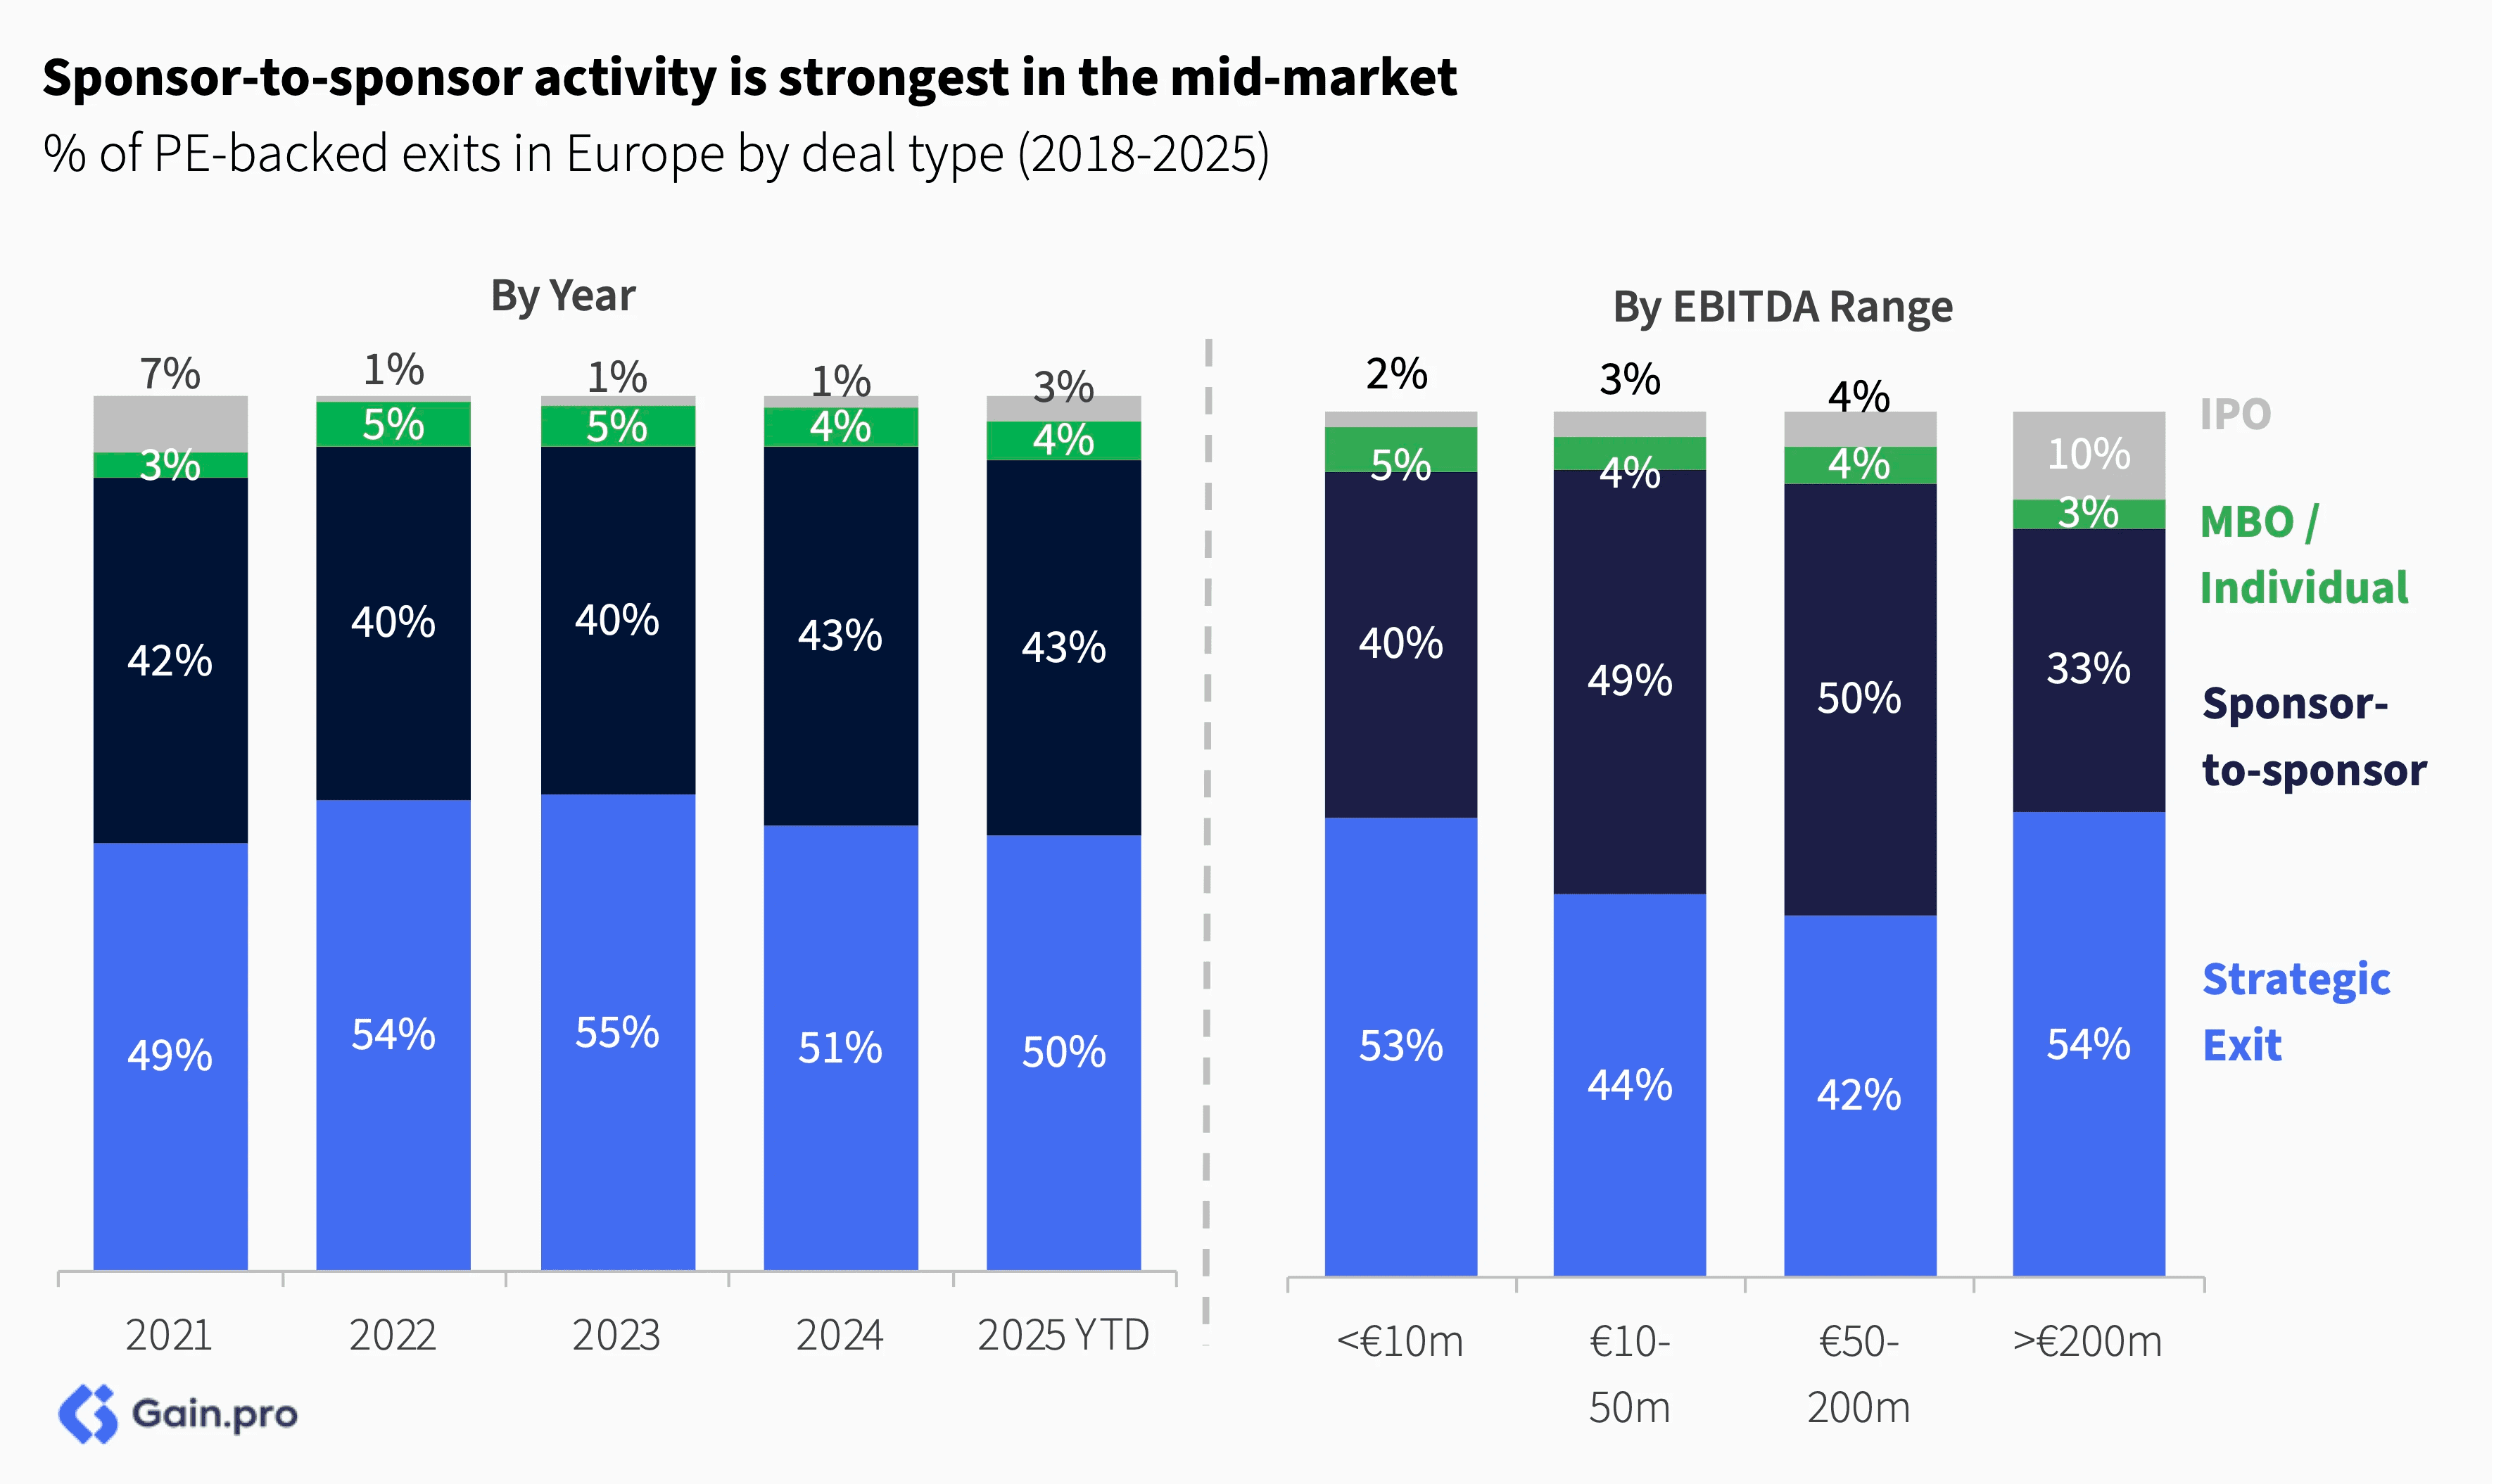
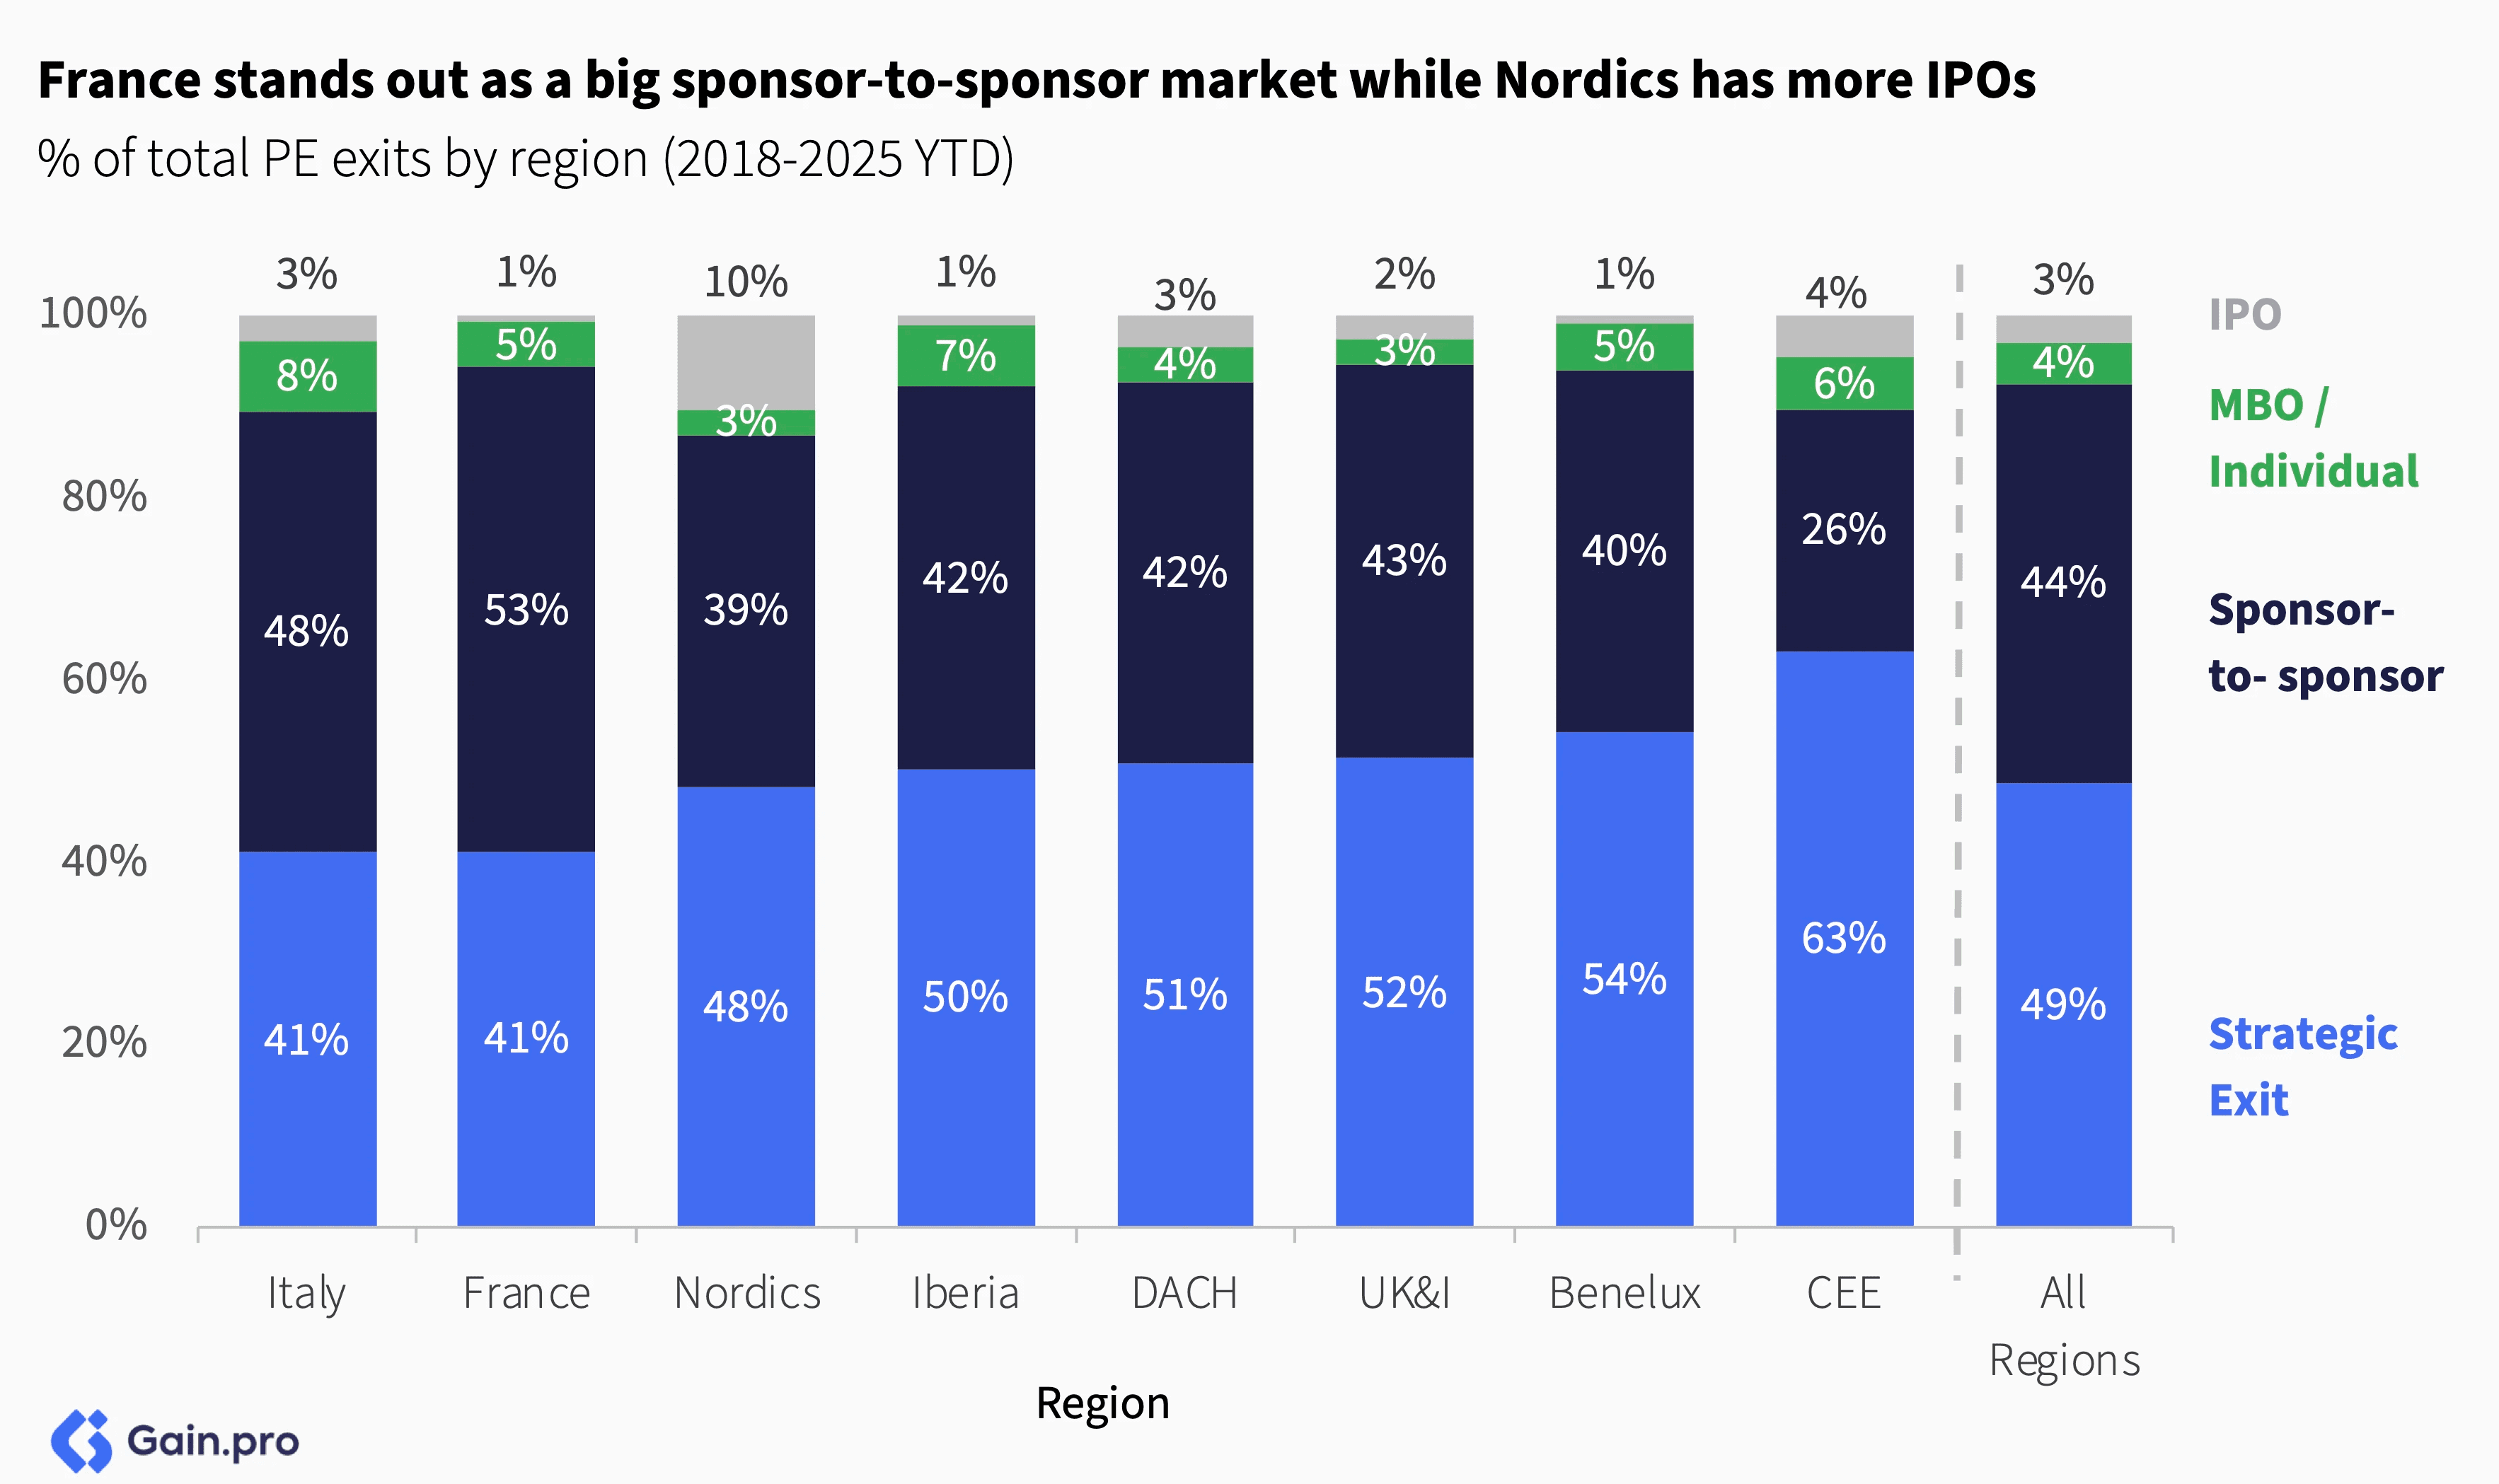
By deal type, strategic exits accounted for the largest share of exits (50%), followed by sponsor-to-sponsor transactions at 43%. Sponsor-to-sponsor deals dominate in the mid-market, while smaller (<€10m EBITDA) and larger (>€200m EBITDA) exits skew more toward strategic buyers. Larger assets, as expected, are also more likely to go the IPO route.
France stands out as a big sponsor-to-sponsor market. 53% of exits in France were sponsor-to-sponsor (vs. 44% for all regions). France has one of the highest PE penetration rates in Europe and the highest share of minority investors. As a result, it sees many investor-to-investor deals. The Nordics, on the other hand, lead Europe in terms of IPOs, driven by favorable listing regulations and a large tech ecosystem.
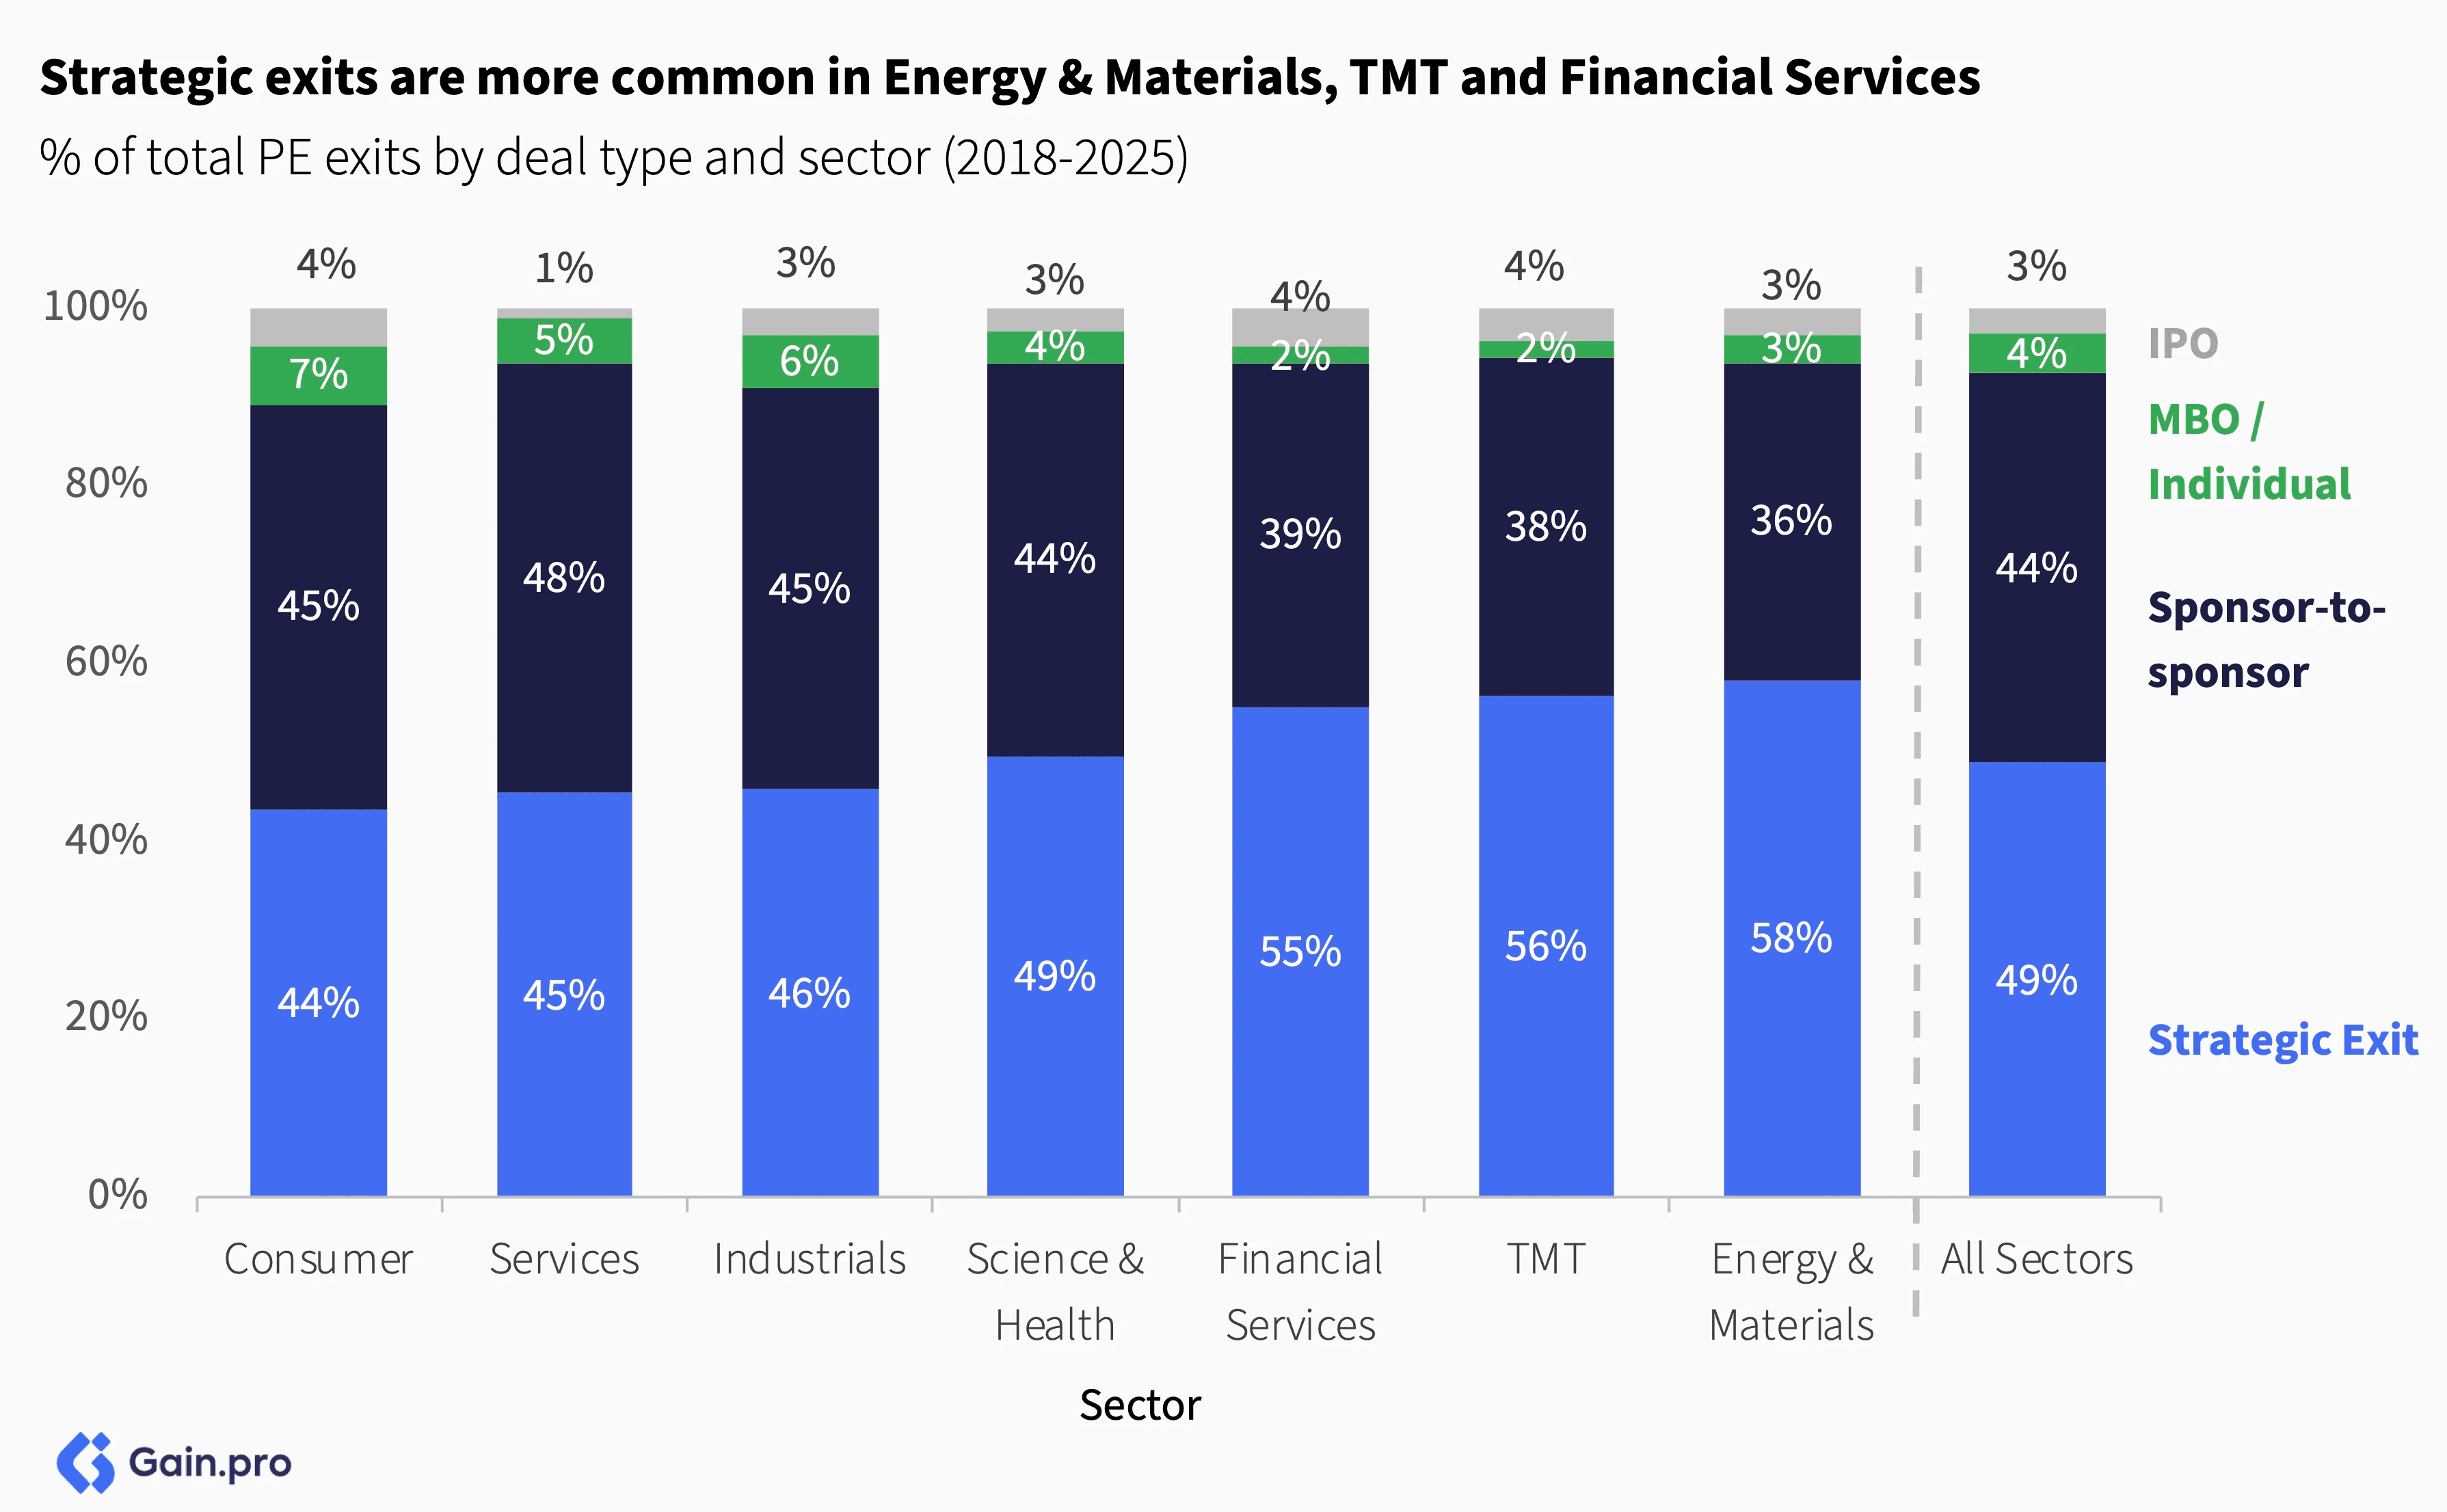
By sector, strategic exits are more common in Energy & Materials, TMT and Financial Services. In Energy & Materials, traditional energy companies are actively acquiring renewable and clean tech assets to support their energy transition strategies and meet ESG commitments. TMT sees strong strategic buyer interest from tech giants seeking to acquire fast-growing innovative businesses. Financial institutions, on the other hand, pursue strategic acquisitions for market and AUM expansion.
Chapter 04: Multiples
Overall Trend
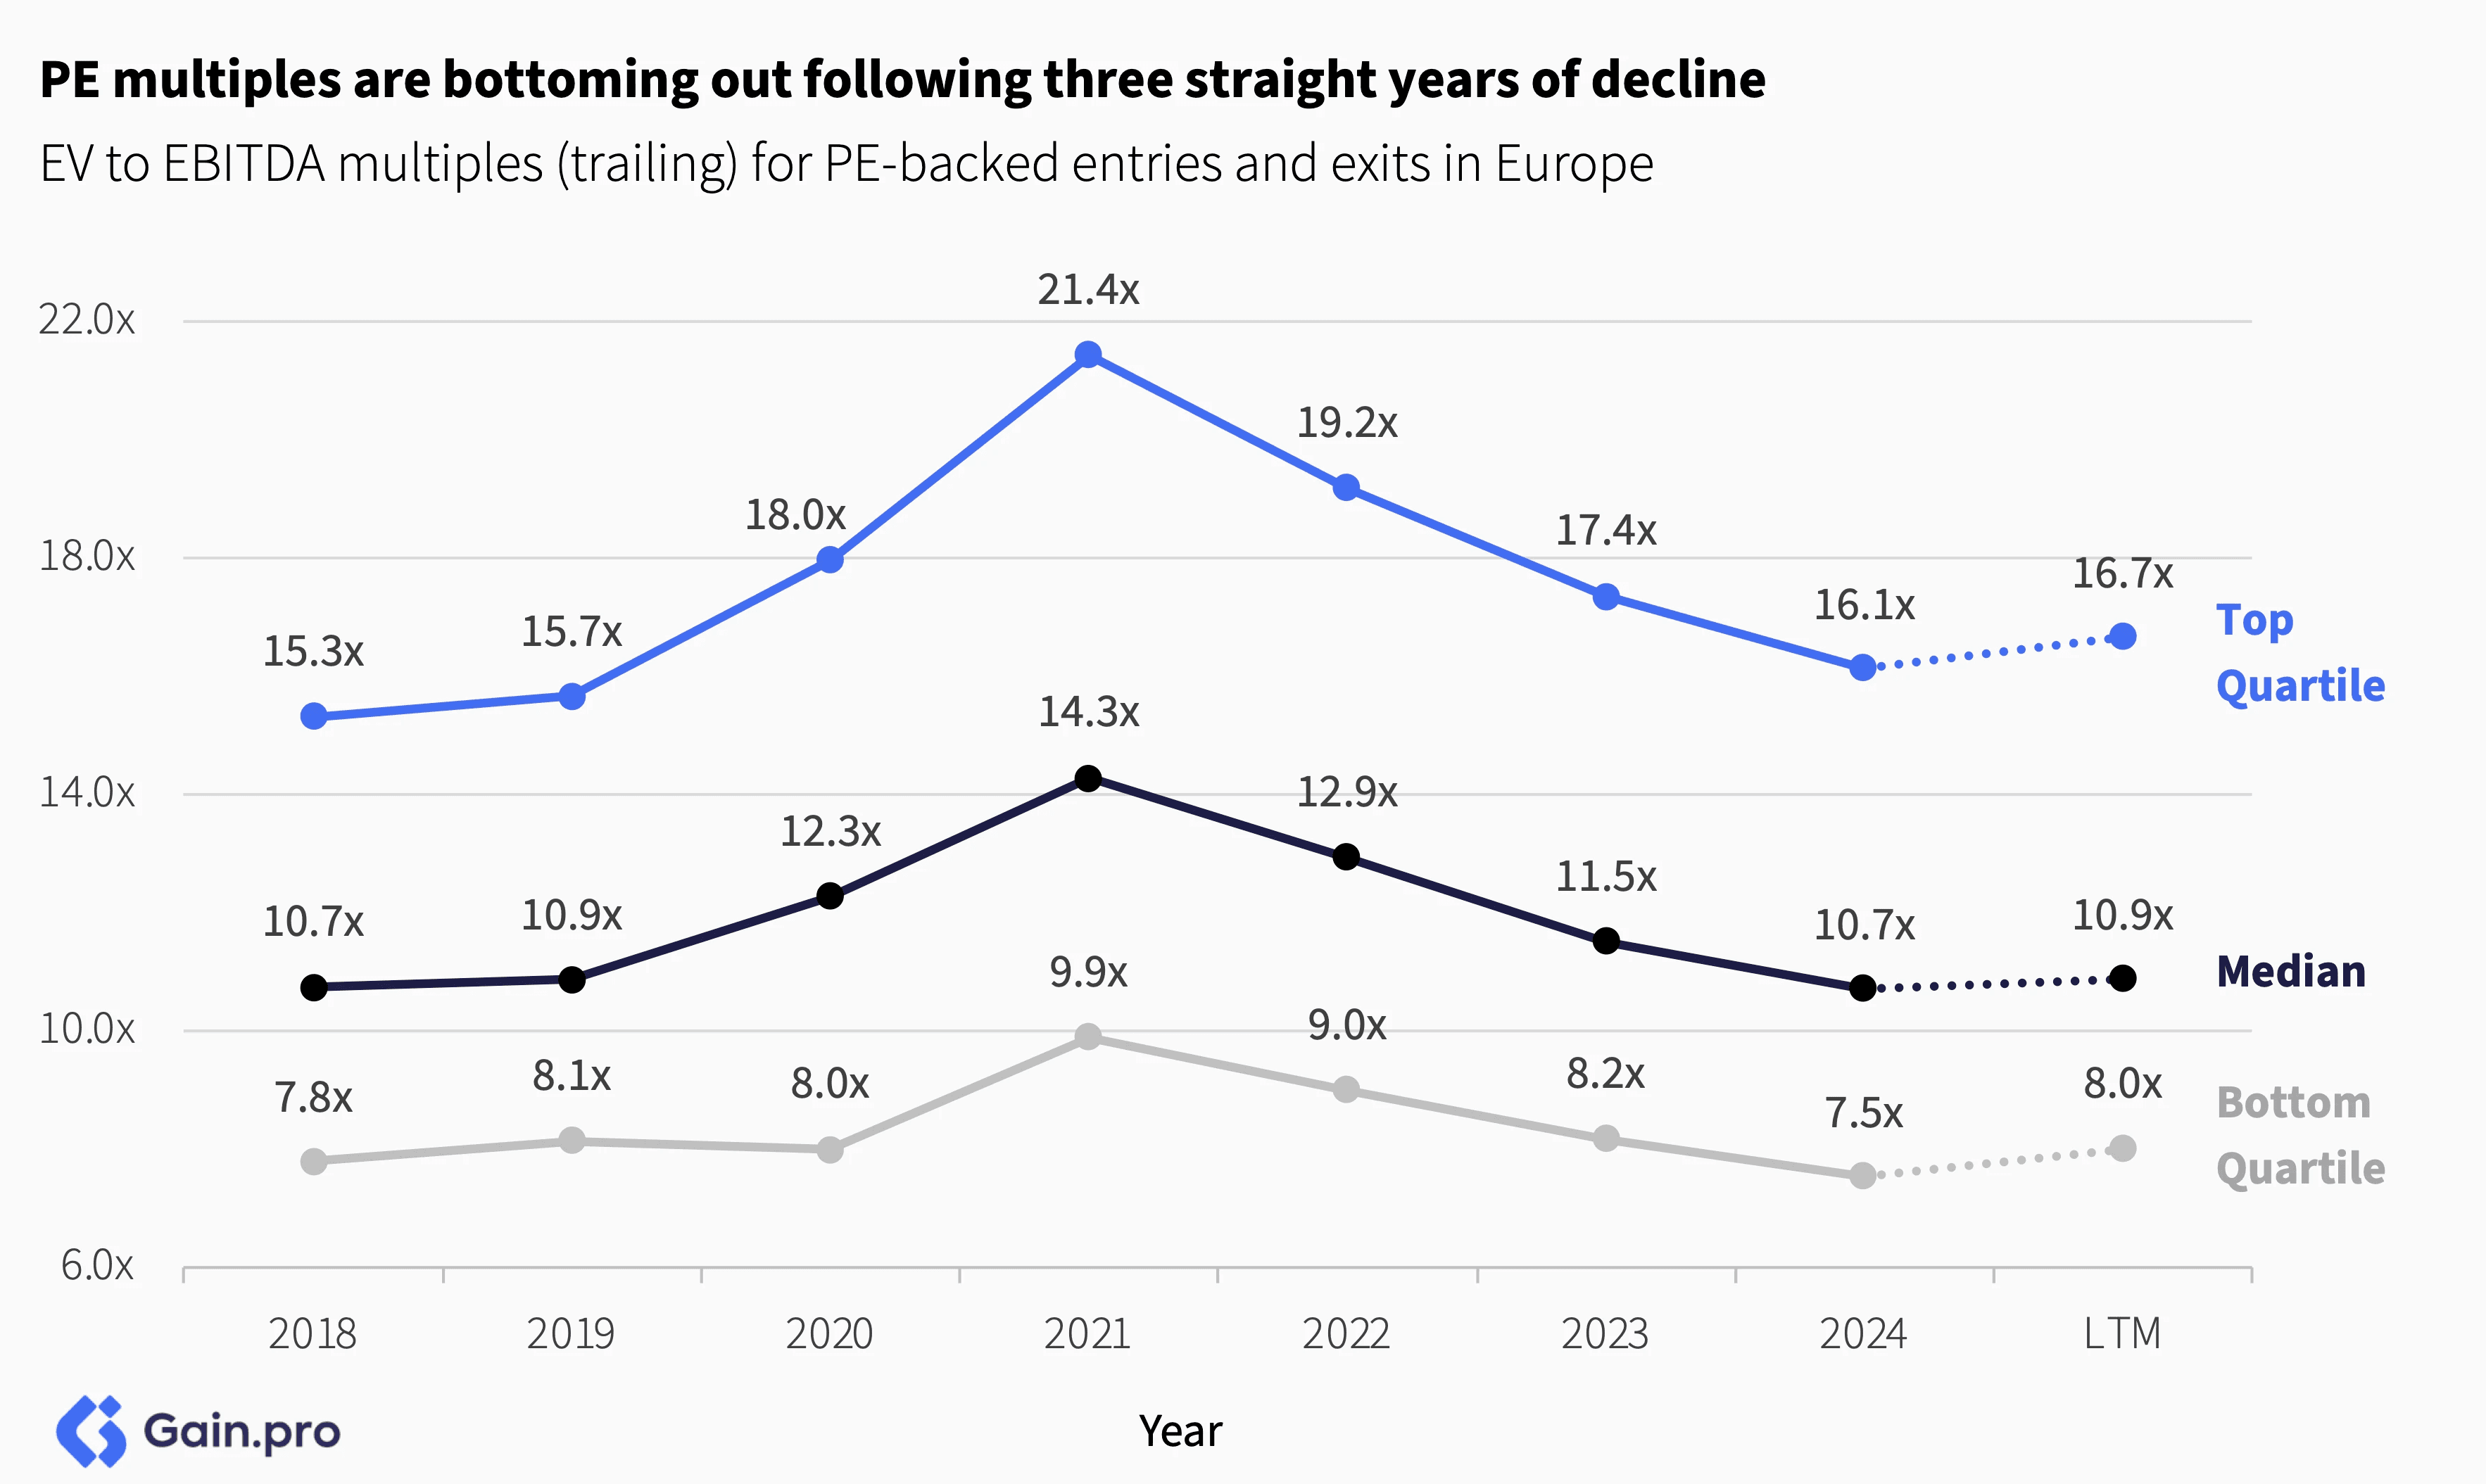
Multiples are showing early signs of recovery in 2025 after three consecutive years of decline. The rebound is supported by improving financing conditions and renewed investor confidence despite macro and trade uncertainty. Looking ahead, we expect multiples to stabilize from here on as we stay in this higher interest rate environment for longer.
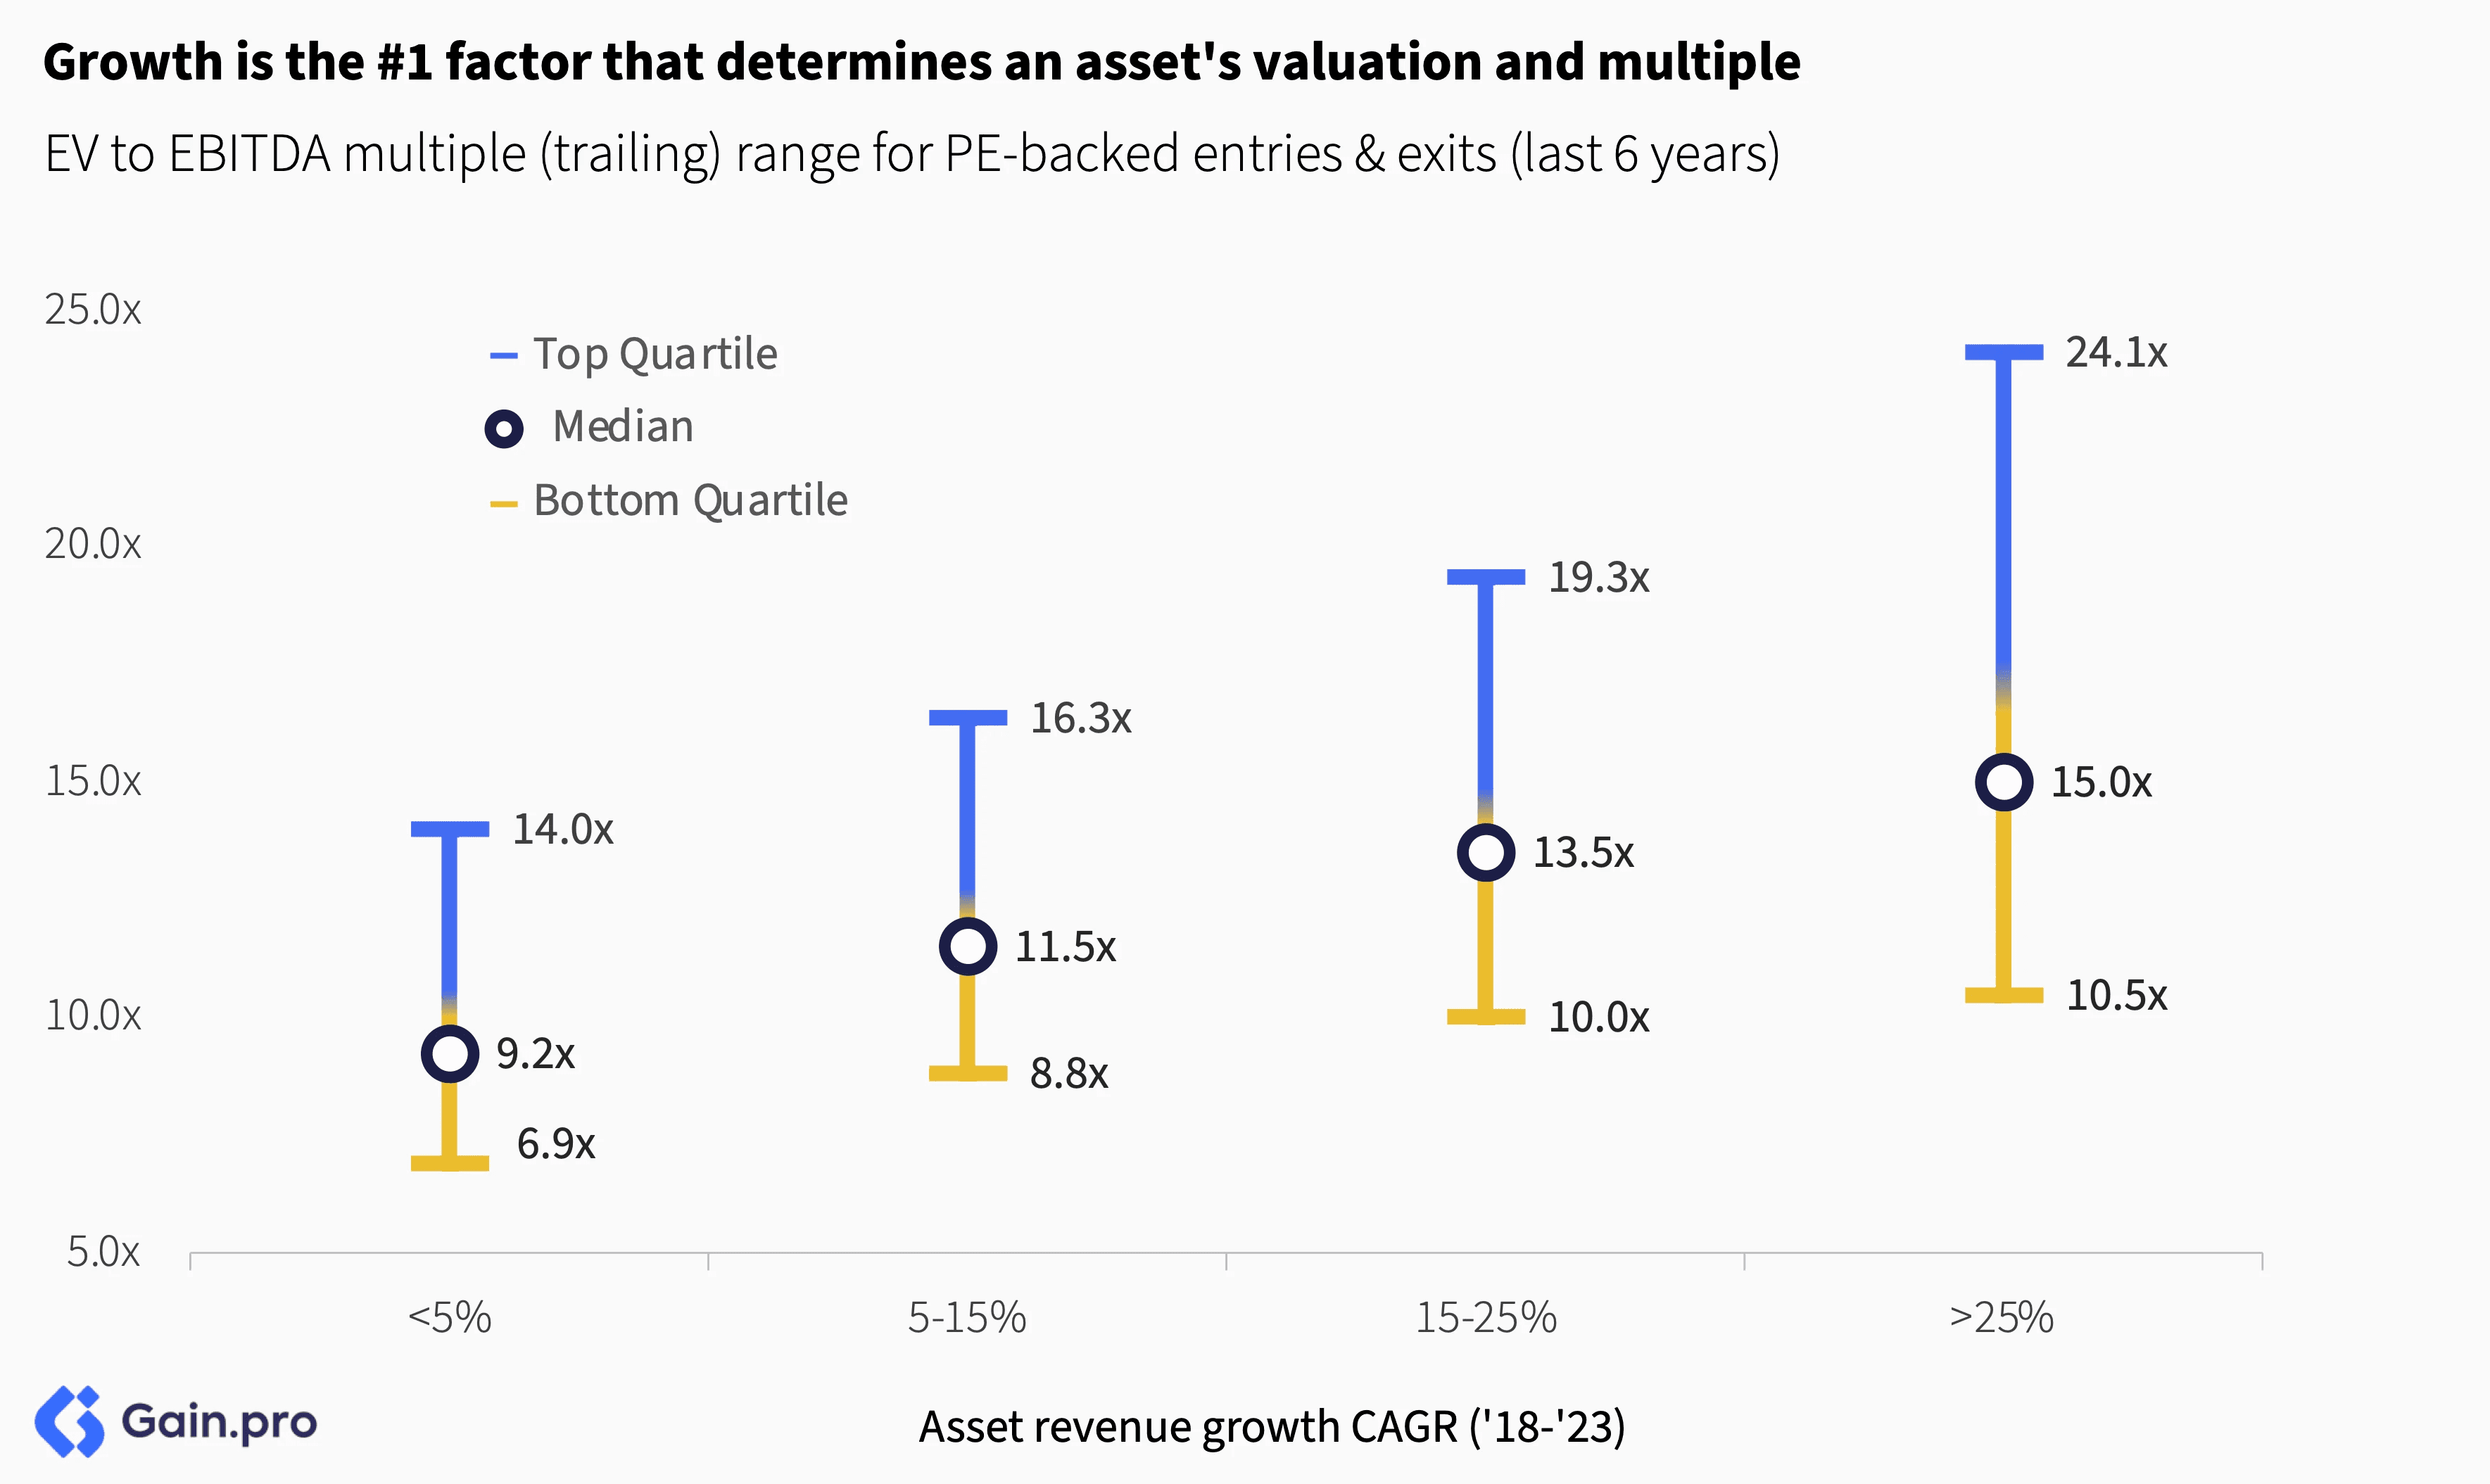
Growth remains the #1 factor for an asset's valuation and multiple. Assets that grow faster (>25% revenue CAGR) sell at ~50% premium to those that grow slower (<5% revenue CAGR).
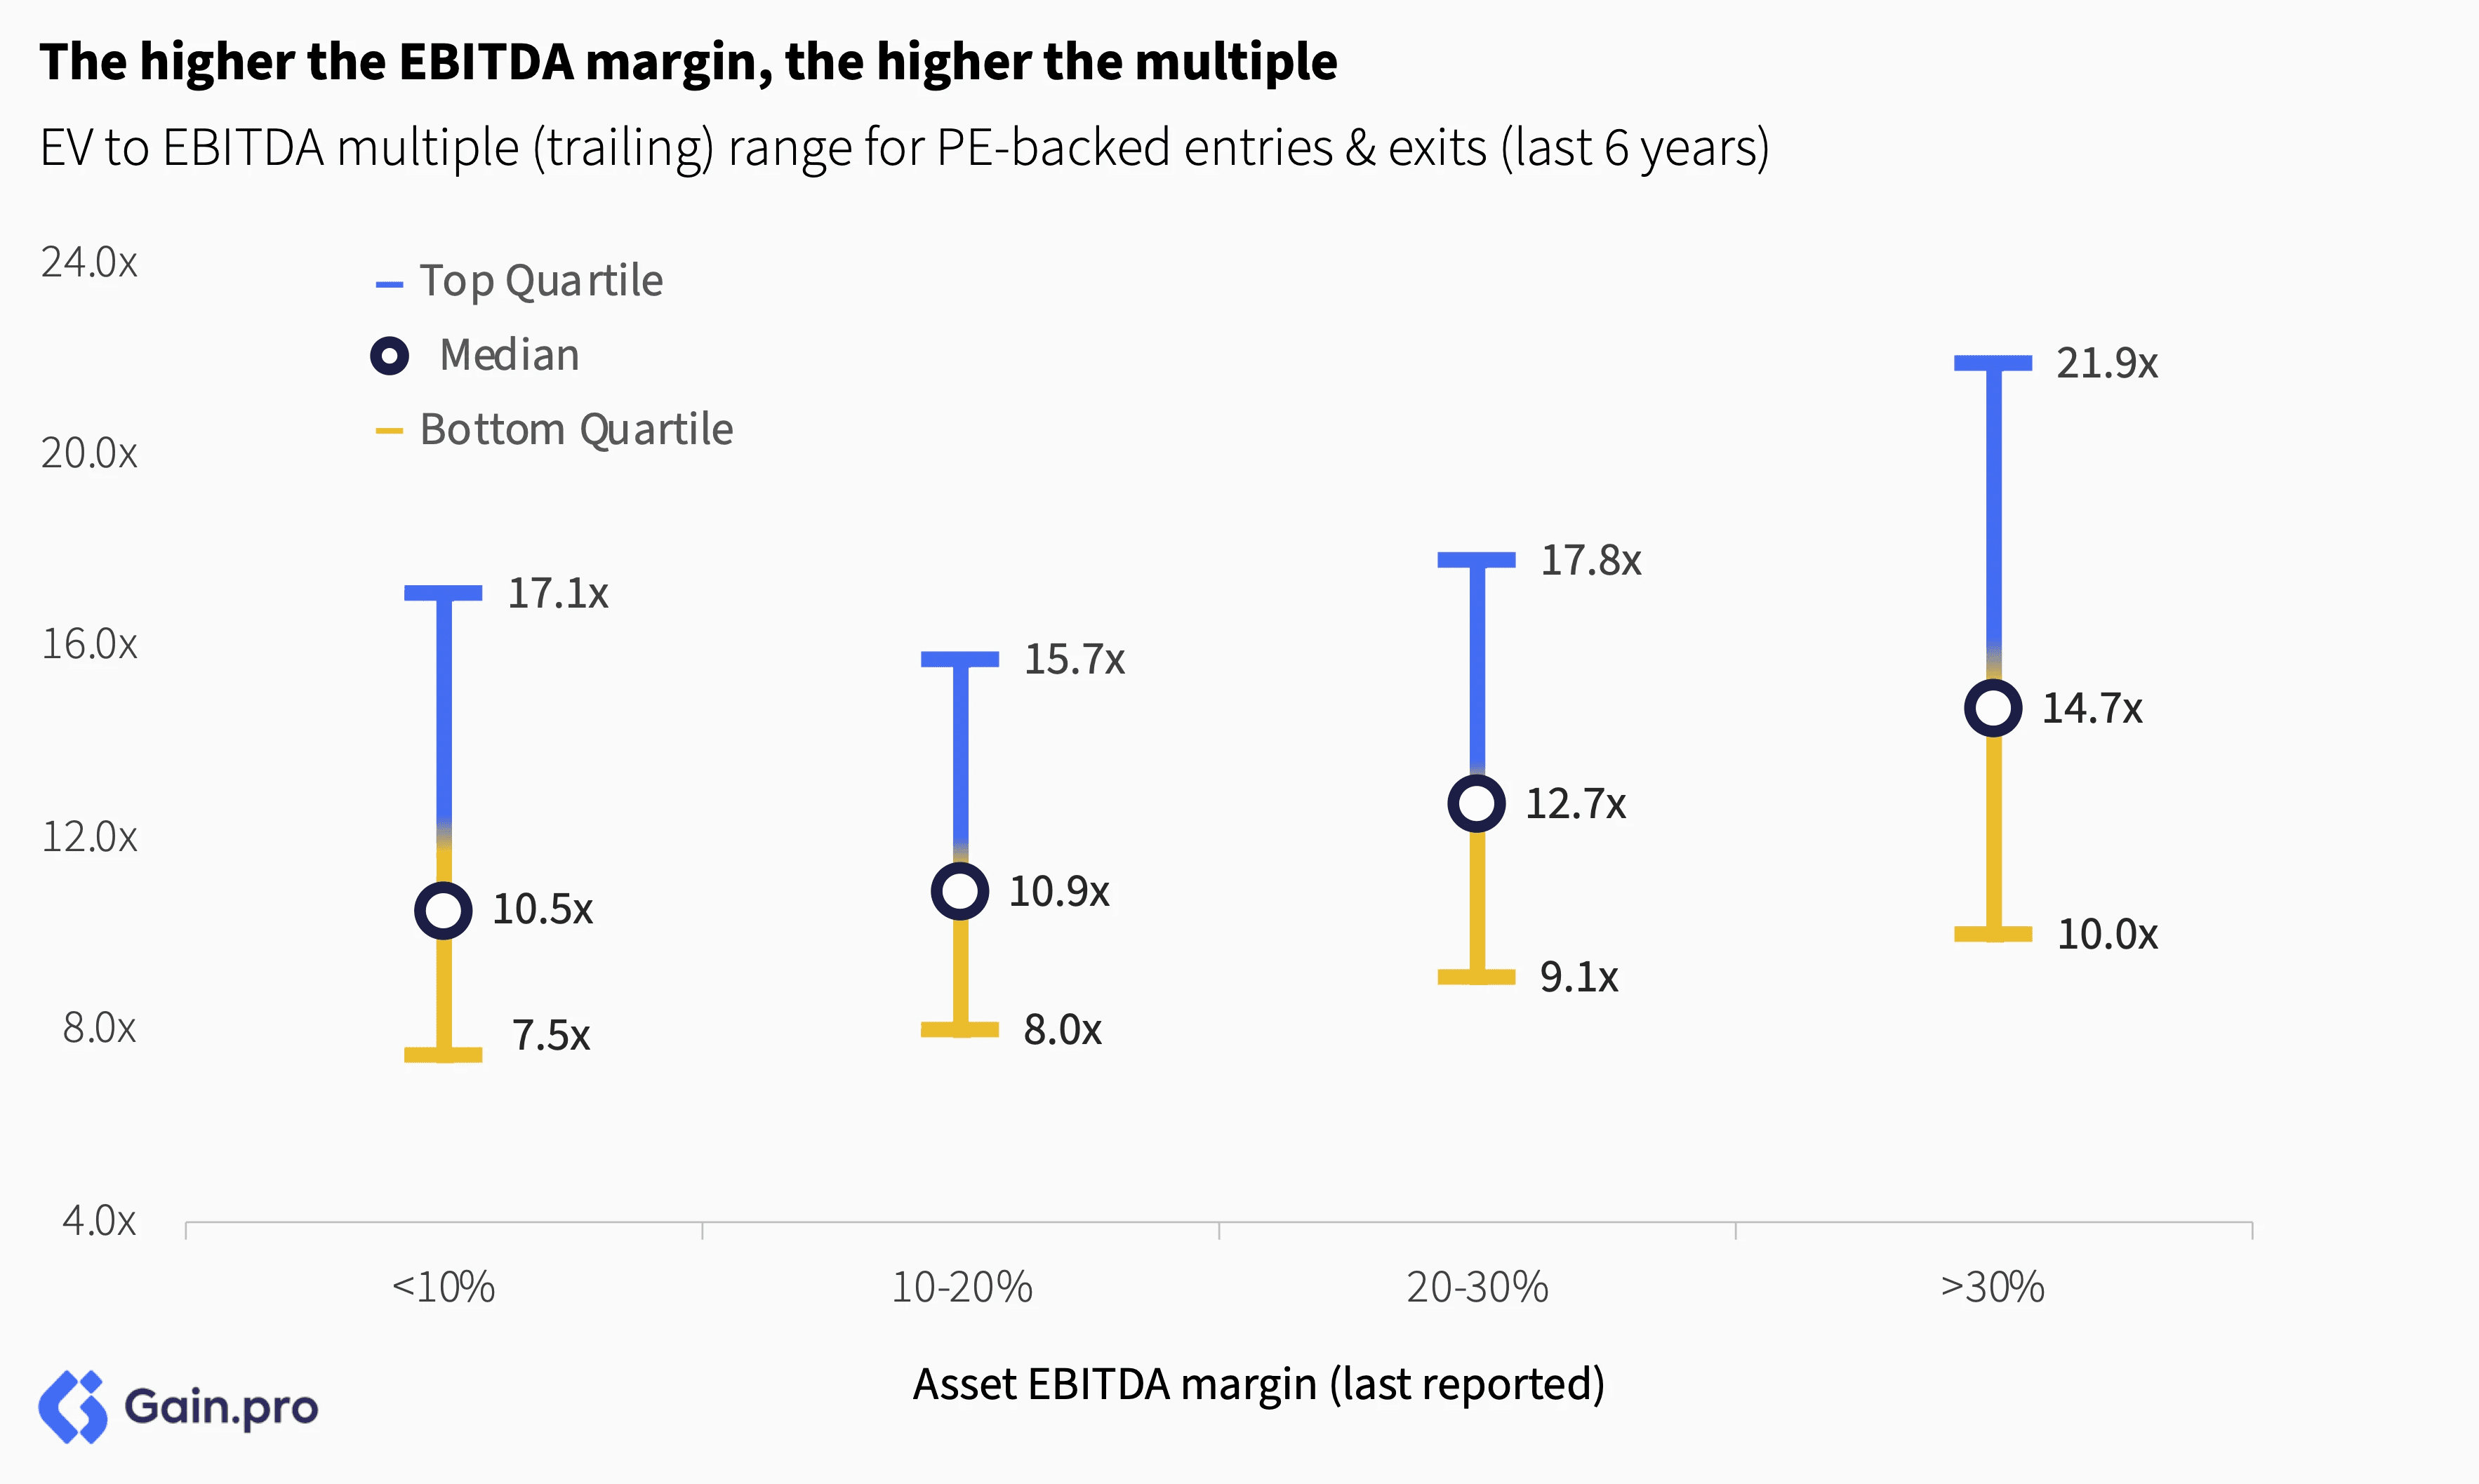
Multiples increase with the company’s profitability. Investors readily pay a premium for businesses that are high quality and resilient. High operational efficiency and strong cash flows also de-risk the transaction for the buyer.
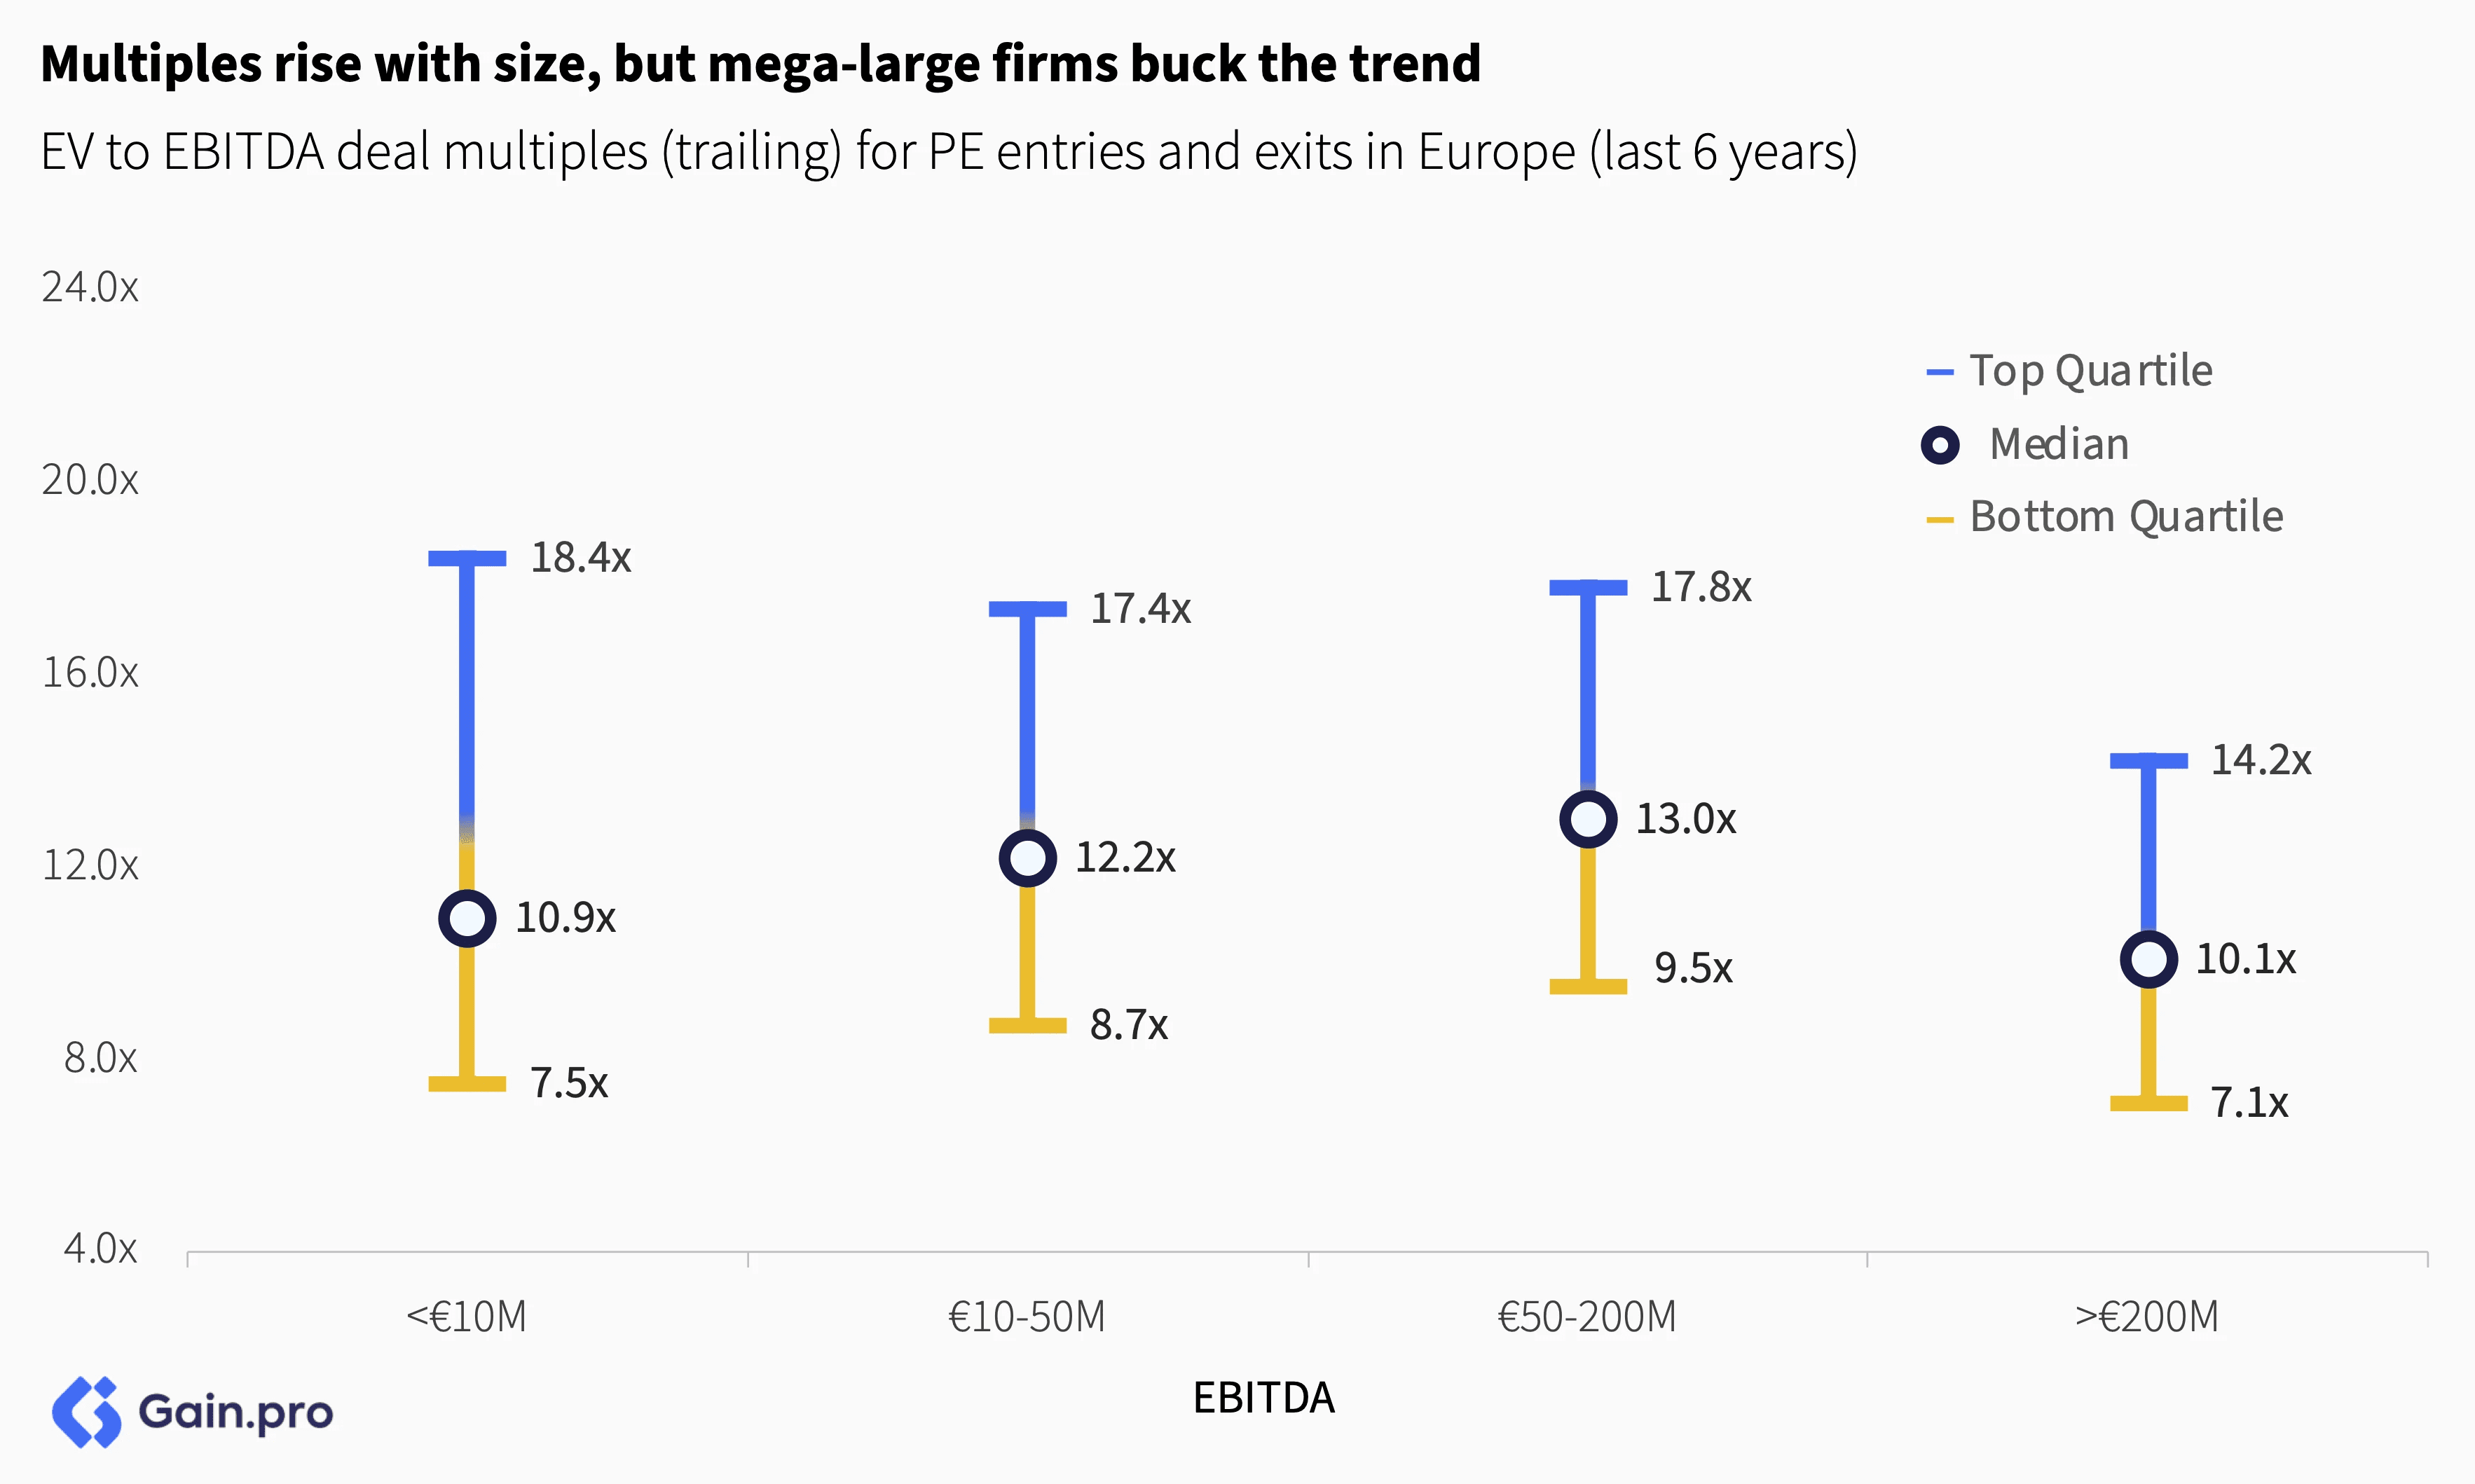
Multiples rise with size, but mega-large firms buck the trend. This exception is largely due to the high concentration of lower-growth assets among firms with EBITDA over €200 million.
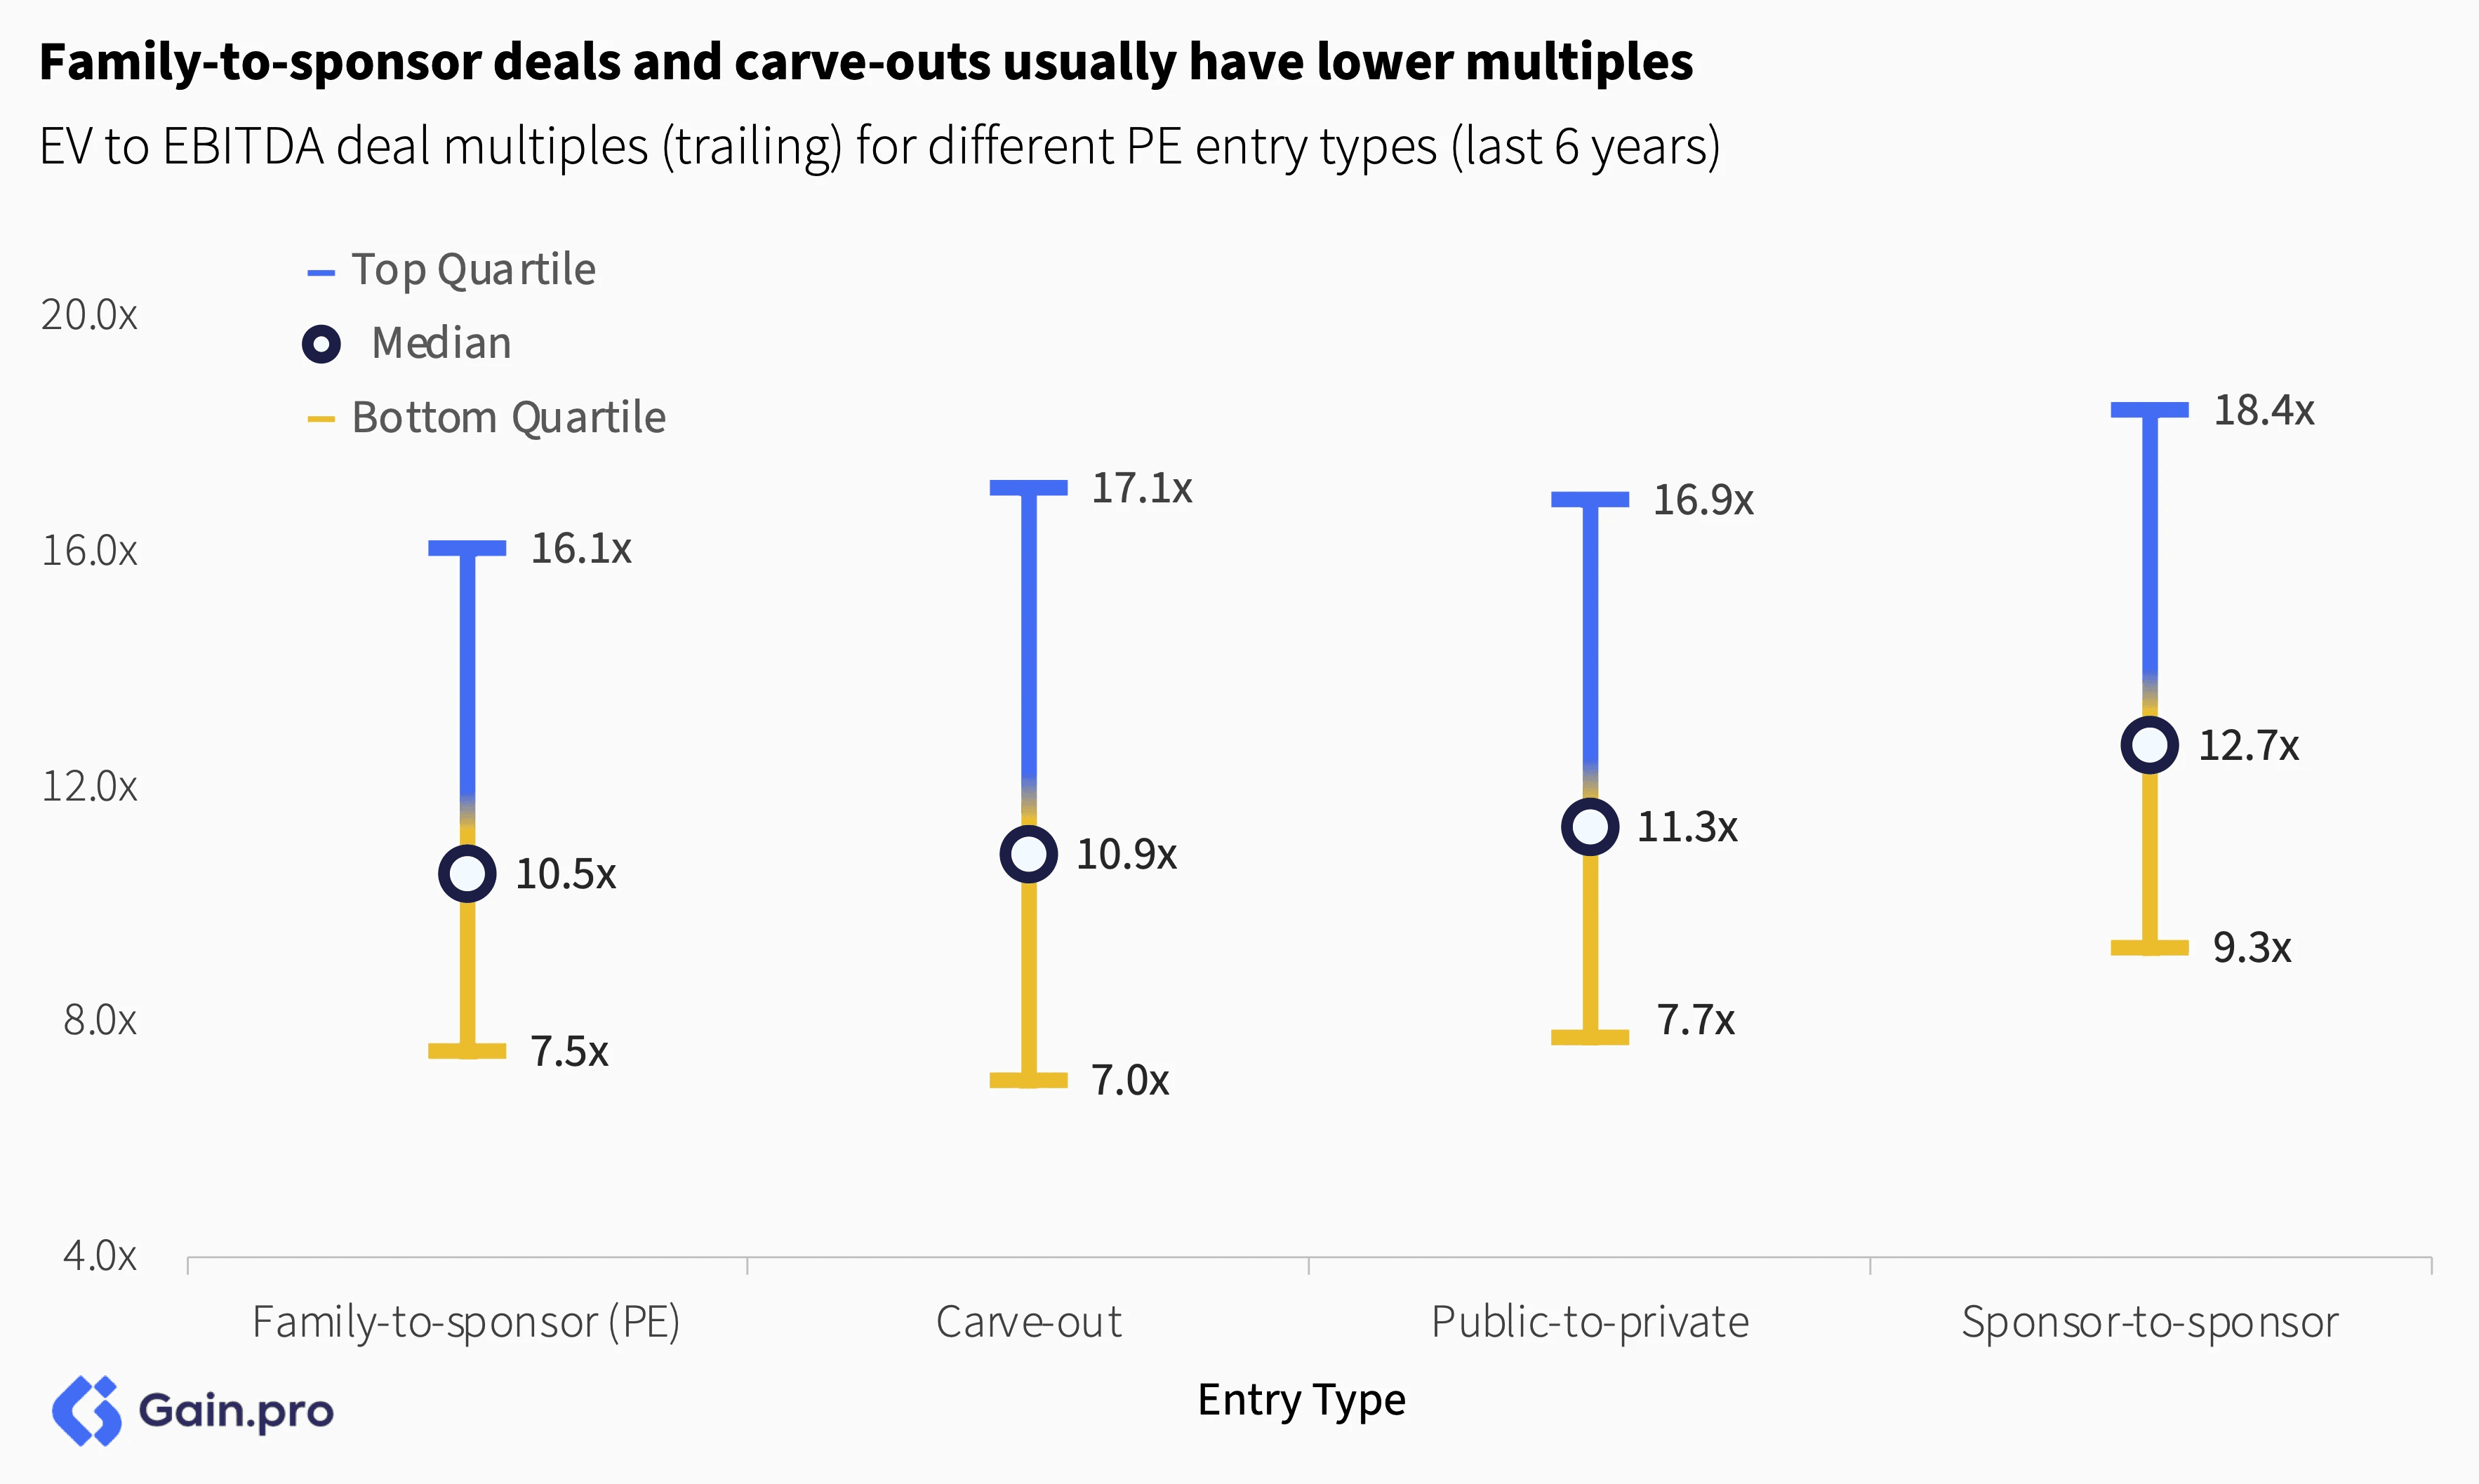
By entry type, family-to-sponsor deals have the lowest multiples. These businesses are often younger and aren’t yet operating at scale. Carve-outs also tend to have lower multiples, as they tend to be underperforming and need investment to build up all support functions post-acquisition. In contrast, multiples are highest in the sponsor-to-sponsor market, often driven by competitive dynamics and streamlined processes.
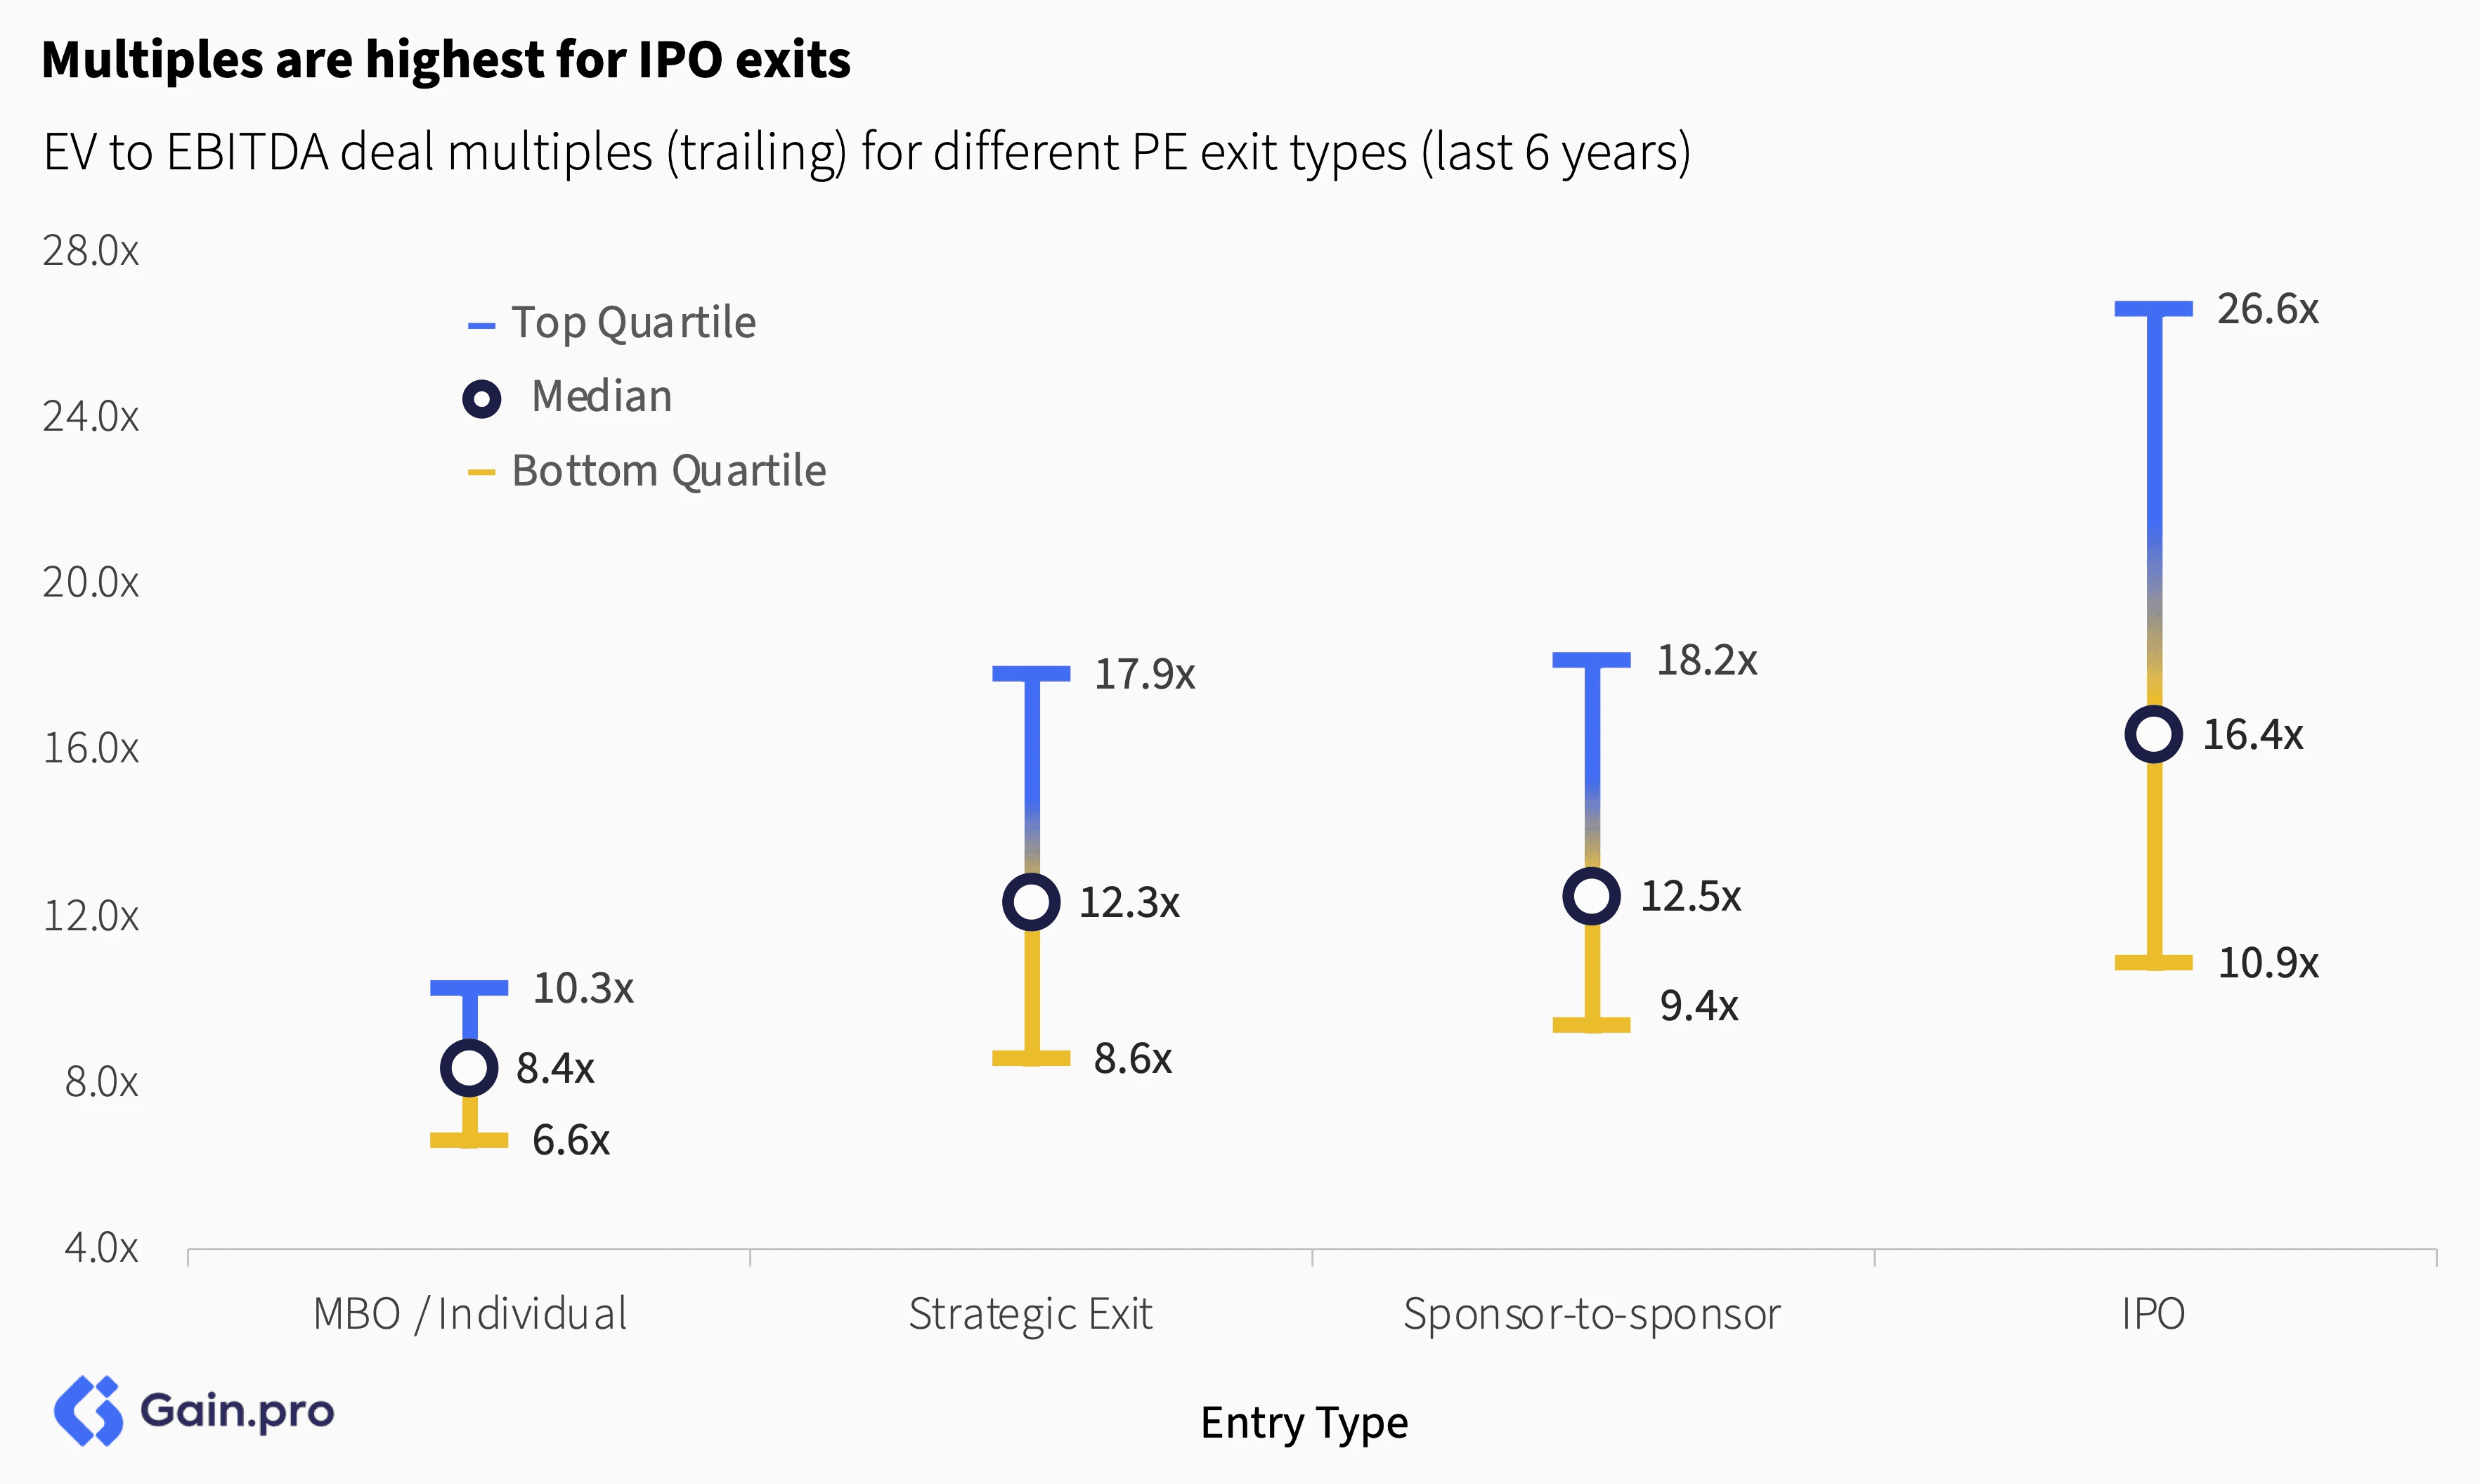
Multiples are highest for IPO exits and lowest for MBOs. IPOs command stronger valuations due to higher demand for faster-growing assets and interest from a broad investor base. The downside of IPOs, however, is that exits are rarely clean — PE sponsors typically cannot sell their full stake immediately and remain exposed to ongoing share price volatility. MBOs, on the other hand, typically trade at lower multiples due to limited competitive bidding, management's financing constraints and the smaller scale of these deals.
By Sector and Region
TMT and Science & Health continue to command a healthy valuation premium over other sectors, supported by strong growth, attractive margins and greater resilience. In contrast, sectors such as Industrials, Energy & Materials and Consumer trade at significantly lower multiples, reflecting slower growth profiles, asset-heavy operations and the more cyclical nature of earnings.
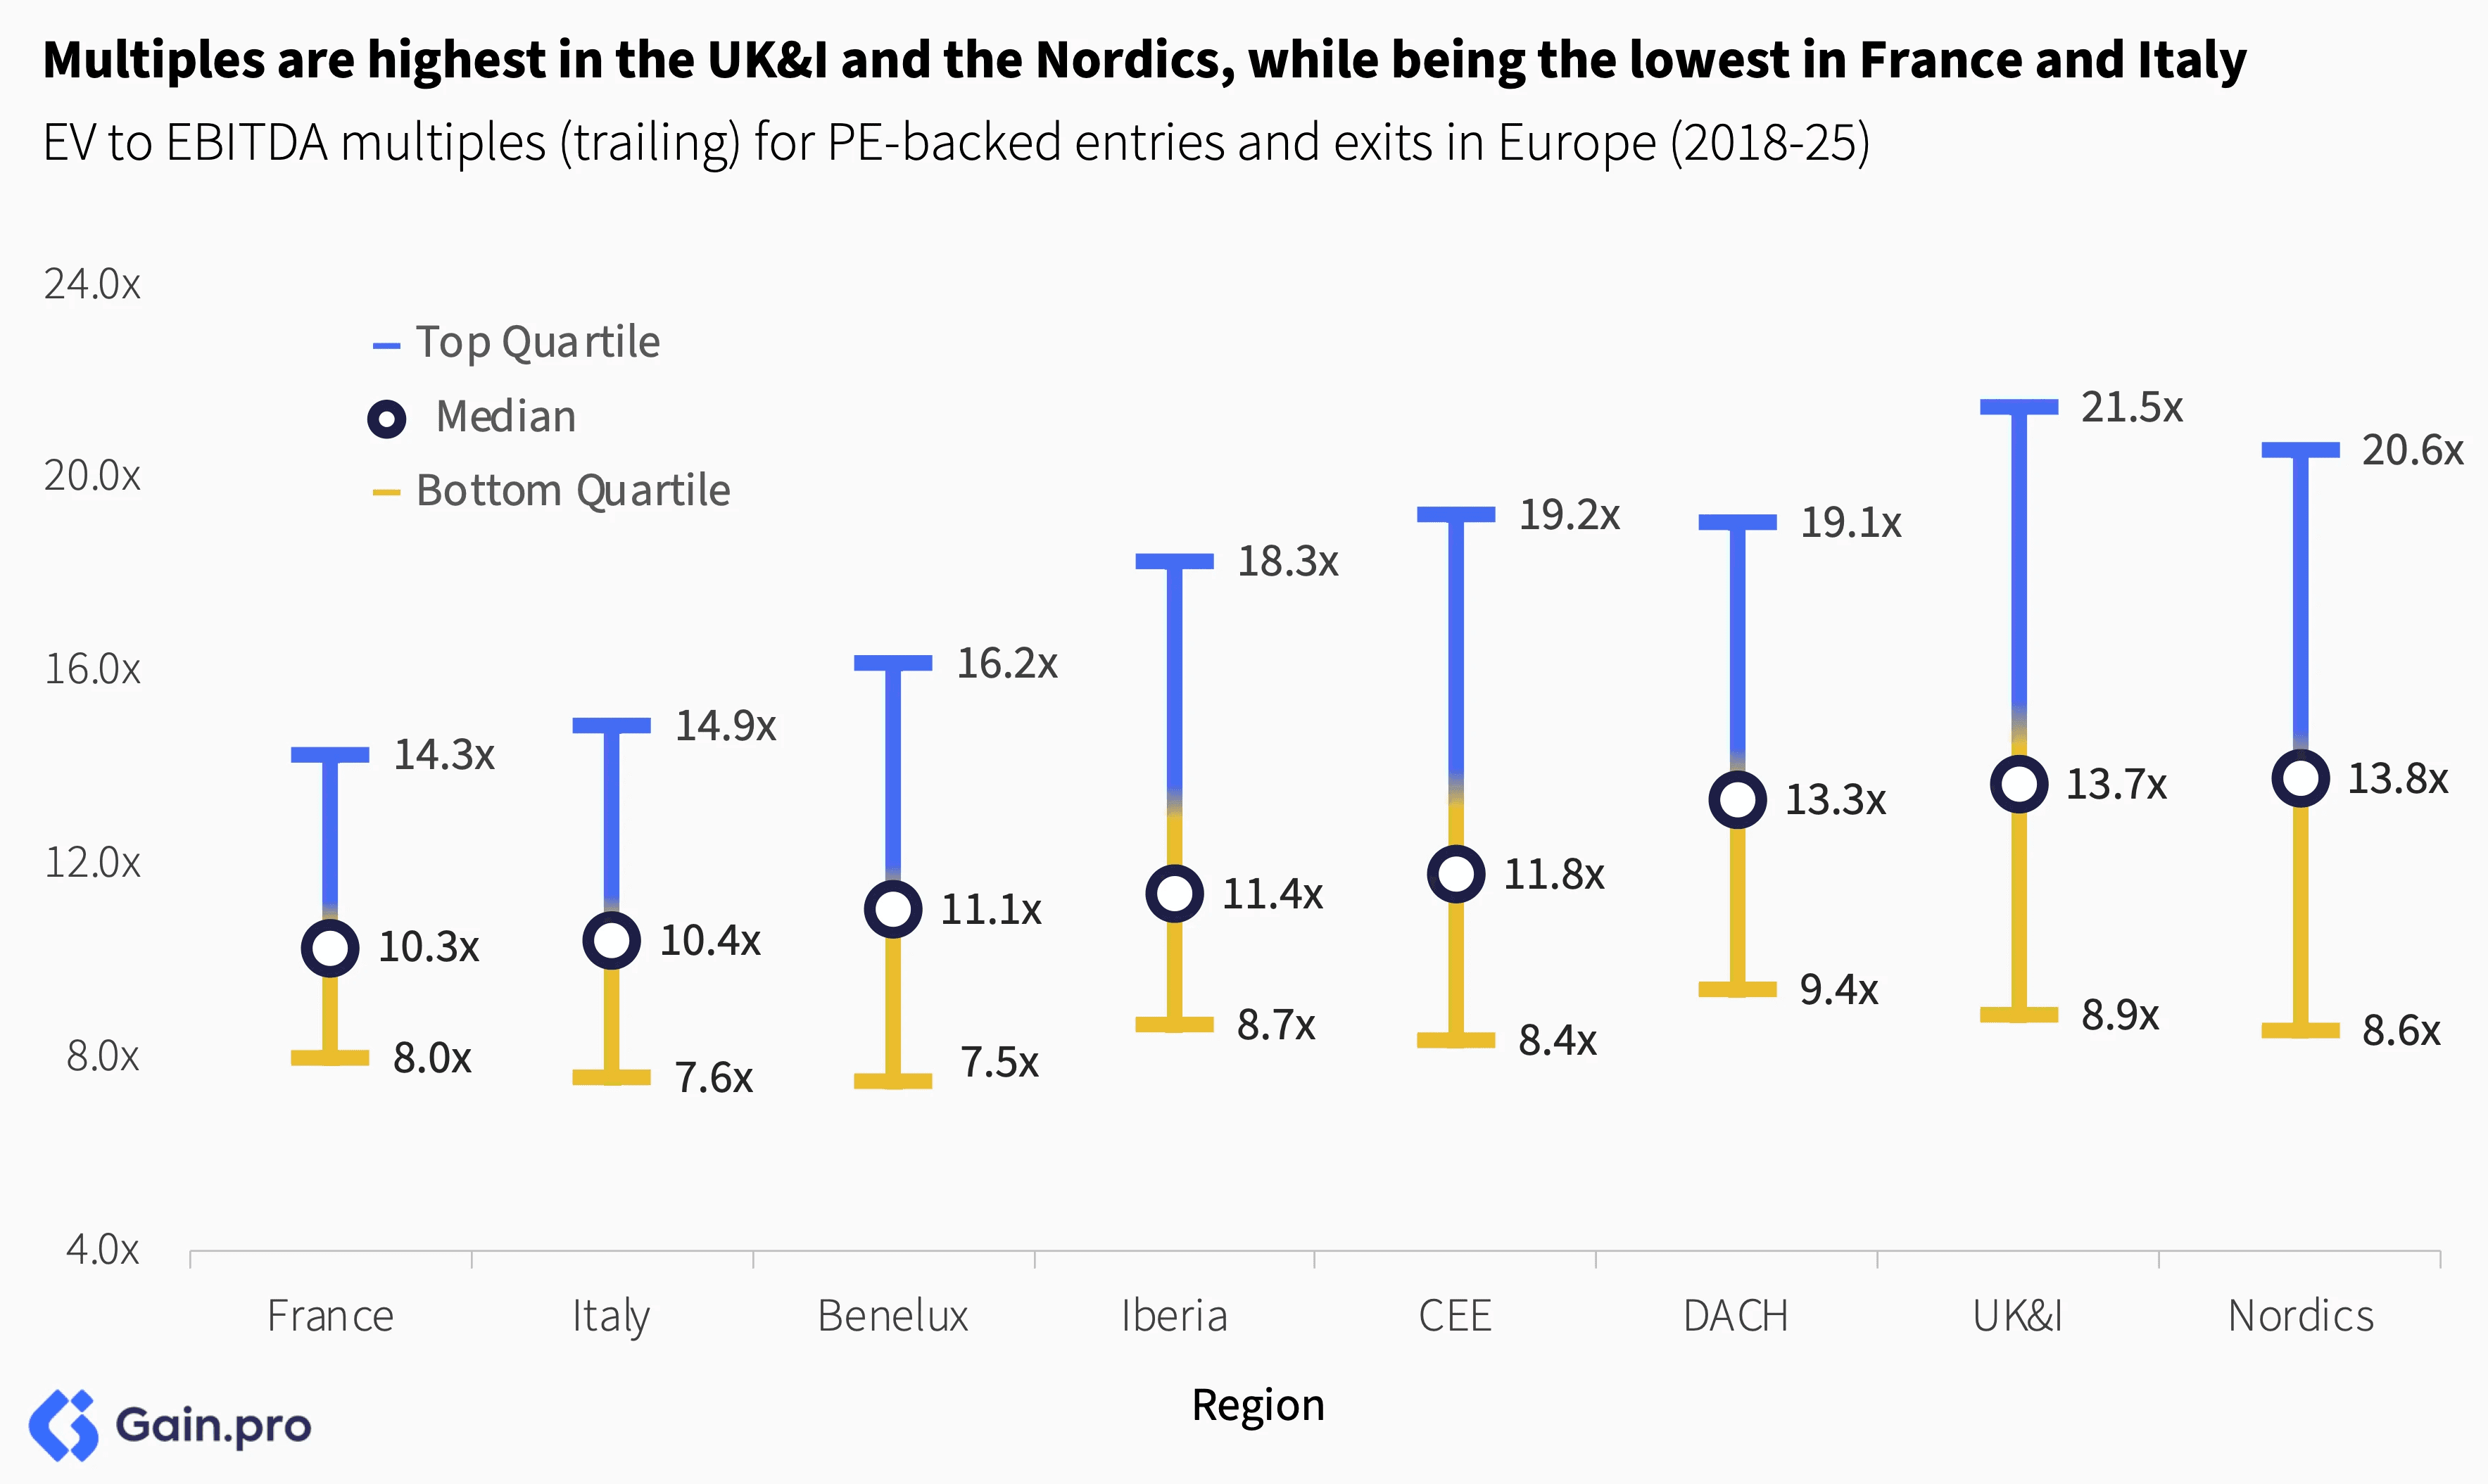
Multiples are highest in the UK & Ireland and the Nordics. The UK&I stands out as one of the most mature and competitive PE markets, attracting strong participation from both local and international investors. In the Nordics, higher valuations are supported by a strong bias toward Services and TMT, sectors with scalable platforms and resilient growth. In Benelux, Italy and France, multiples are lower. This reflects several factors including higher concentration in slower-growing Industrials and Consumer sectors, as well as more value-conscious domestic buyer-focused markets.
Chapter 05: Portfolio Stats
PE Penetration and Employment
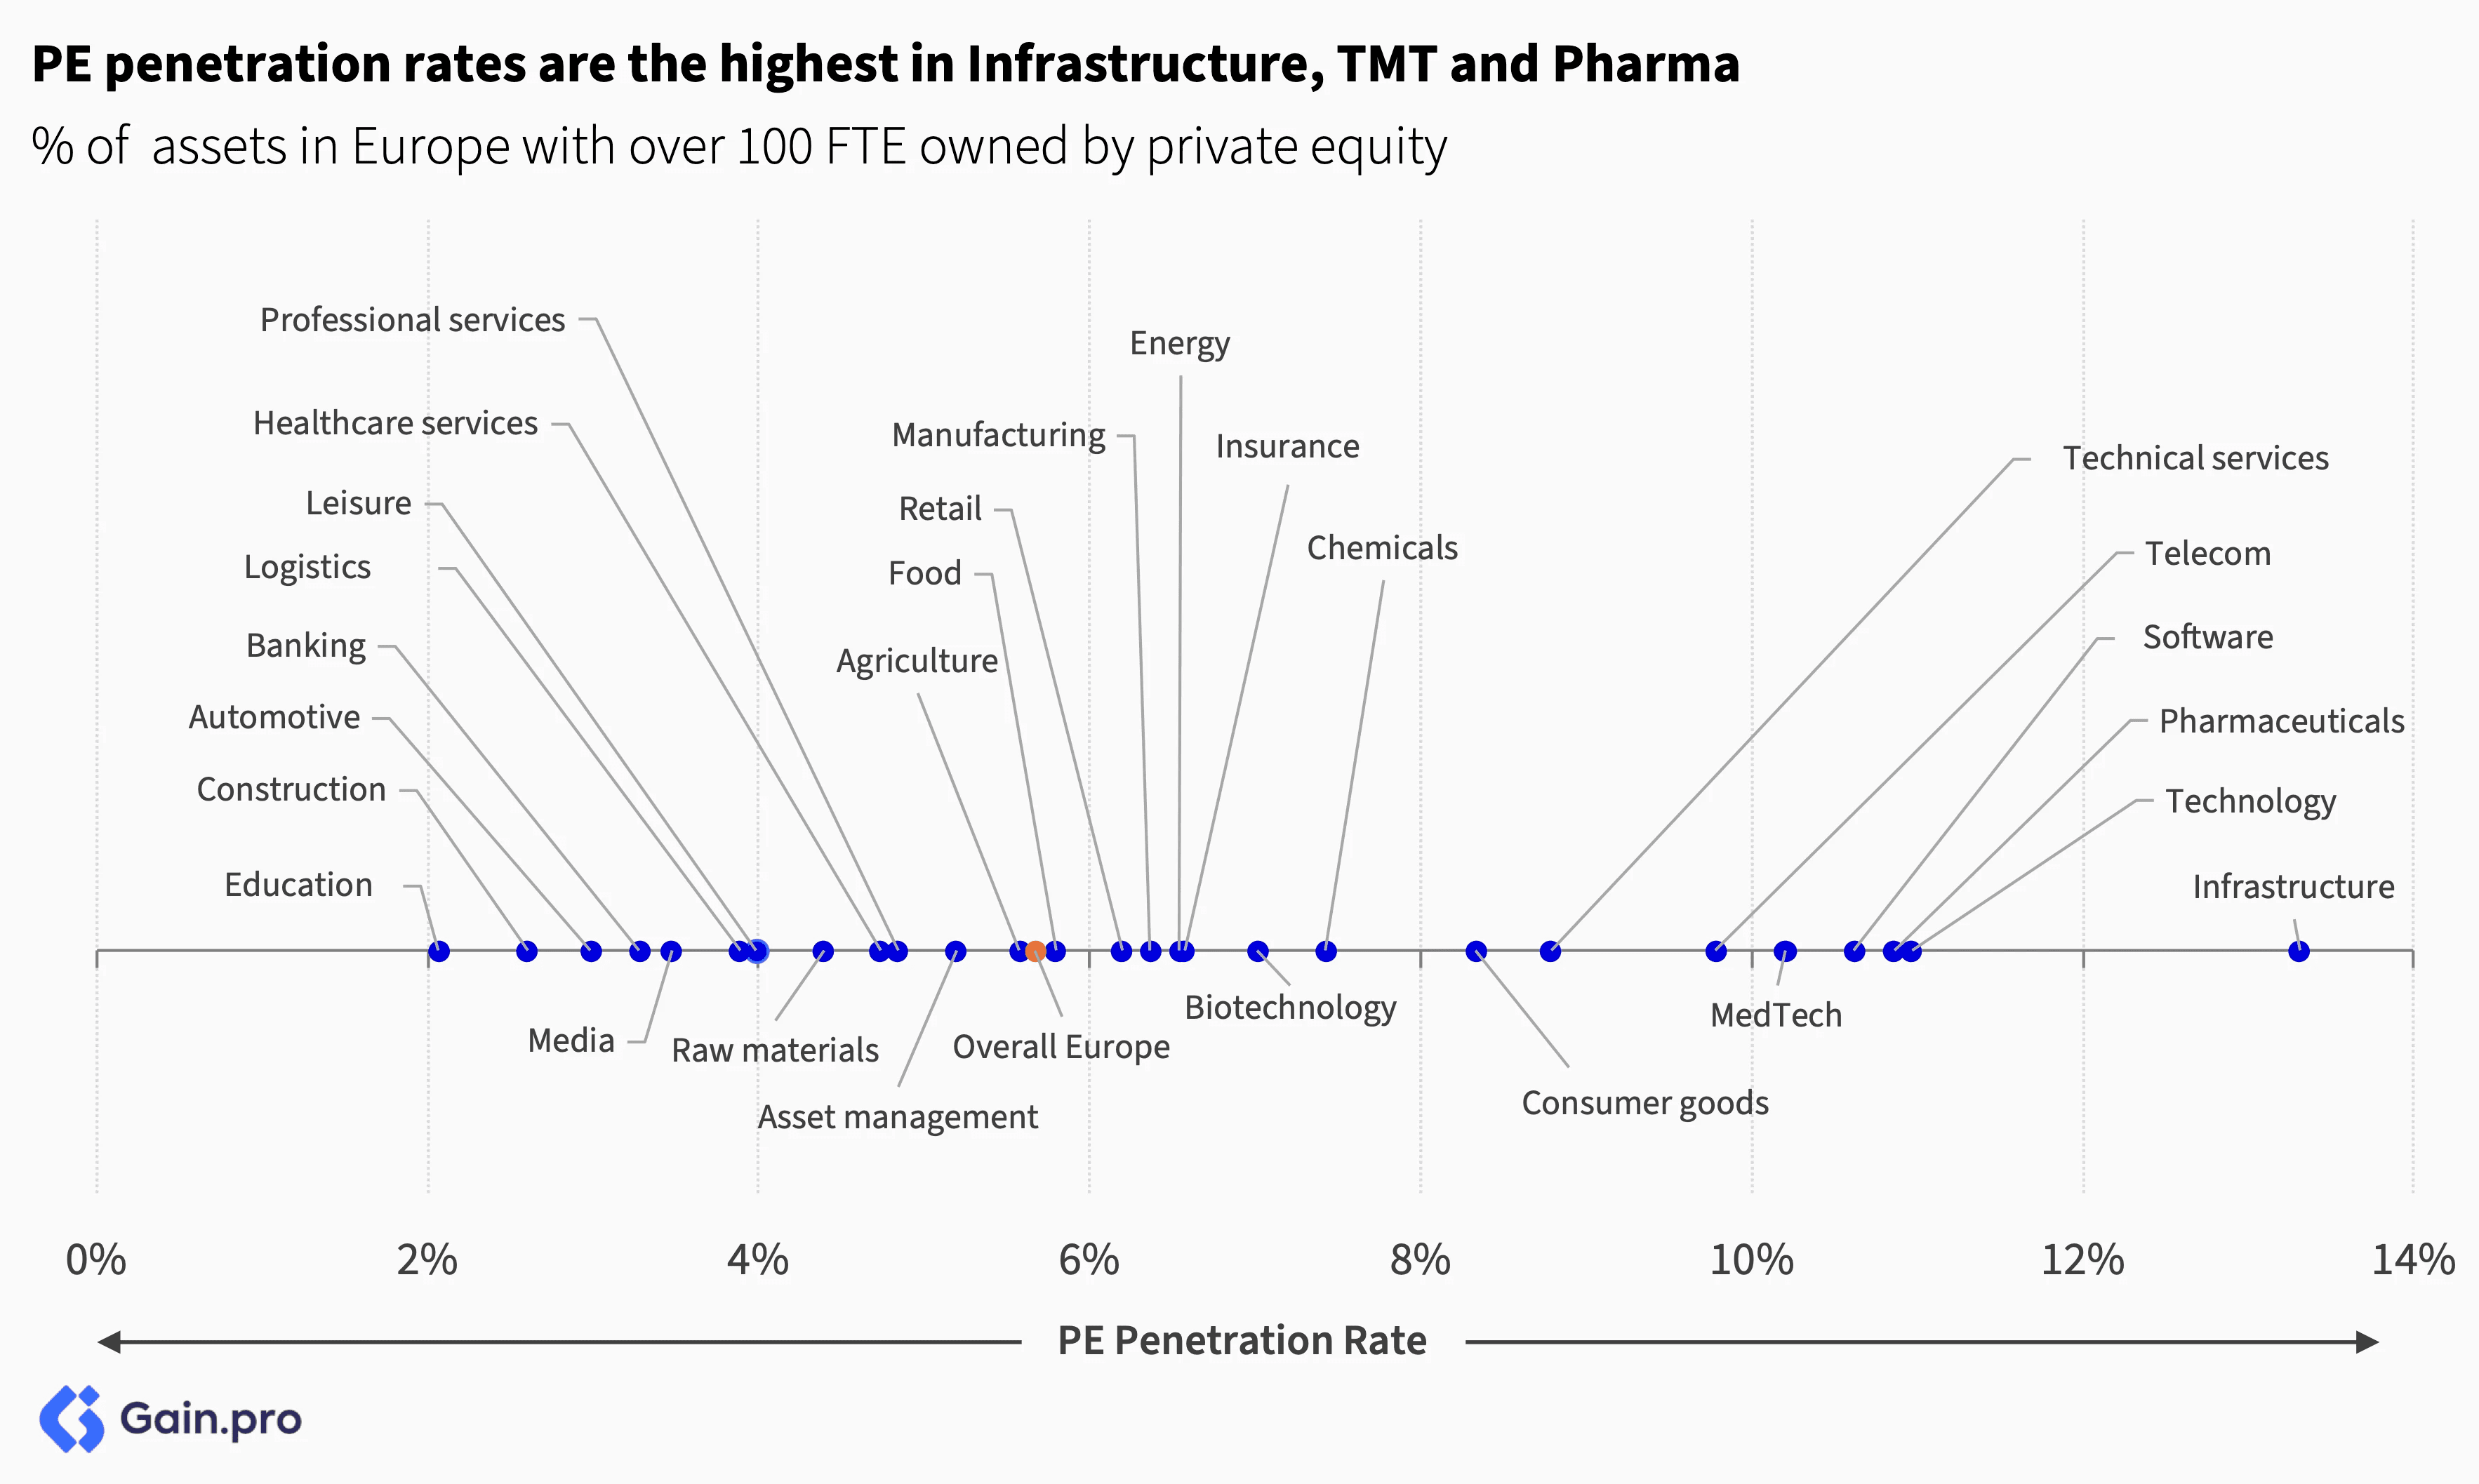
Close to 6% of European businesses with over 100 FTE are owned by private equity. By subsector, PE penetration is highest in Infrastructure, Technology, Pharma, Software and Telecom, reflecting sector maturity, growth potential and consolidation opportunities. PE penetration is lowest in the Education, Construction and Automotive sectors.
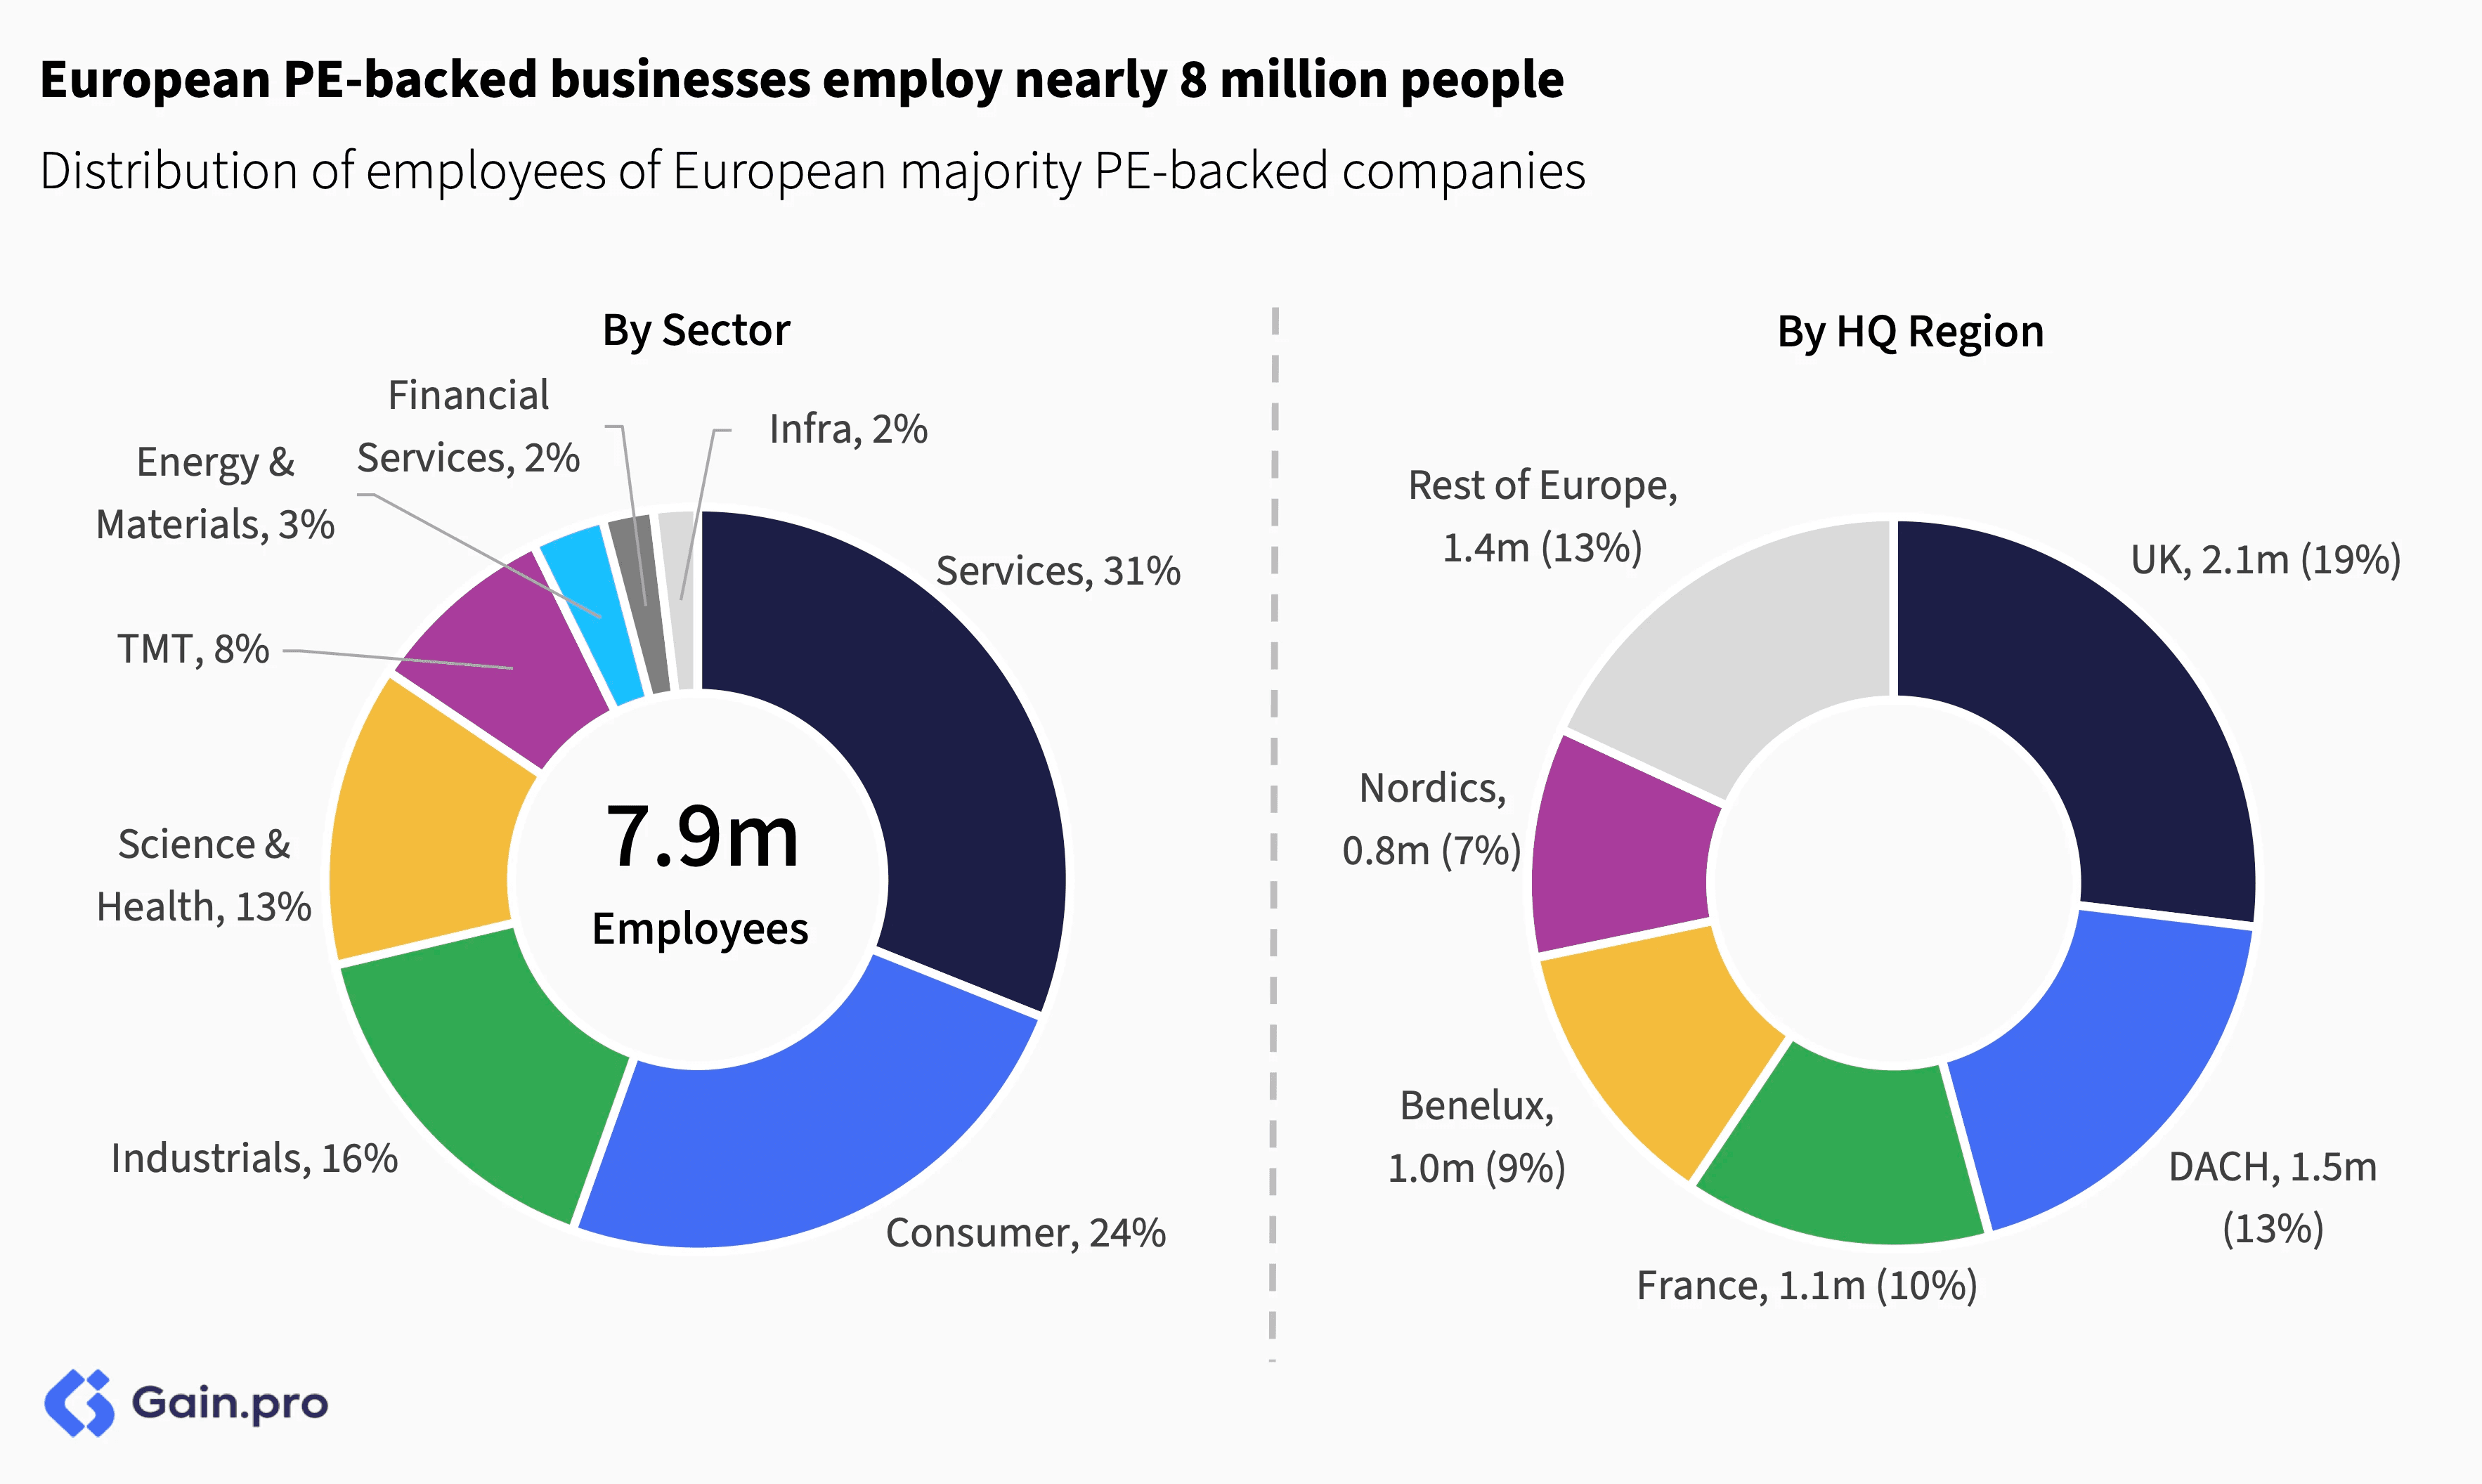
Services and Industrials consistently rank as the largest PE sectors across European regions. Services leads in UK&I, France, Benelux and Nordics, while Industrials is the largest sector in DACH and Italy. Notably, TMT represents a significant share in UK&I, DACH and Nordics, while both Iberia and CEE have higher concentrations of Consumer assets.
PE-backed businesses in Europe employ nearly 8 million people. By sector, Services (31%) and Consumer (24%) are the largest sectors for employment. By region, UK-headquartered PE businesses employ the largest share (2.1m employees), followed by DACH (1.5m) and France (1.1m).
Revenue Growth
Growth for PE-backed assets is coming off cycle highs and is stabilizing at the pre-pandemic levels. The median PE-backed business grew 9.1% in 2024, down from 11.3% in 2023 and 19.5% in 2022. Given how crucial growth is to PE value creation, any further weakening could dampen PE returns.
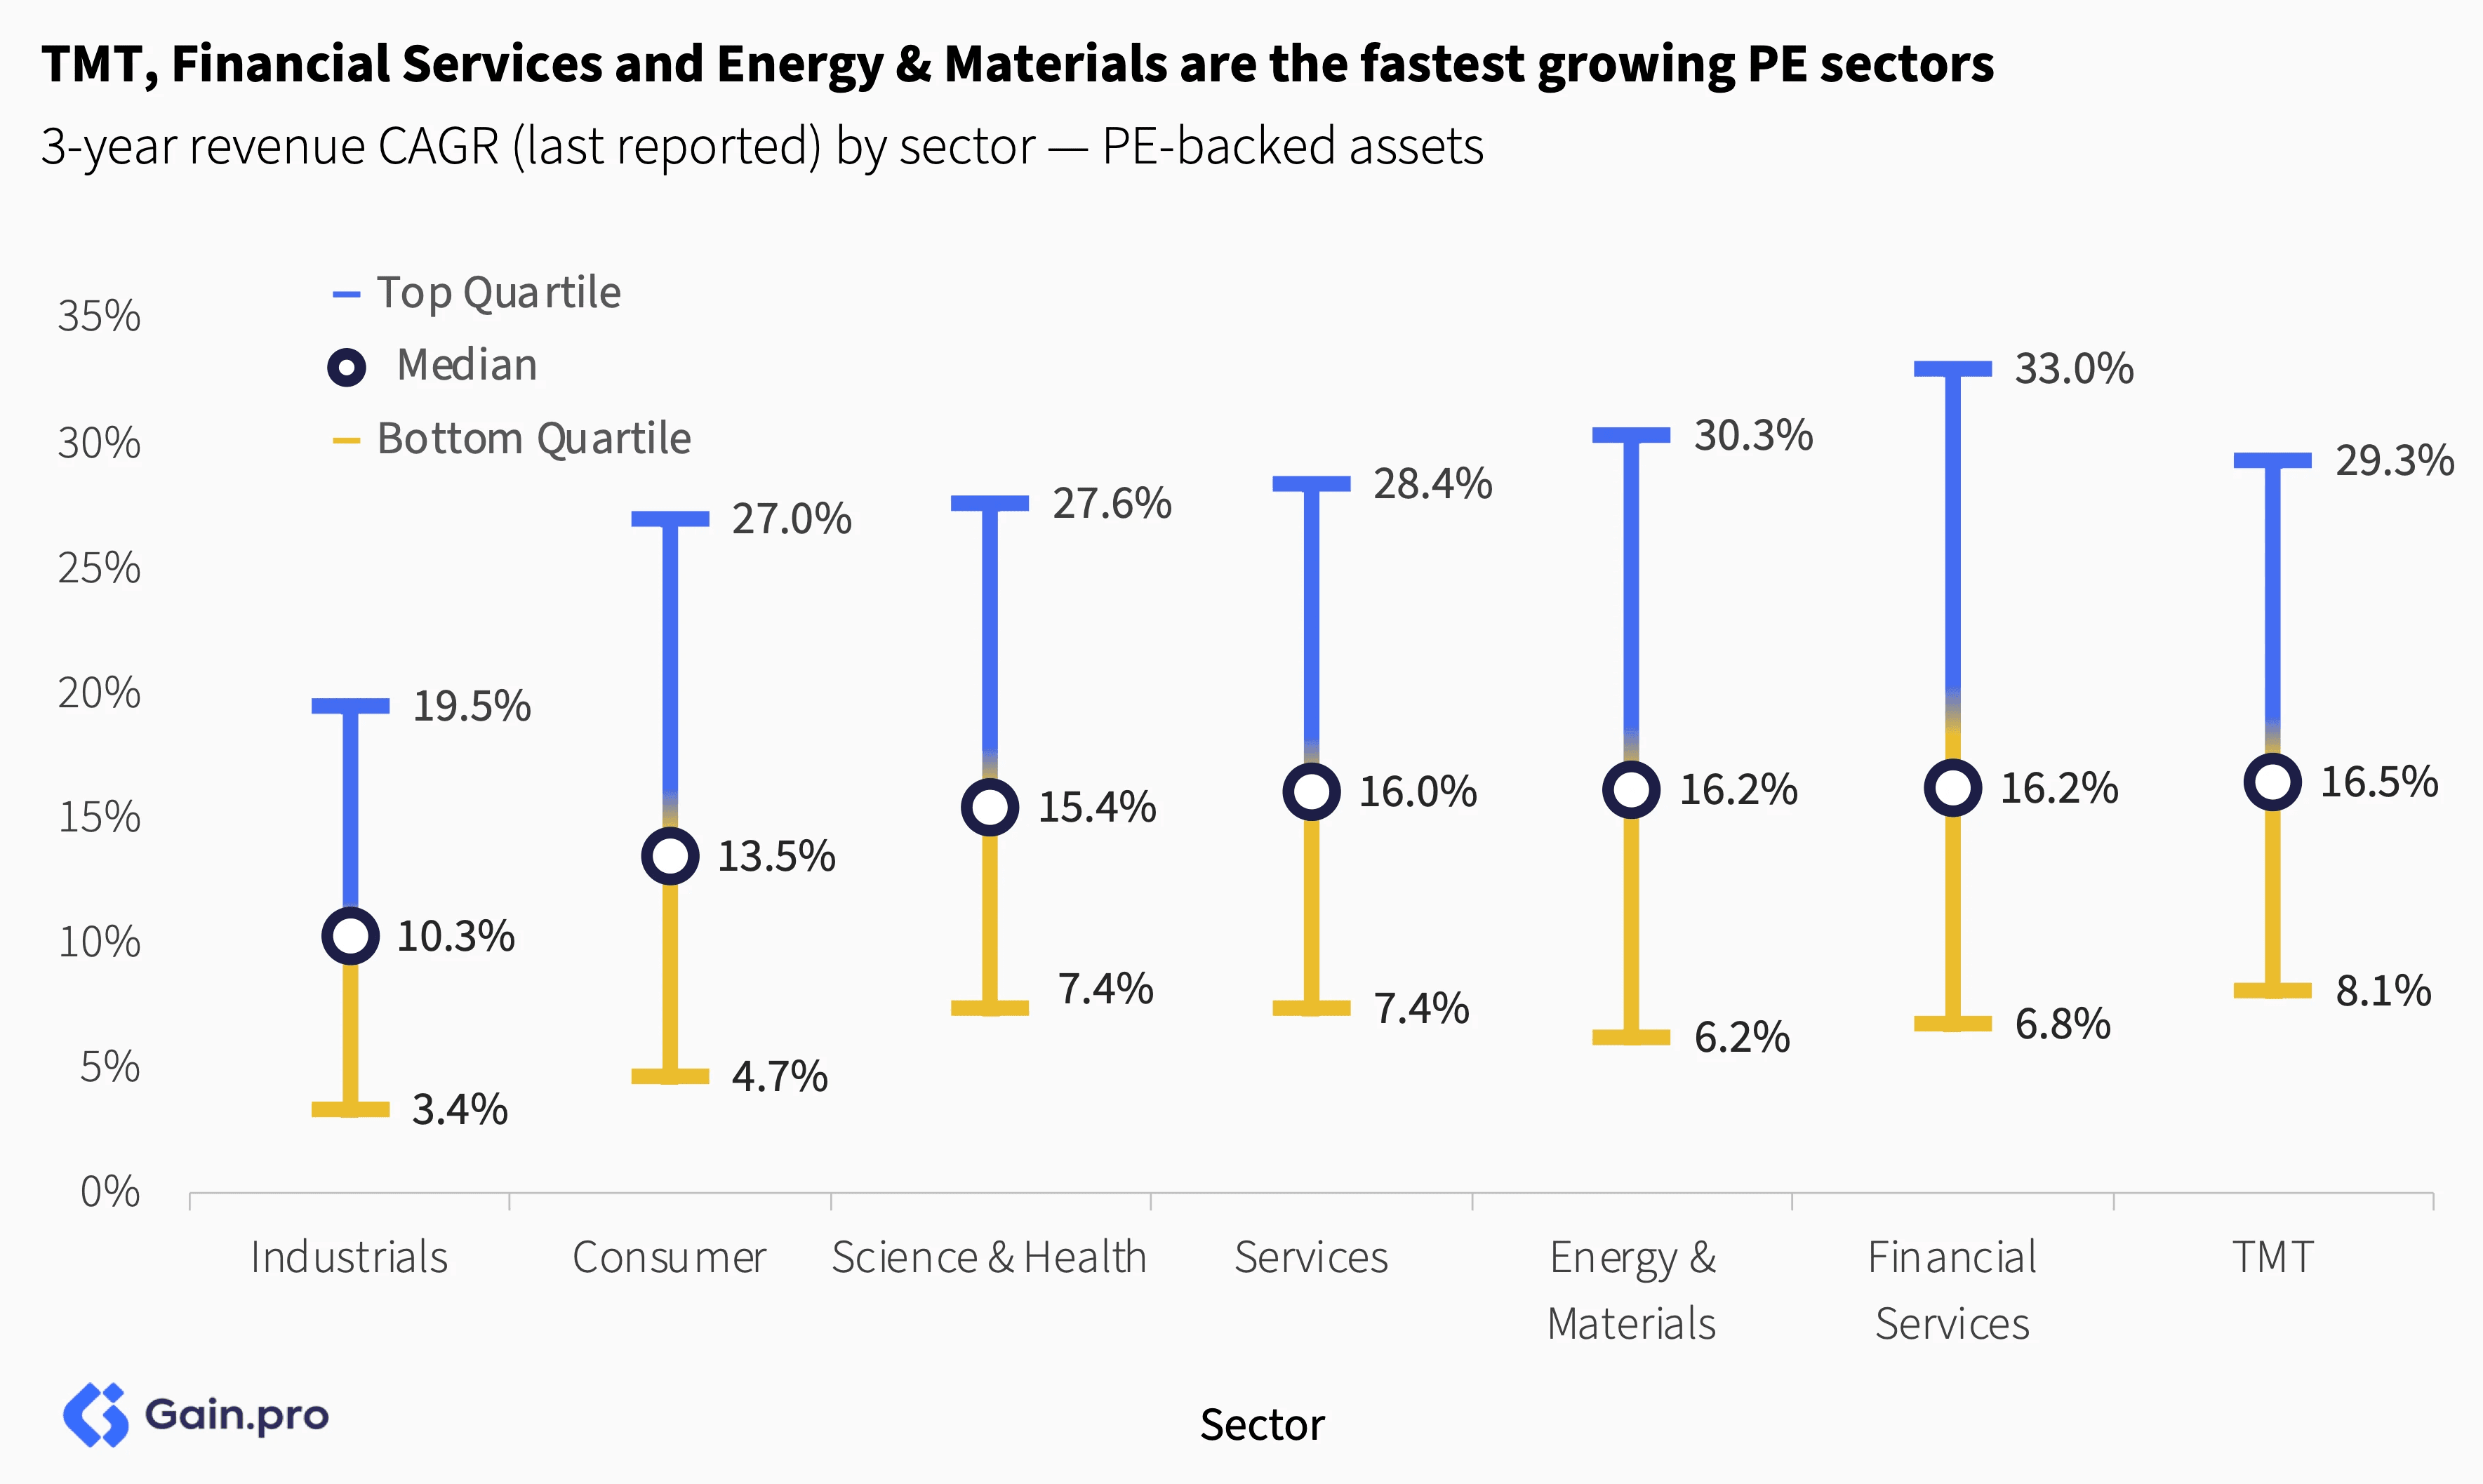
TMT, Financial Services and Energy & Materials are the fastest-growing PE sectors, while Consumer and Industrials lag behind. The Energy sector, particularly with assets in renewable energy and EV-related infrastructure, has benefited from rising energy prices and regulatory stimulus. TMT, on the other hand, has strong organic growth, aided by secular trends while Financial Services has benefited from AUM growth amid strong financial market performance.
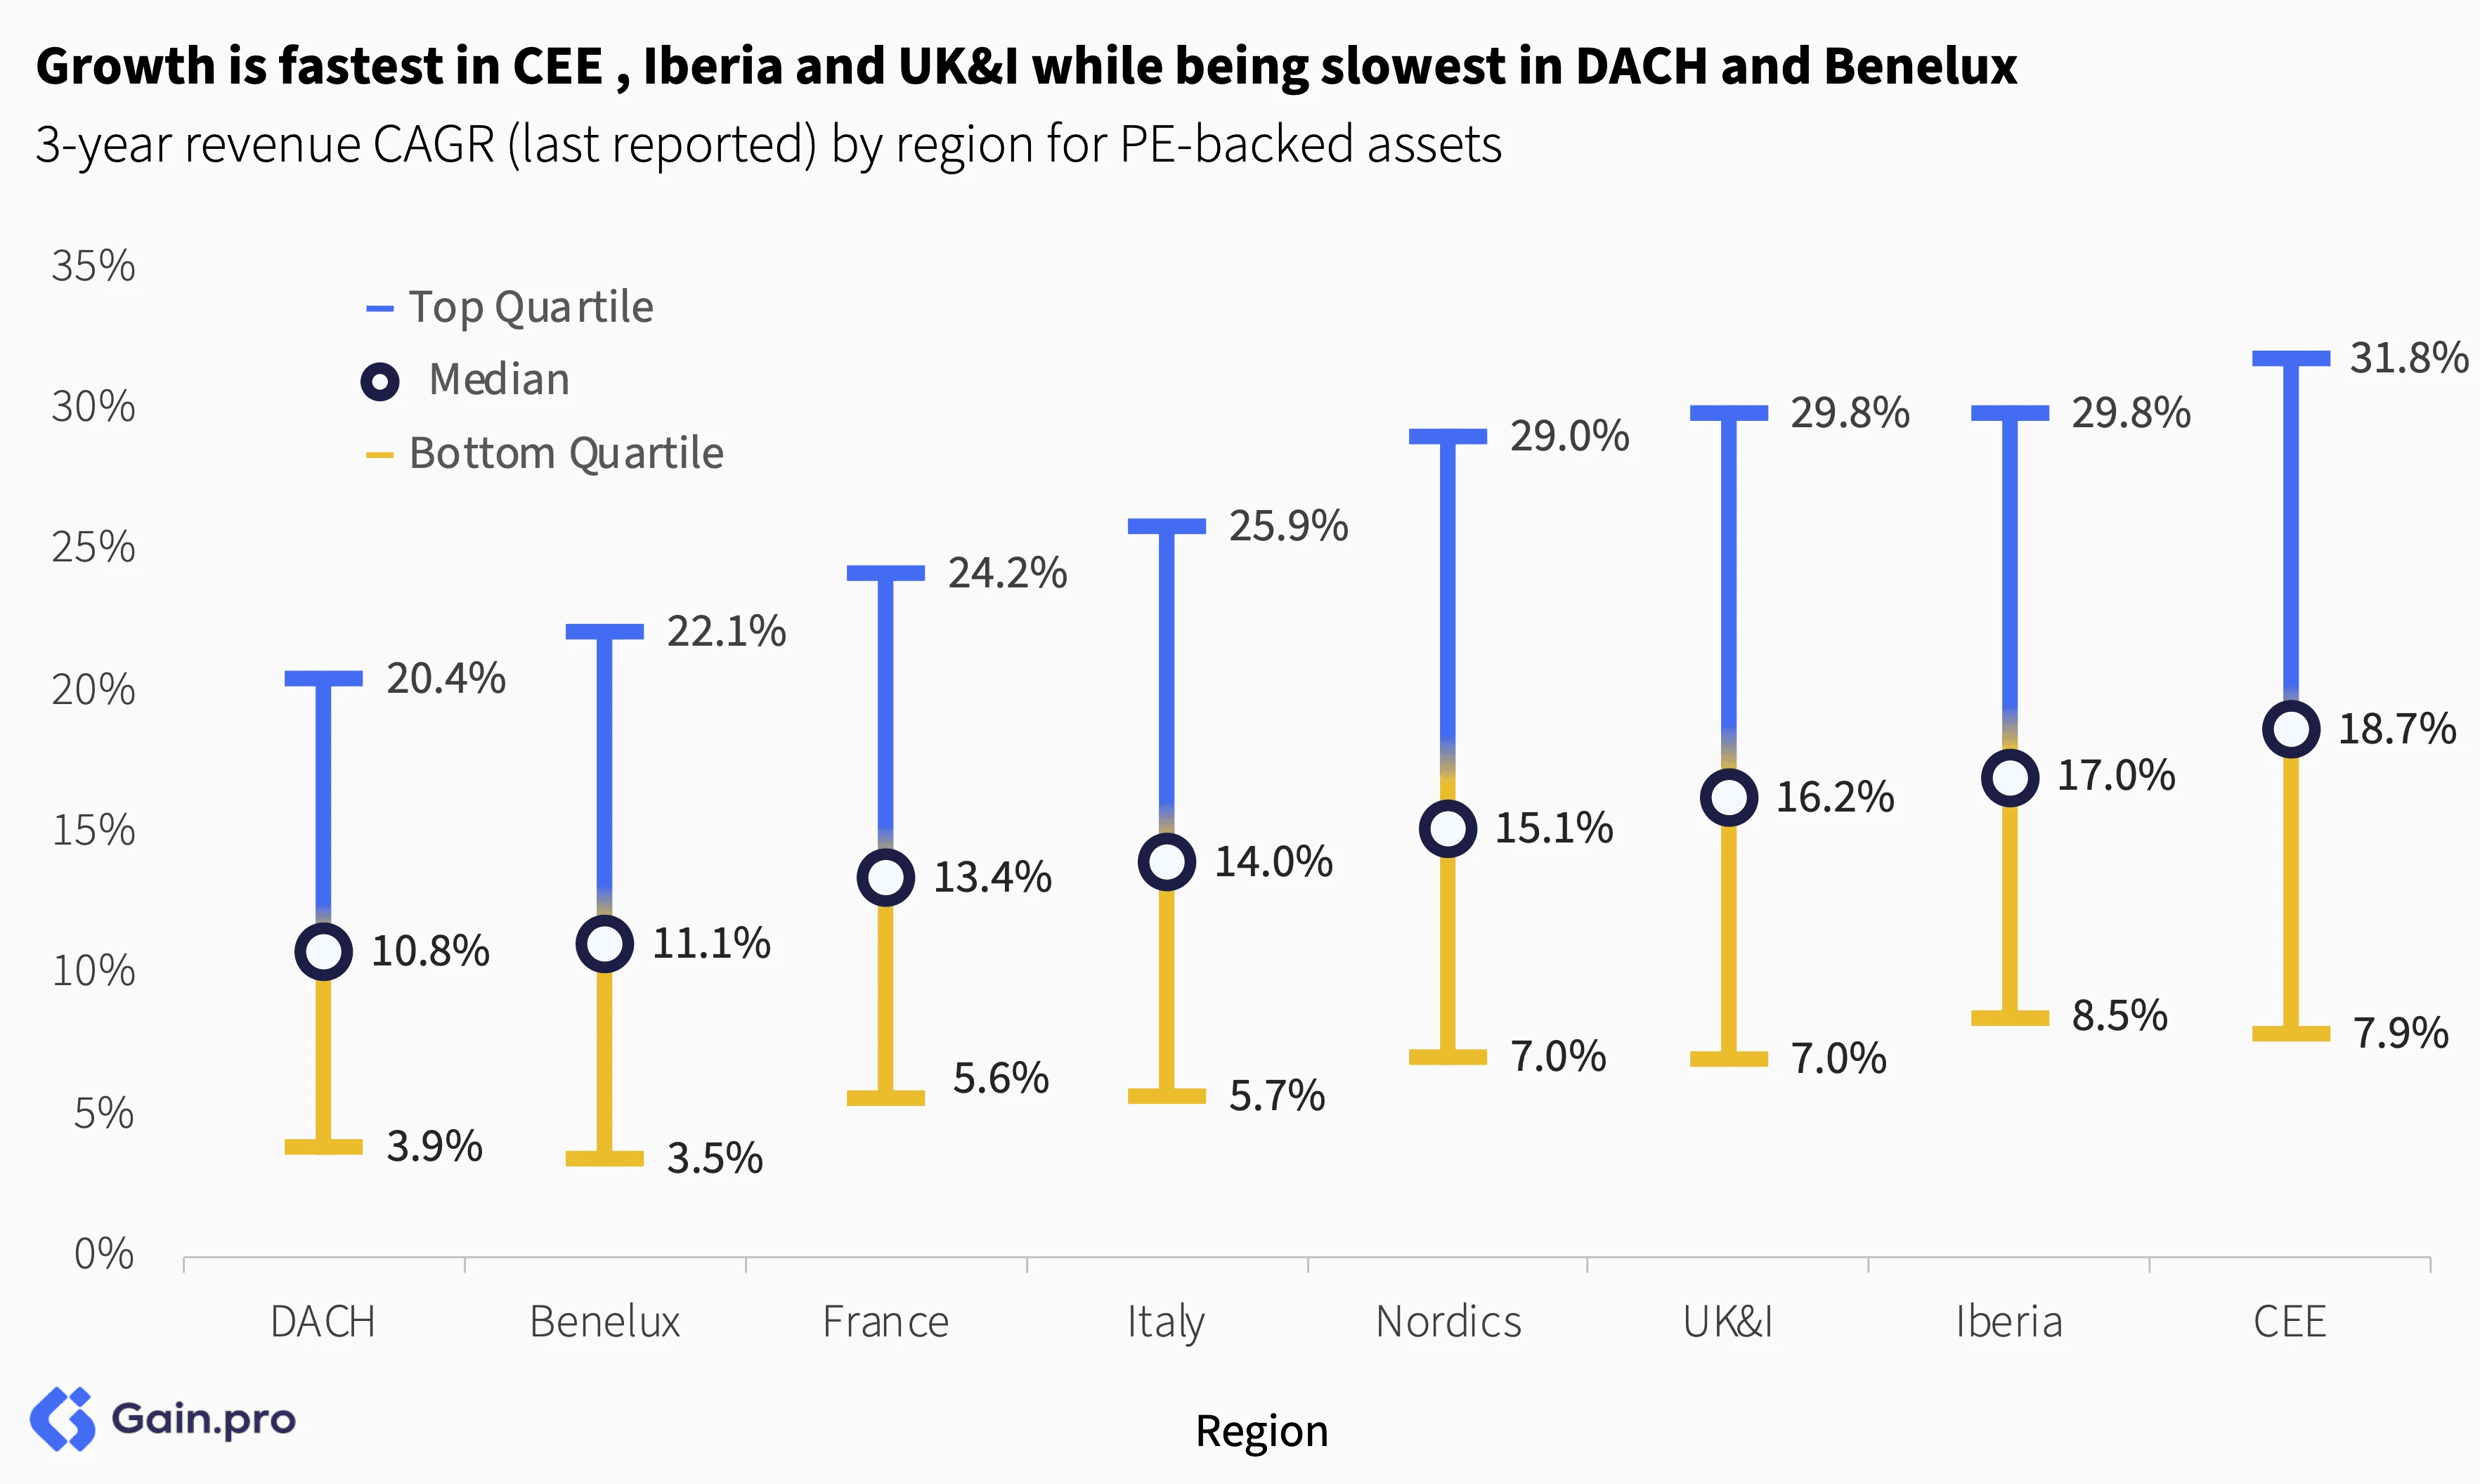
Growth is fastest in CEE, Iberia and the UK&I, while being slowest in DACH and Benelux. The UK&I benefit from a strong innovation ecosystem and vibrant tech and services sectors. CEE, on the other hand, has a high concentration of fast-growing young businesses. DACH, in contrast, is home to many generational, mid- to slow-growing Industrial assets.
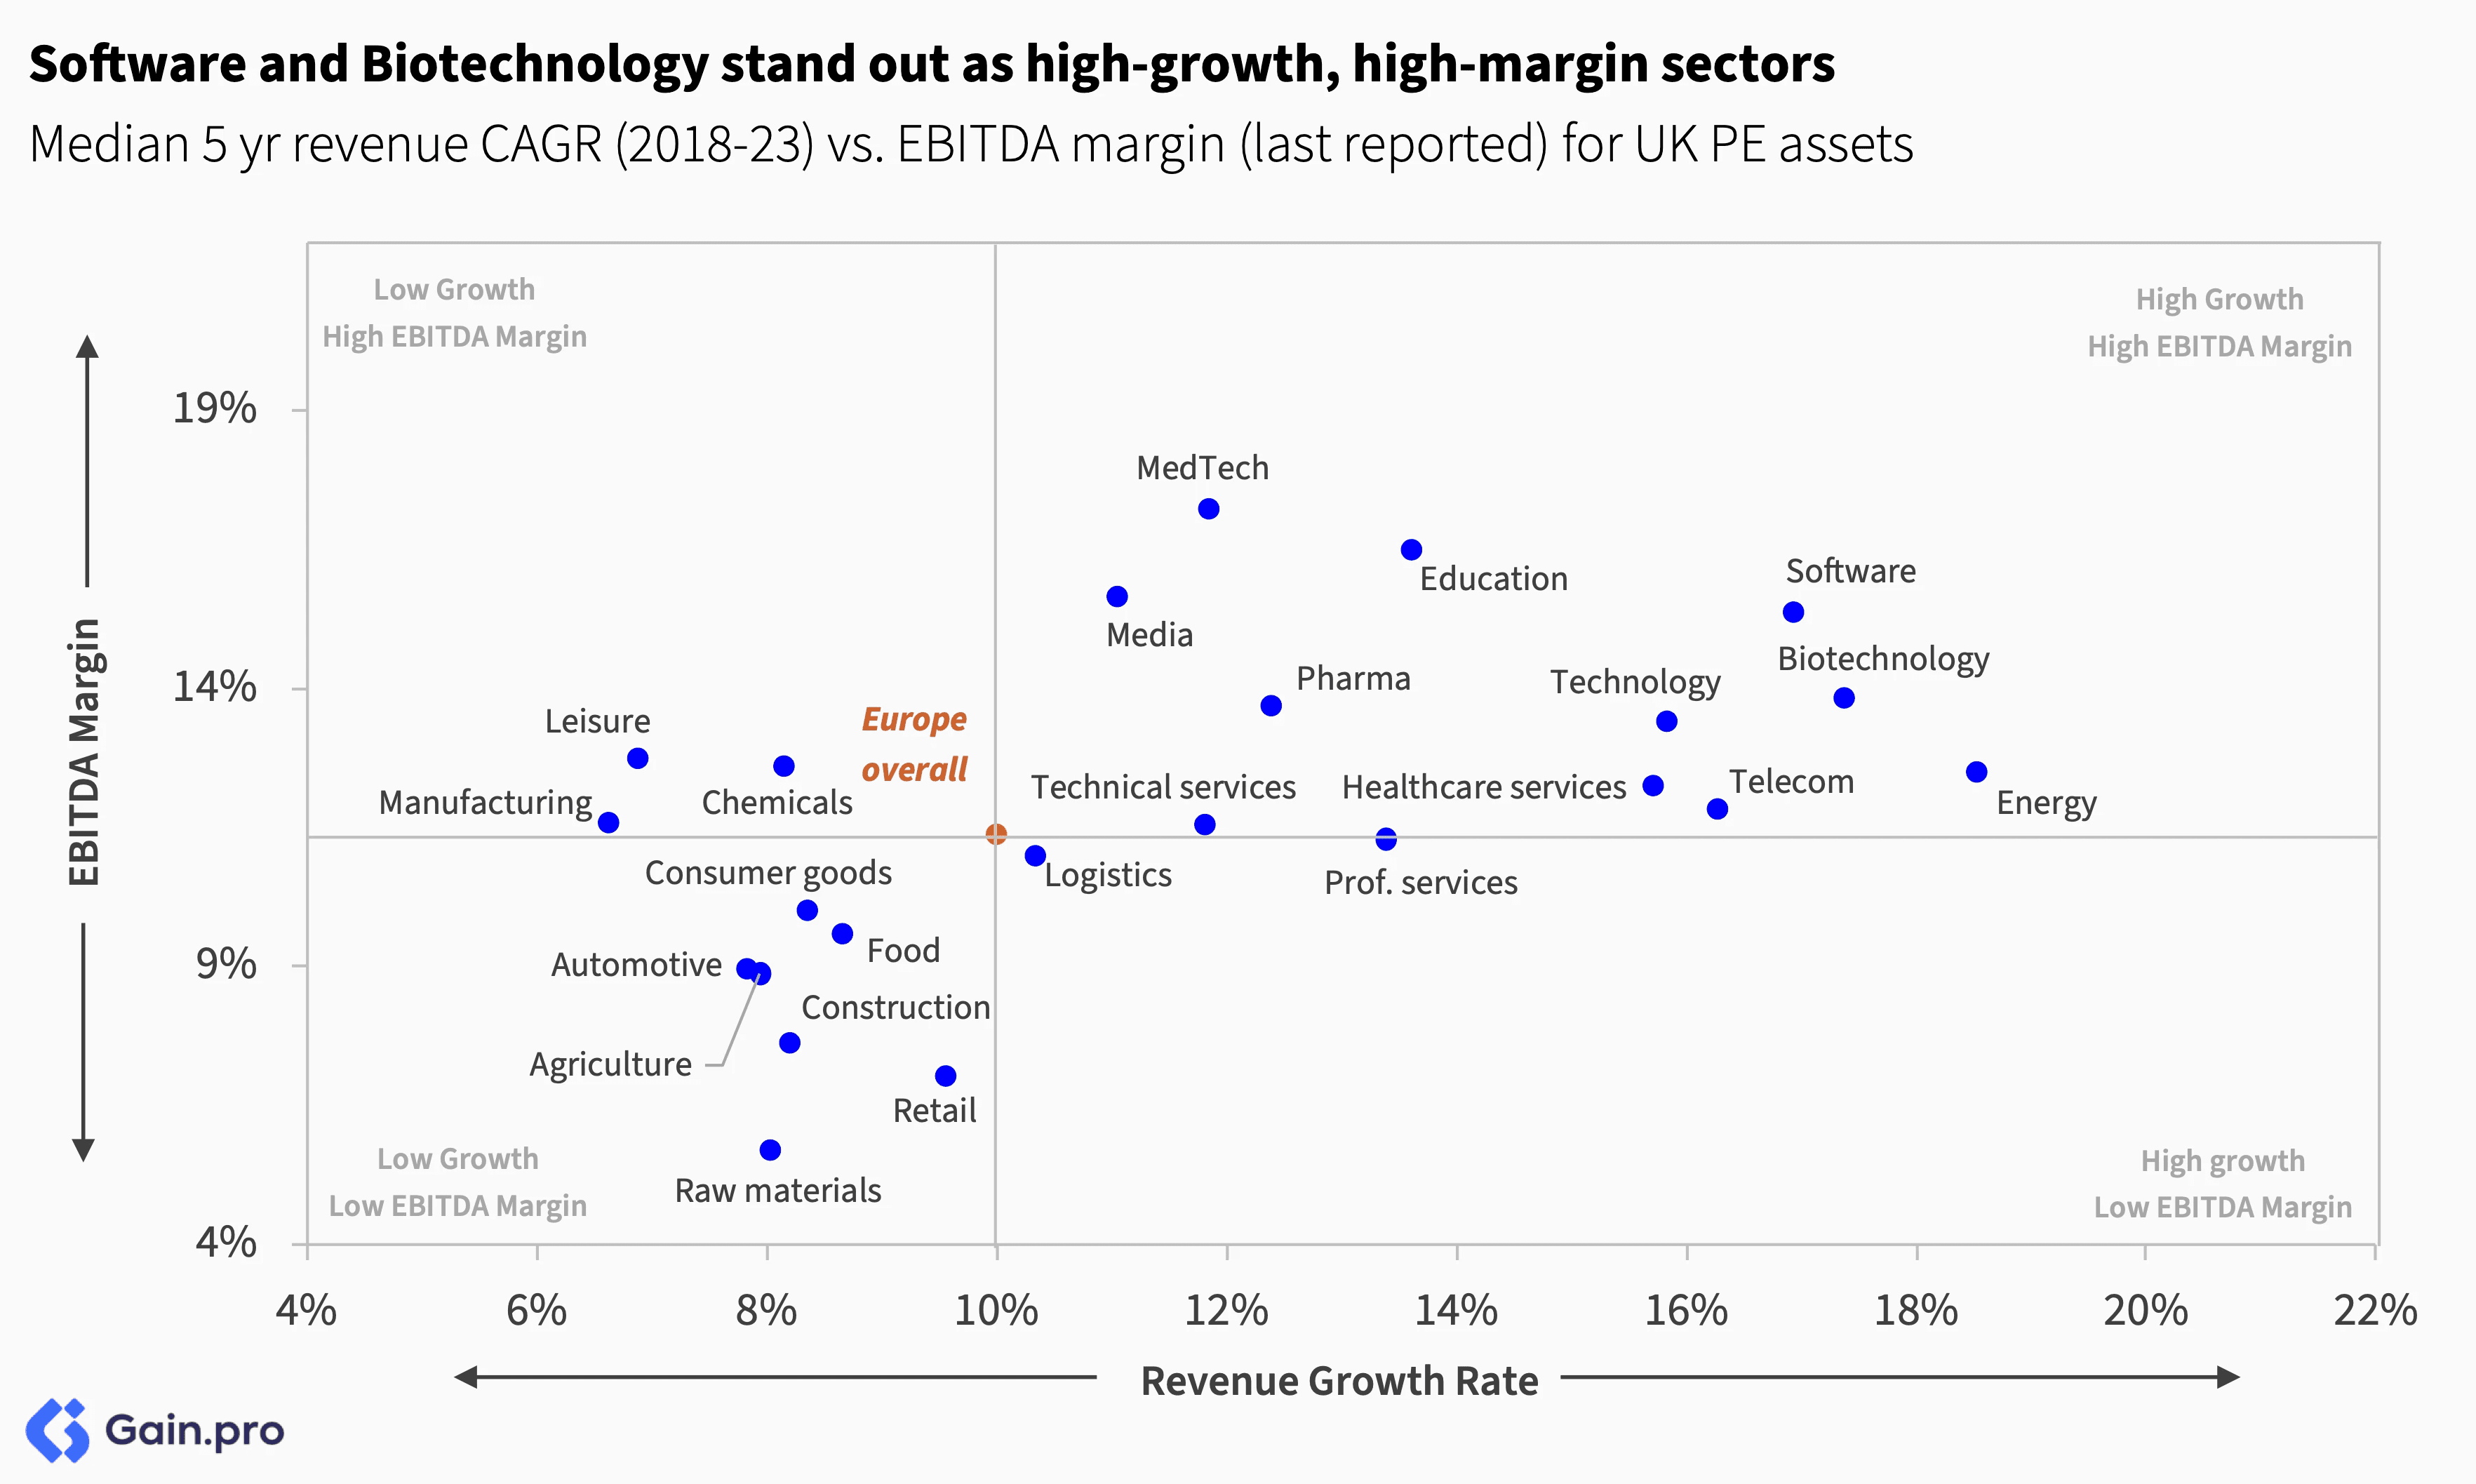
Software and Biotechnology stand out as high-growth, high-margin sectors in Europe. In contrast, Raw Materials, Agriculture, Automotive and Construction assets lag behind, showing lower growth and profitability.
EBITDA Margins
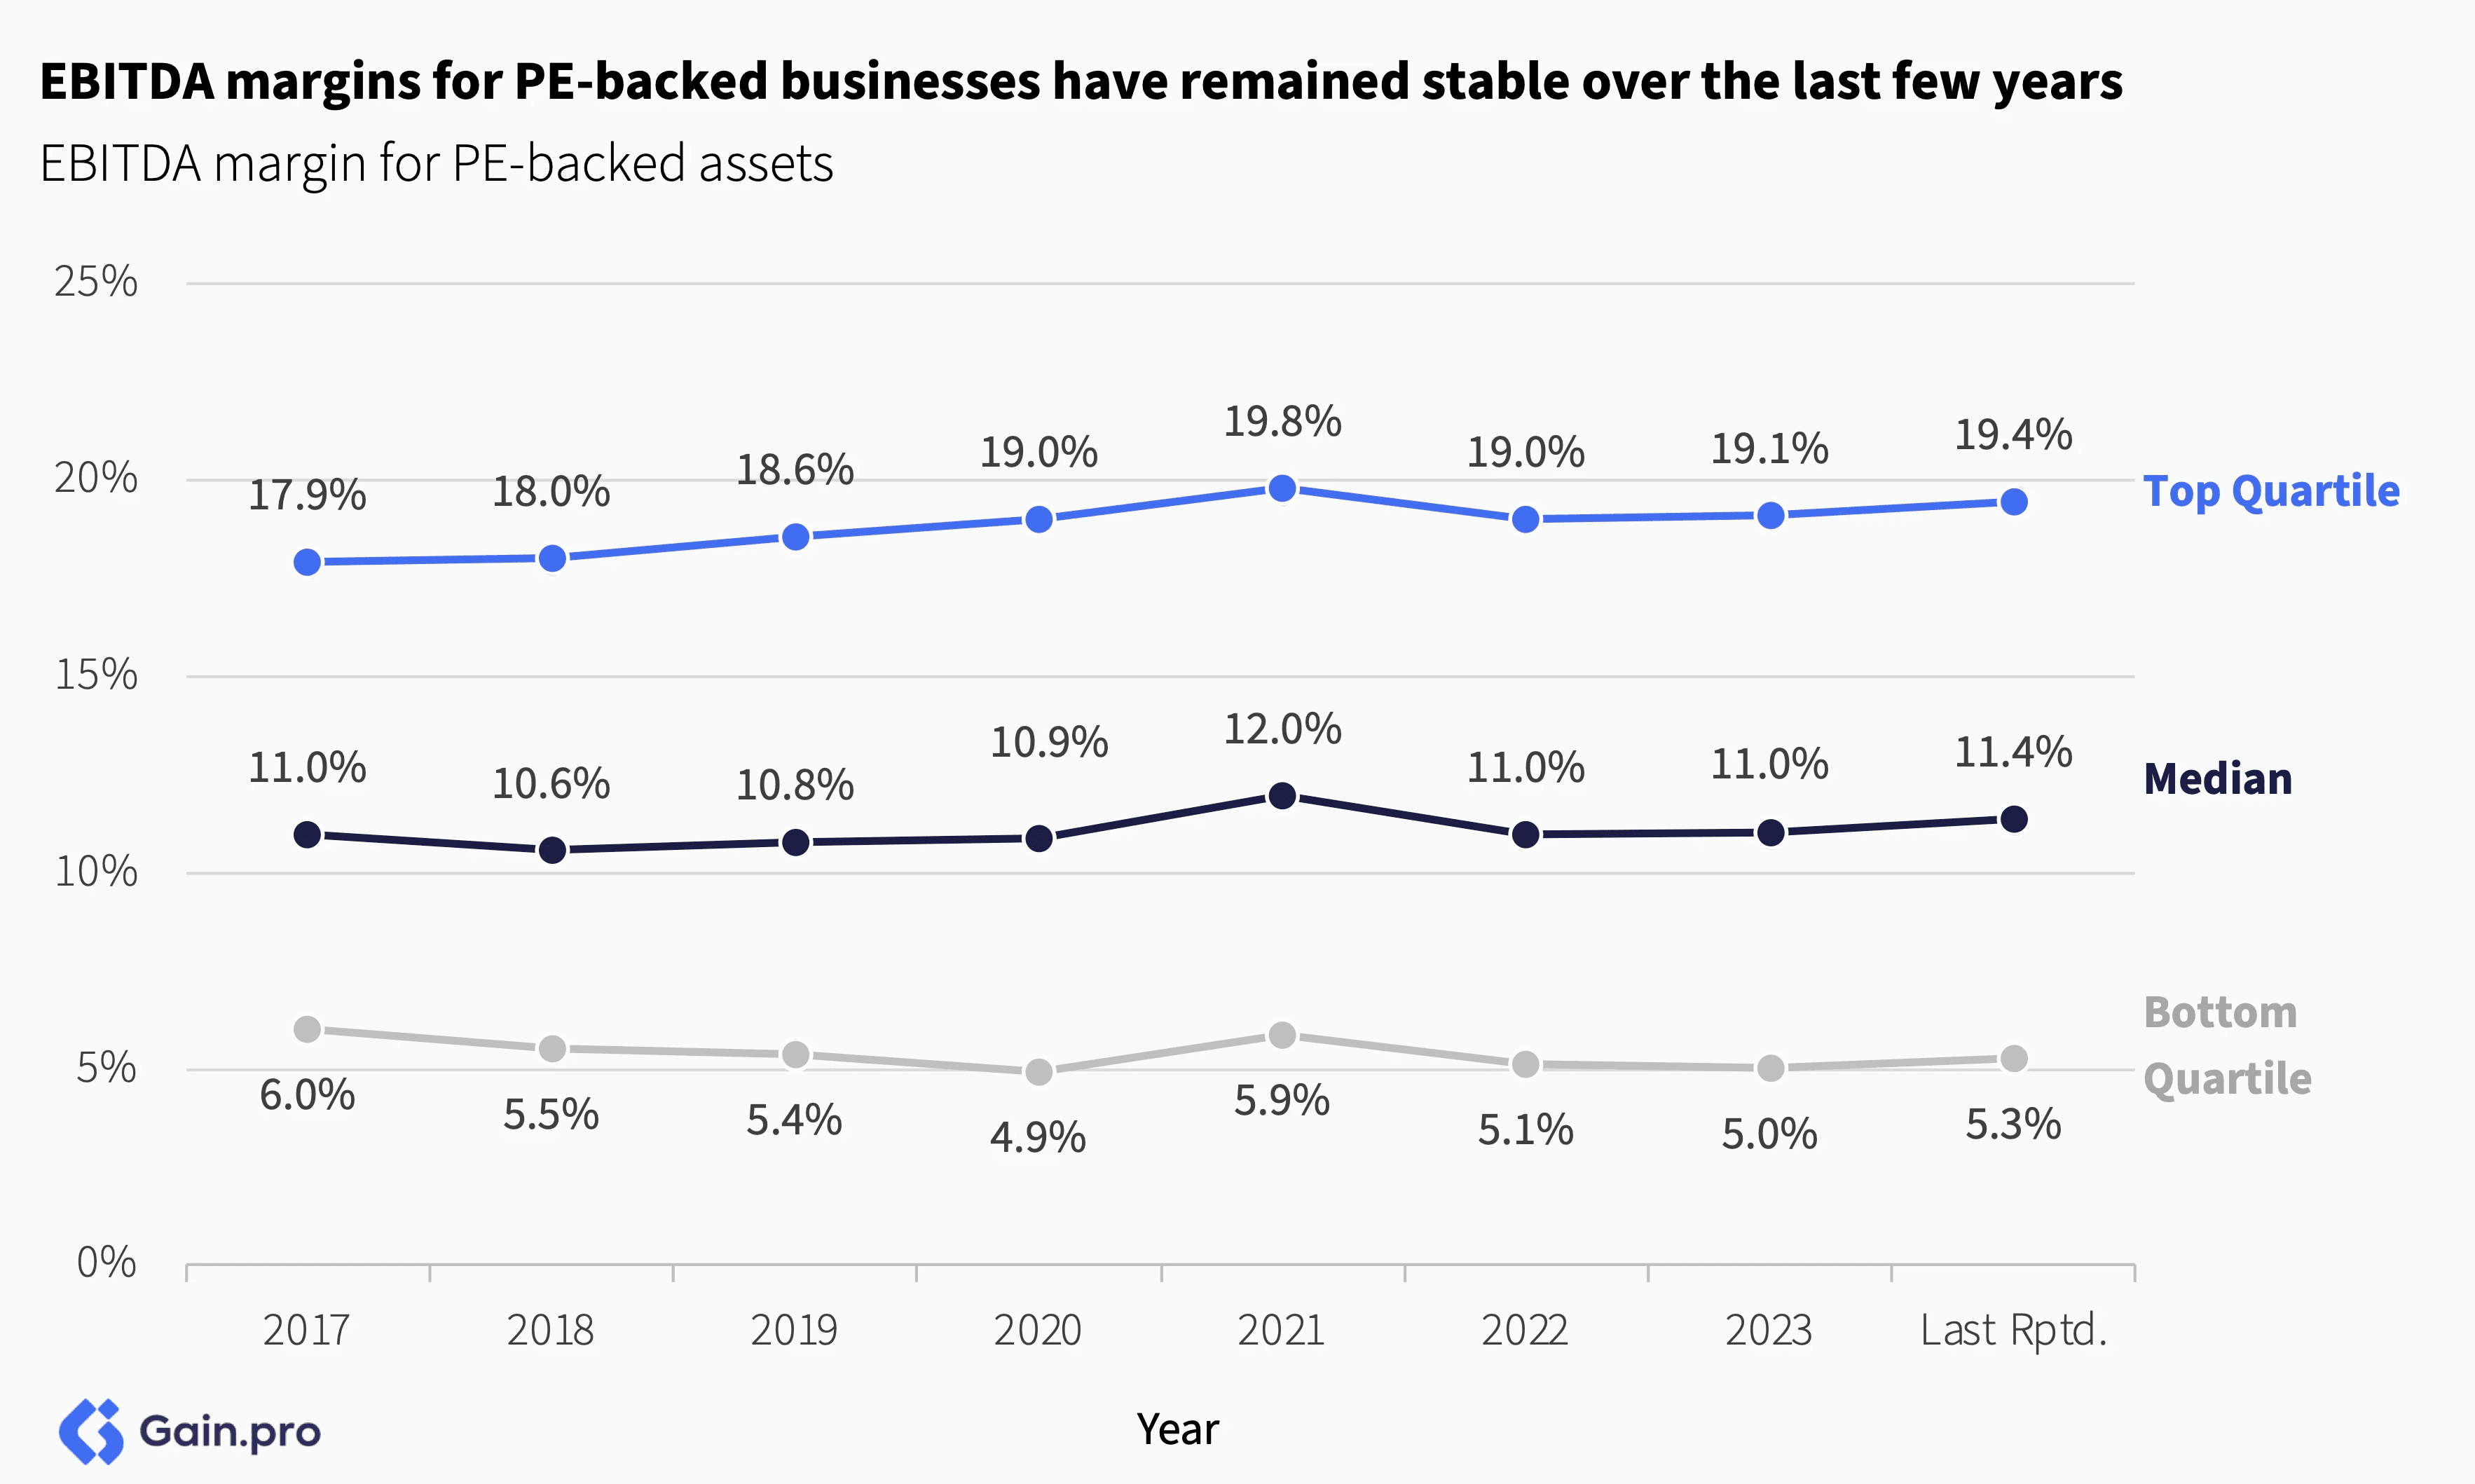
EBITDA margins for PE-backed businesses have remained stable over the last few years. The median PE-backed business has a margin of 11.4% (flat from 11.0% in 2017). Notably, top quartile businesses have seen margins expand slightly (+150bps over last 7 years).
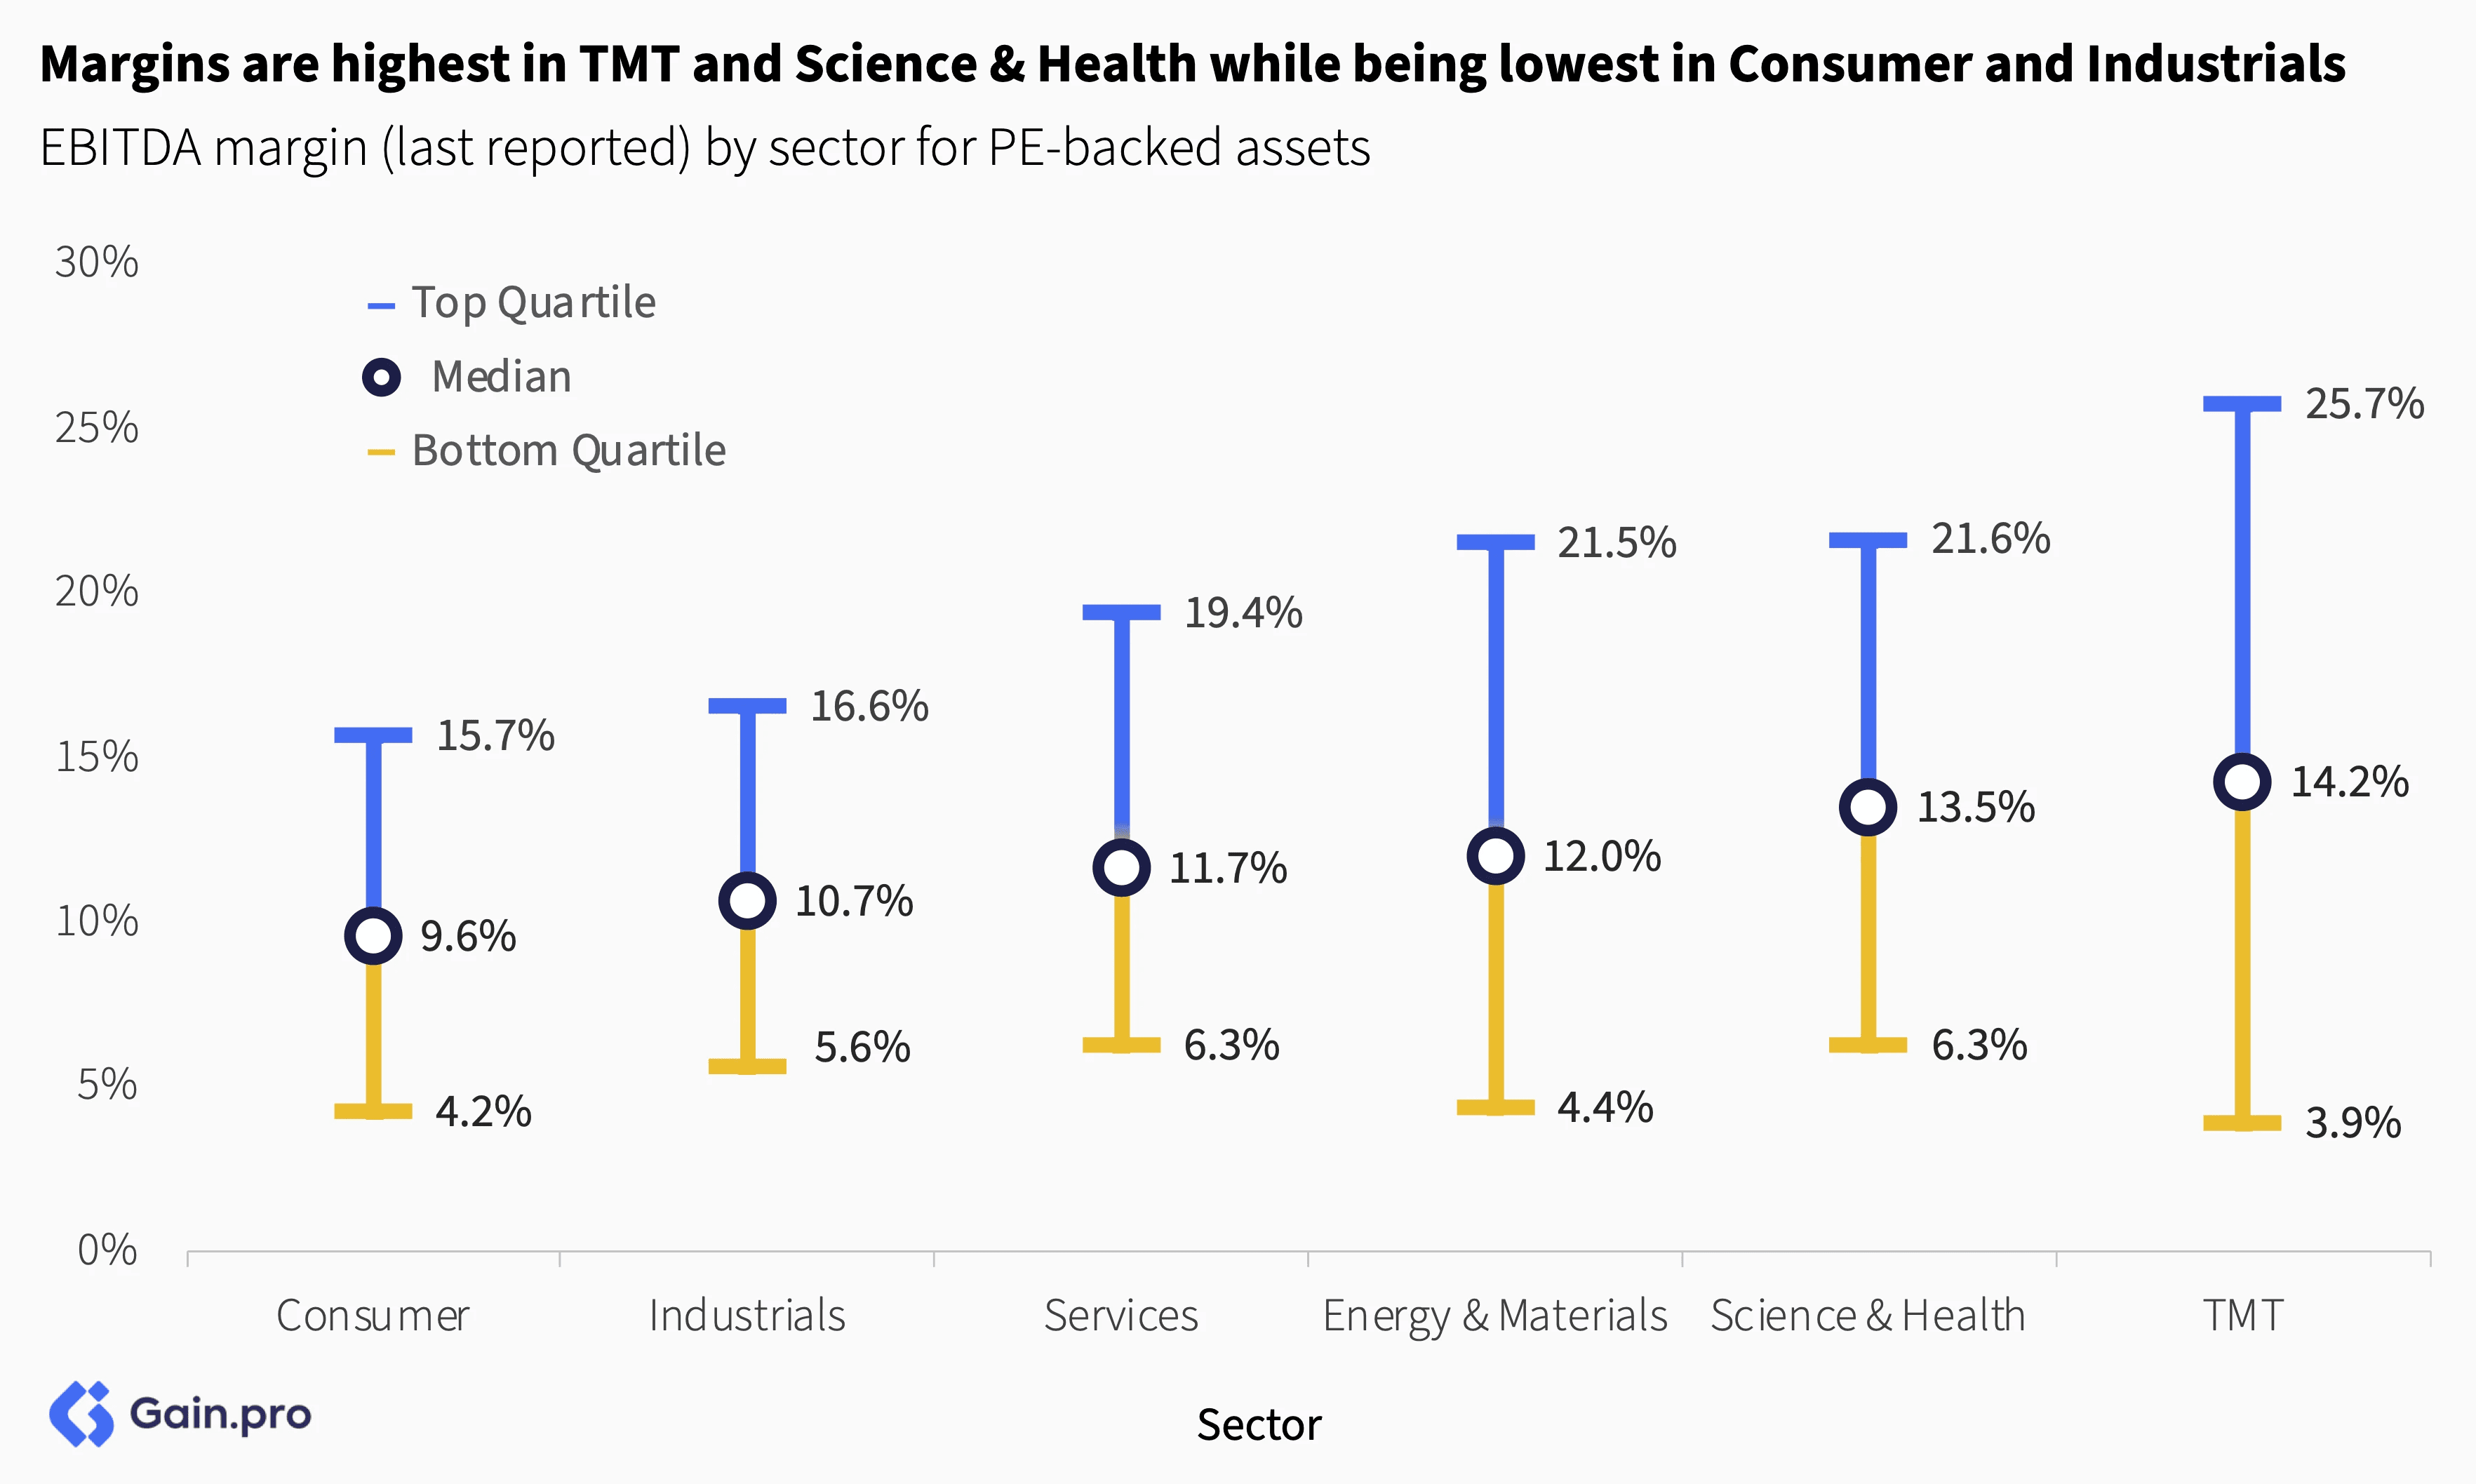
Margins are highest in asset-light sectors such as TMT and Science & Health. TMT businesses benefit from software scalability and network effects, while Science & Health businesses often have IP protection and regulatory moats. In contrast, margins are lowest in Consumer and Industrials, which have low gross margins and high operational costs.
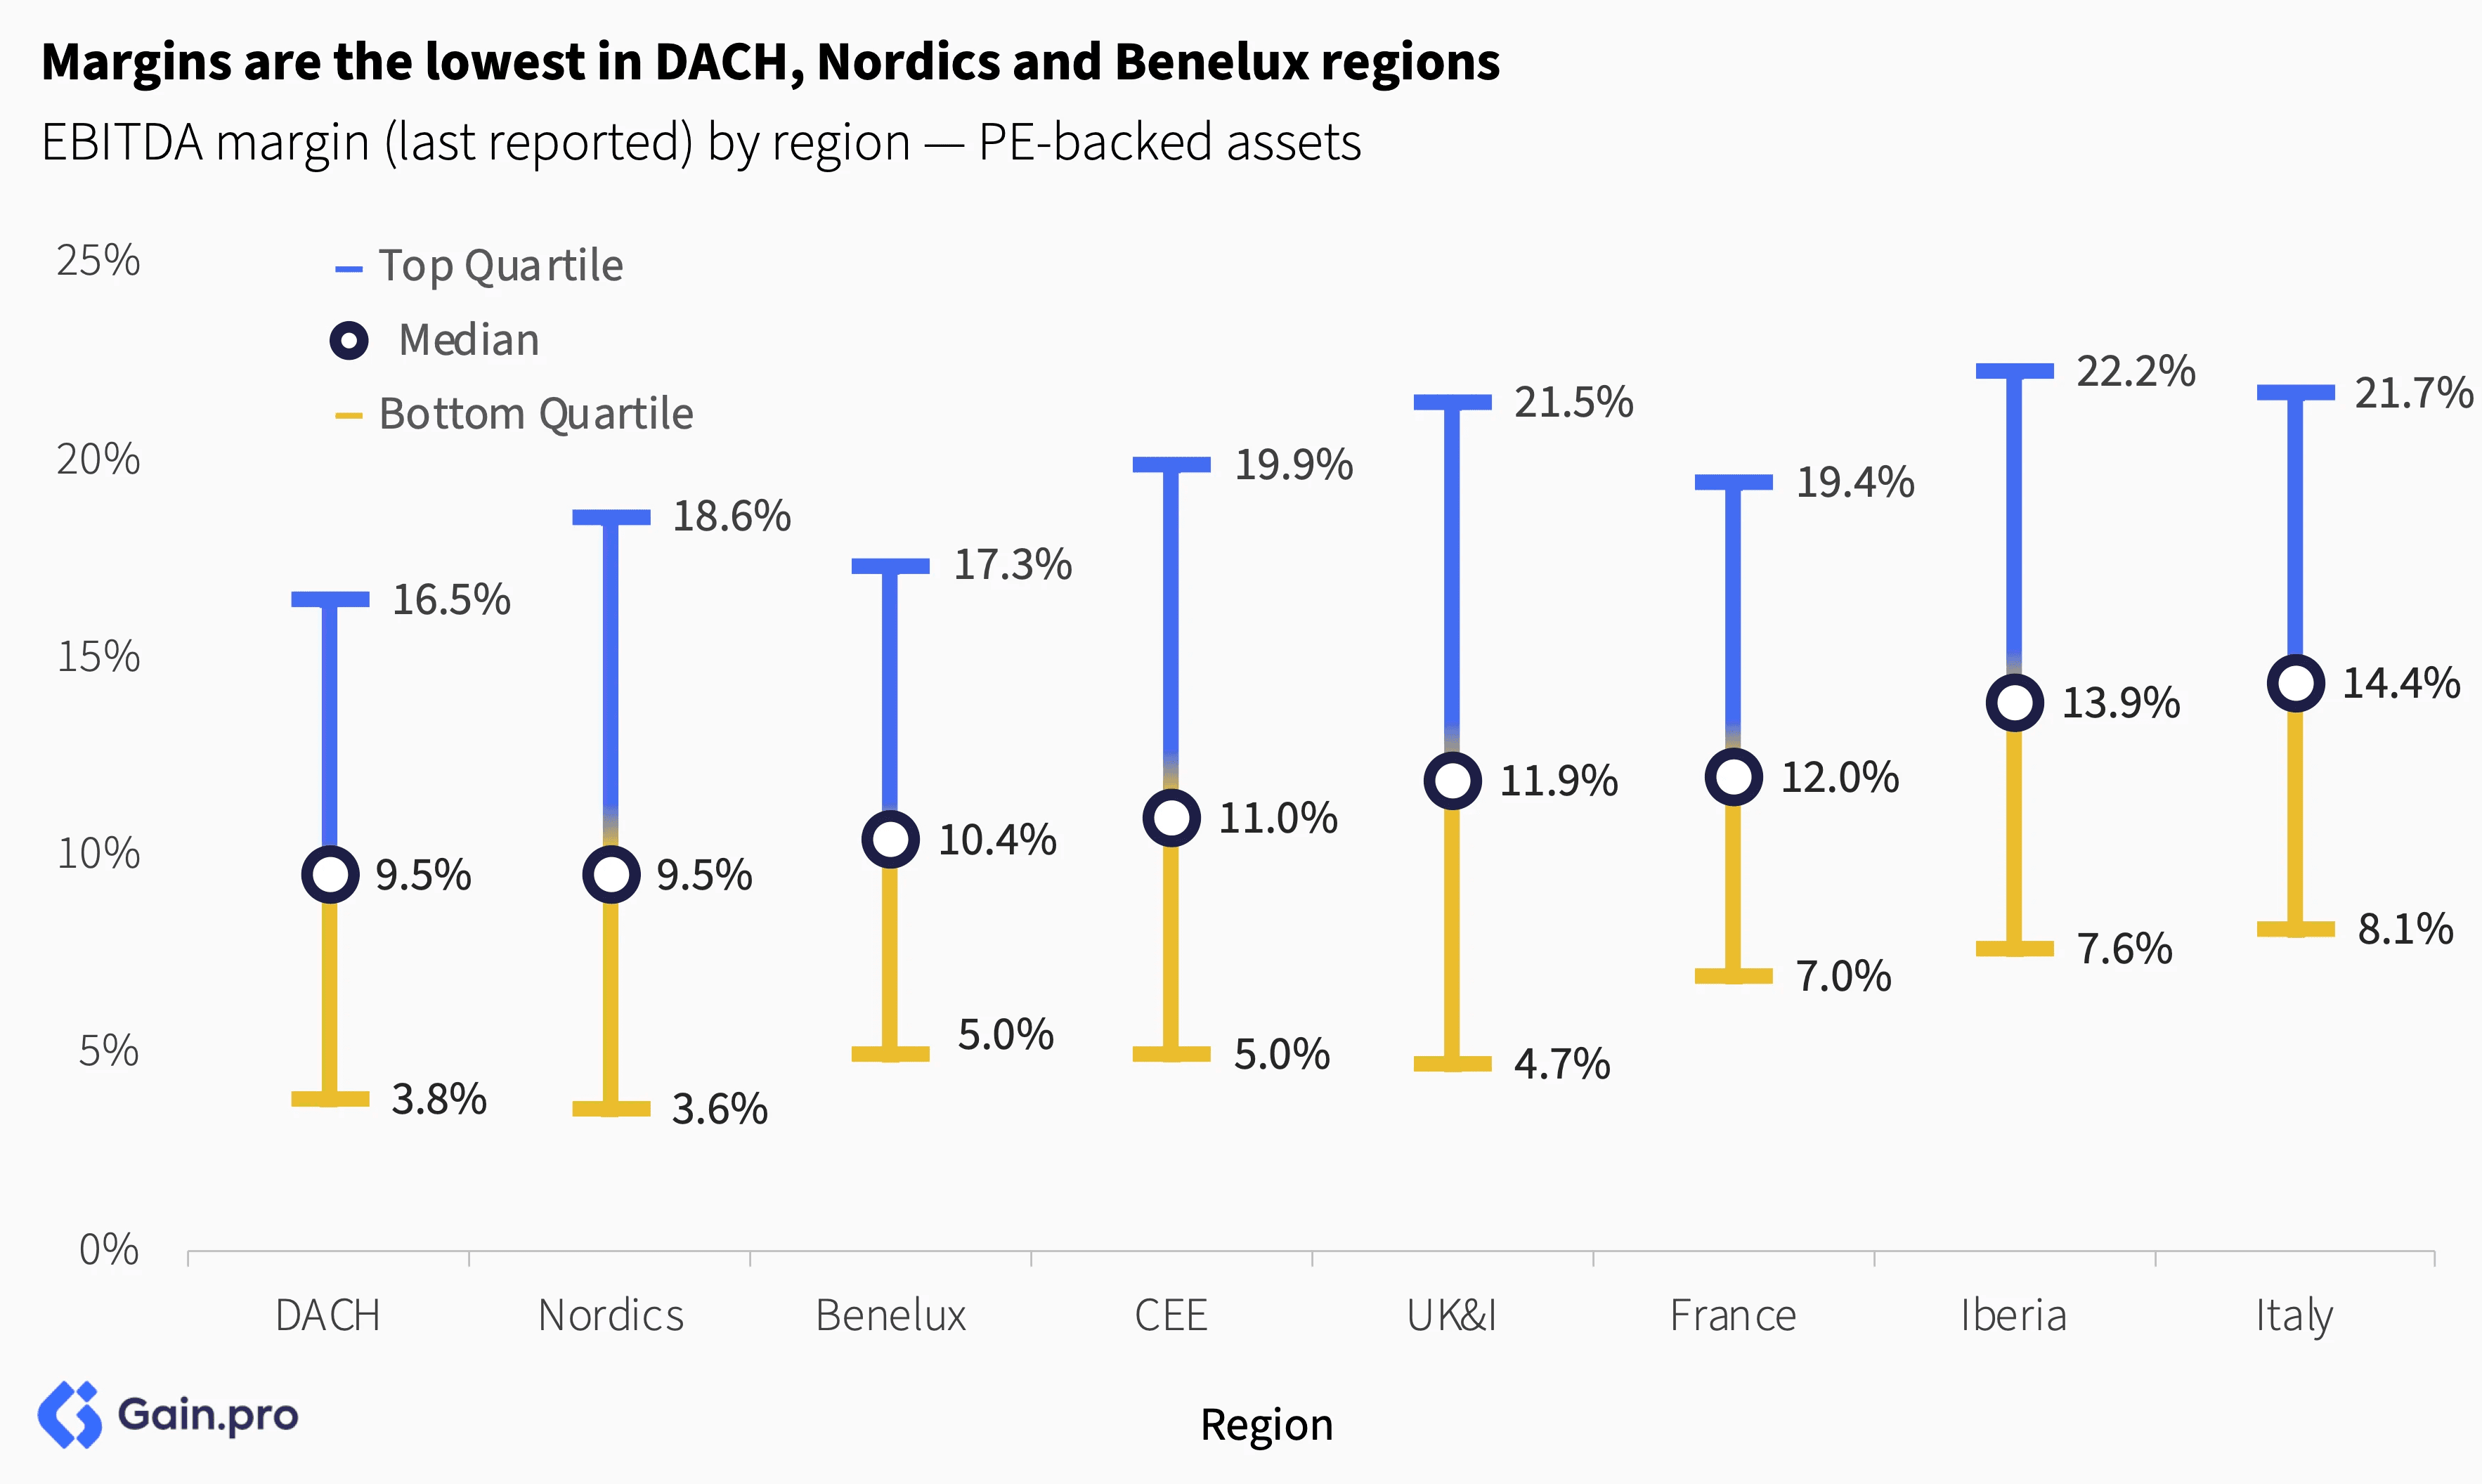
By region, margins are the lowest in DACH, Nordics and Benelux regions. The DACH market in particular has a high proportion of lower-margin Industrial assets, which drag down the overall margins.
Methodology
The data for this report comes from Gain.pro.
We define PE-backed entries as those in which a PE firm took a minority or majority stake. We define PE-backed exits as those in which a PE firm sold a minority or majority stake. We exclude any VC rounds from our analysis. Both entries and exits exclude aborted deals.
We only focused our analysis on assets HQ’d in Europe.
We estimate the deal count for the last 4 quarters based on prior deal history and the percentage of deals that are announced or added post-quarter close.
Our historical data might change as we add and update new deals to the platform.
For metric calculations, we only included assets that had a hand-curated profile on Gain.pro (10+ hours of primary research). Where possible, we have used 2024 and last reported metrics. But in cases where numbers are still being reported, we have relied on metrics from previous years.
All EBITDA-related aggregates such as EBITDA margin and EV/EBITDA multiples exclude Financial Services from calculations.