Executive Summary
In this report, we go deep into the PE landscape in Europe. We share insights on entries, exits, multiples, add-ons, holding periods, growth rates, margins and much more. Here is a summary of our key findings:
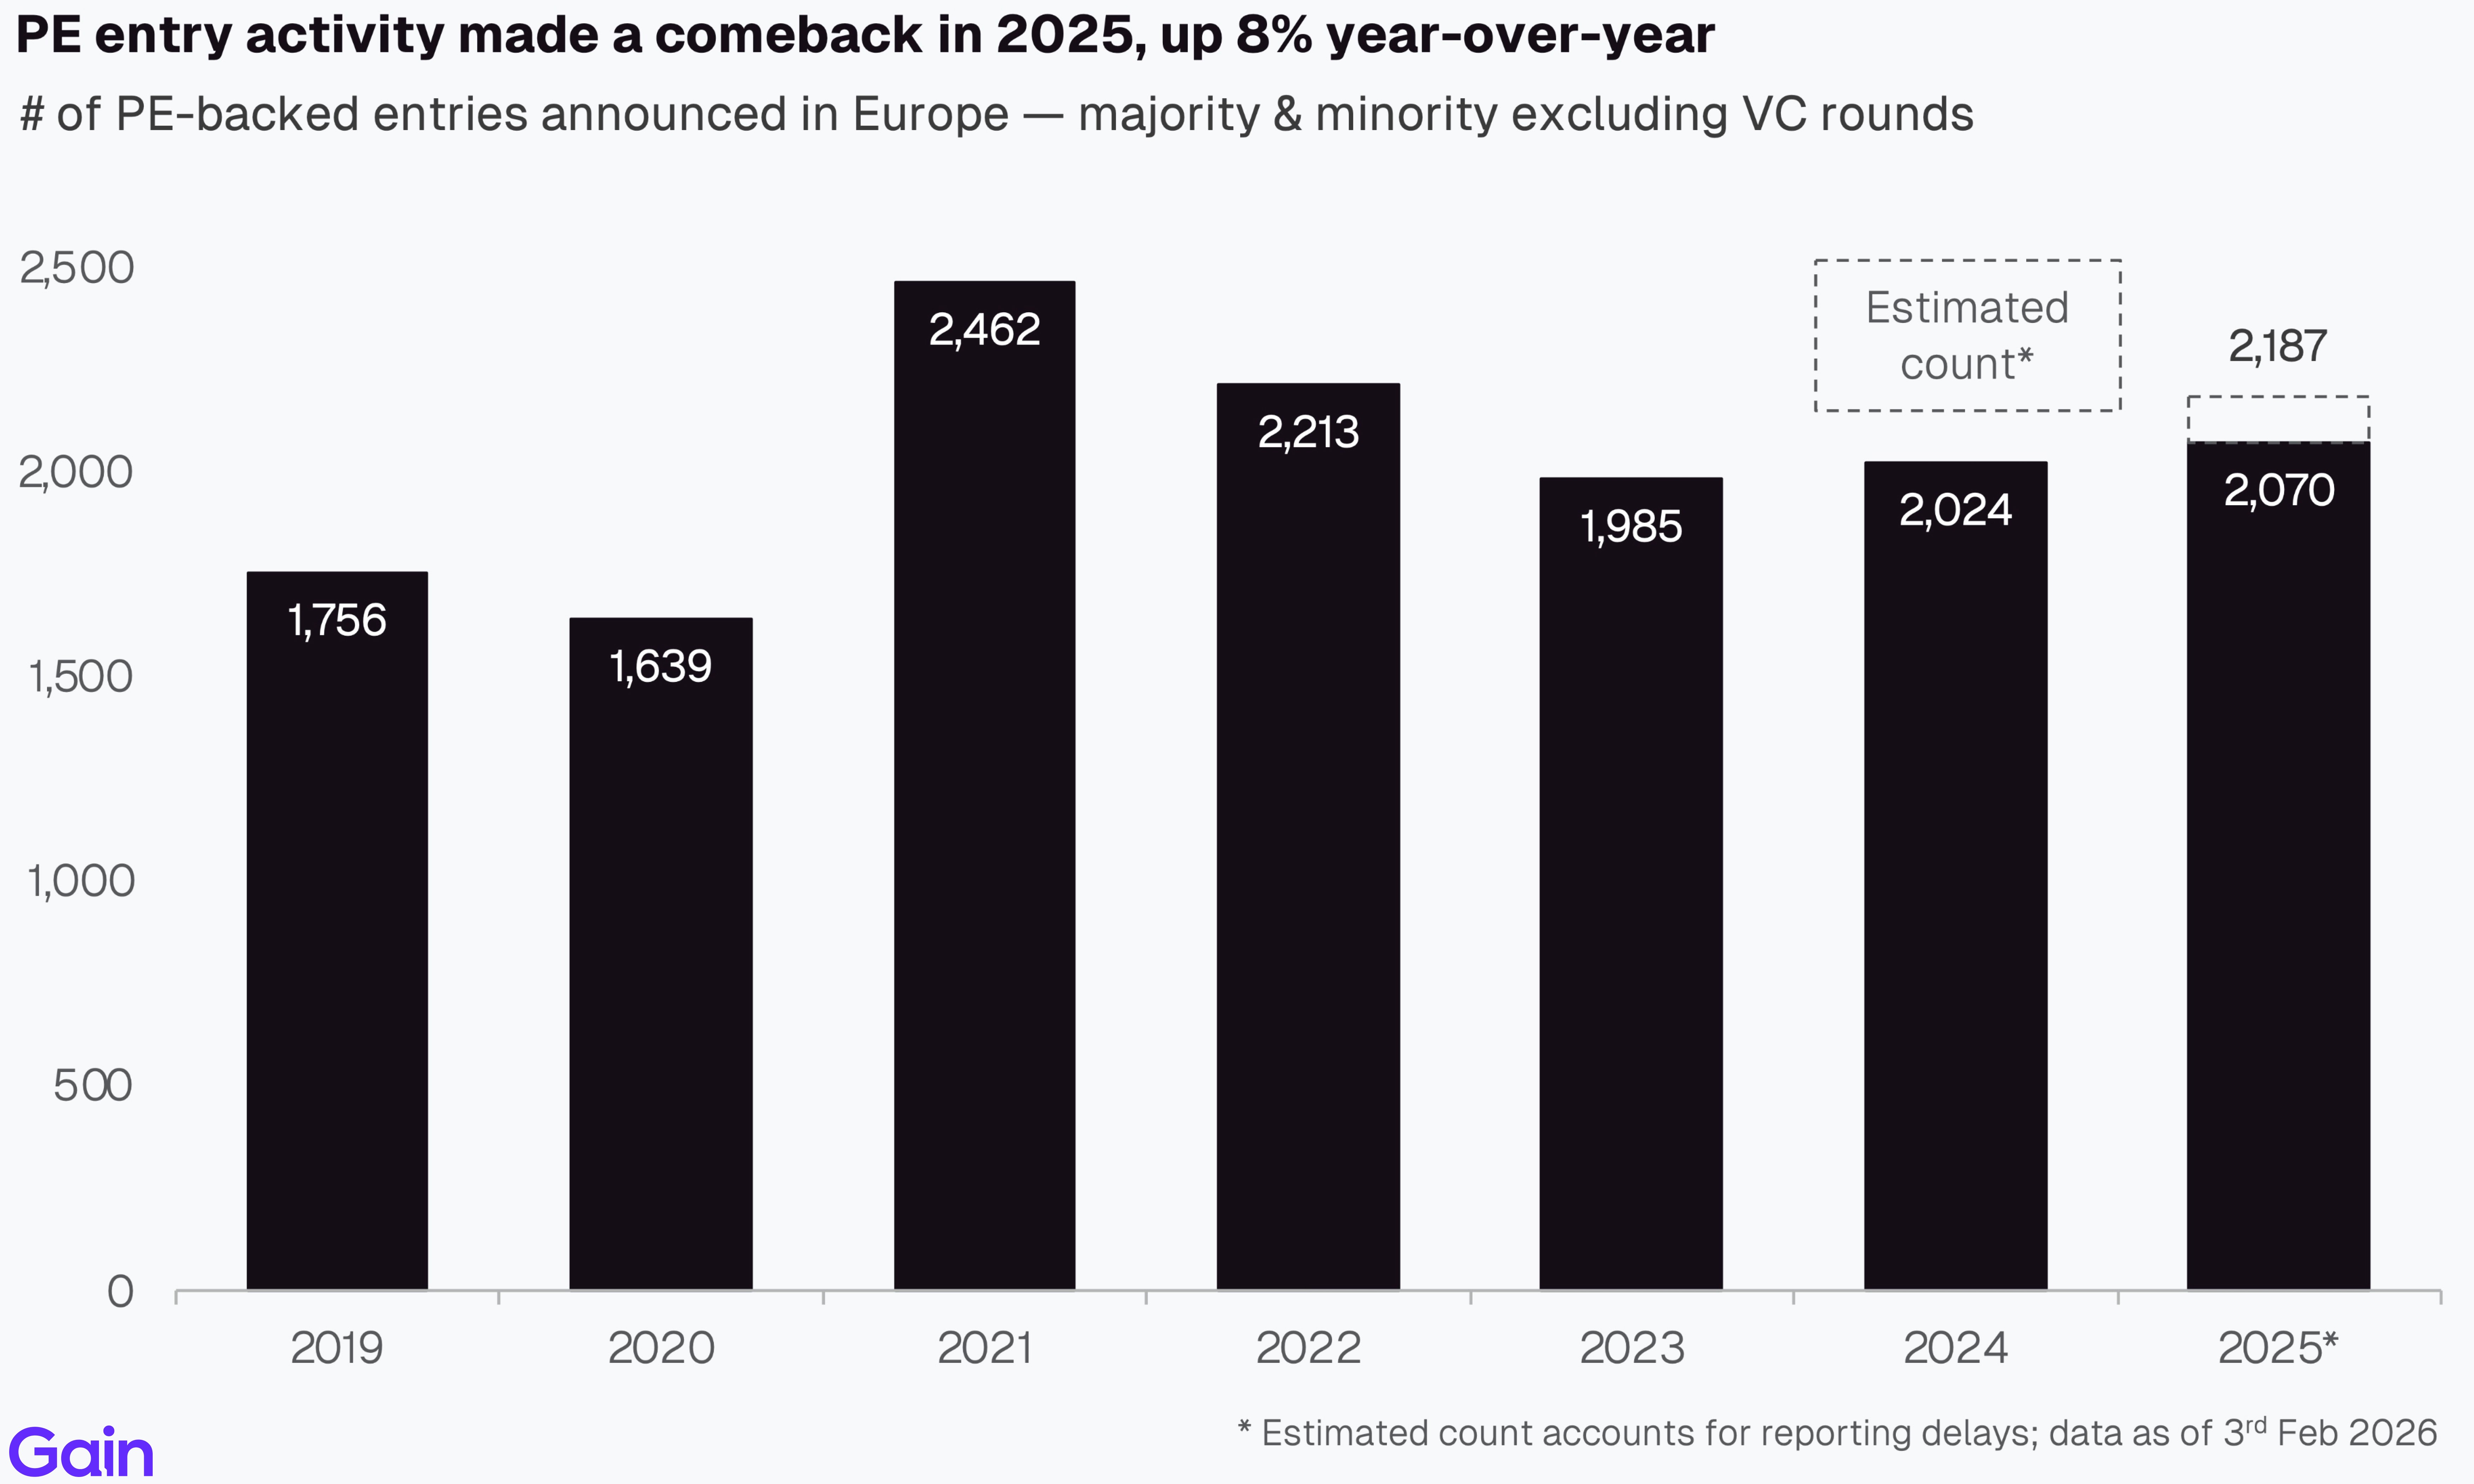
PE entry activity made a comeback in 2025, up 8% year-over-year. After two subdued years, entries are now back to 2022 levels. Italy and Iberia show robust activity, while Nordics, Benelux and DACH lagged, with entries still down >20% from their 2021 peak in those regions.
The number of large entries (>€1bn EV) surged 49% in 2025. So did the number of large exits. 2025 saw 96 €1bn+ PE exits (up from 75 in 2024). 3 of the top 10 exits were IPOs, including Verisure, the largest PE-backed IPO ever in Europe.
Overall exit activity jumped 5% year-over-year. This marked the 2nd consecutive year of improvement. IPO backed exits showed a yoy increase compared to last few years, though they remain below 2021 levels.
Holding periods in Europe are sitting near a decade-high and they remain higher than the US. The median company exiting in 2025 spent 5.7 years in the portfolio, up from 4.7 years in 2020. A third of PE assets stayed longer than 7 years in the portfolio, with the Consumer and Industrials sectors showing the longest holding periods.
Add-on deals as a share of total deal activity declined marginally in 2025. Integration challenges, elevated financing costs, and the narrowing multiple arbitrage opportunities moderated the pace of consolidation.
Multiples flatlined in 2025 (median of 10.7x). By sector, TMT and Science & Health commanded a healthy premium driven by higher growth rates.
If you have any questions about the data or the report, do not hesitate to reach out to insights@gain.pro.


Chapter 01: Entries
Overall Trend
PE entry activity made a comeback in 2025, up 8% year-over-year. After two subdued years, entries are now back to 2022 levels. Investors started to deploy more capital amid stabilizing financing conditions and mounting pressure to put dry powder to work given fund lifecycle dynamics.
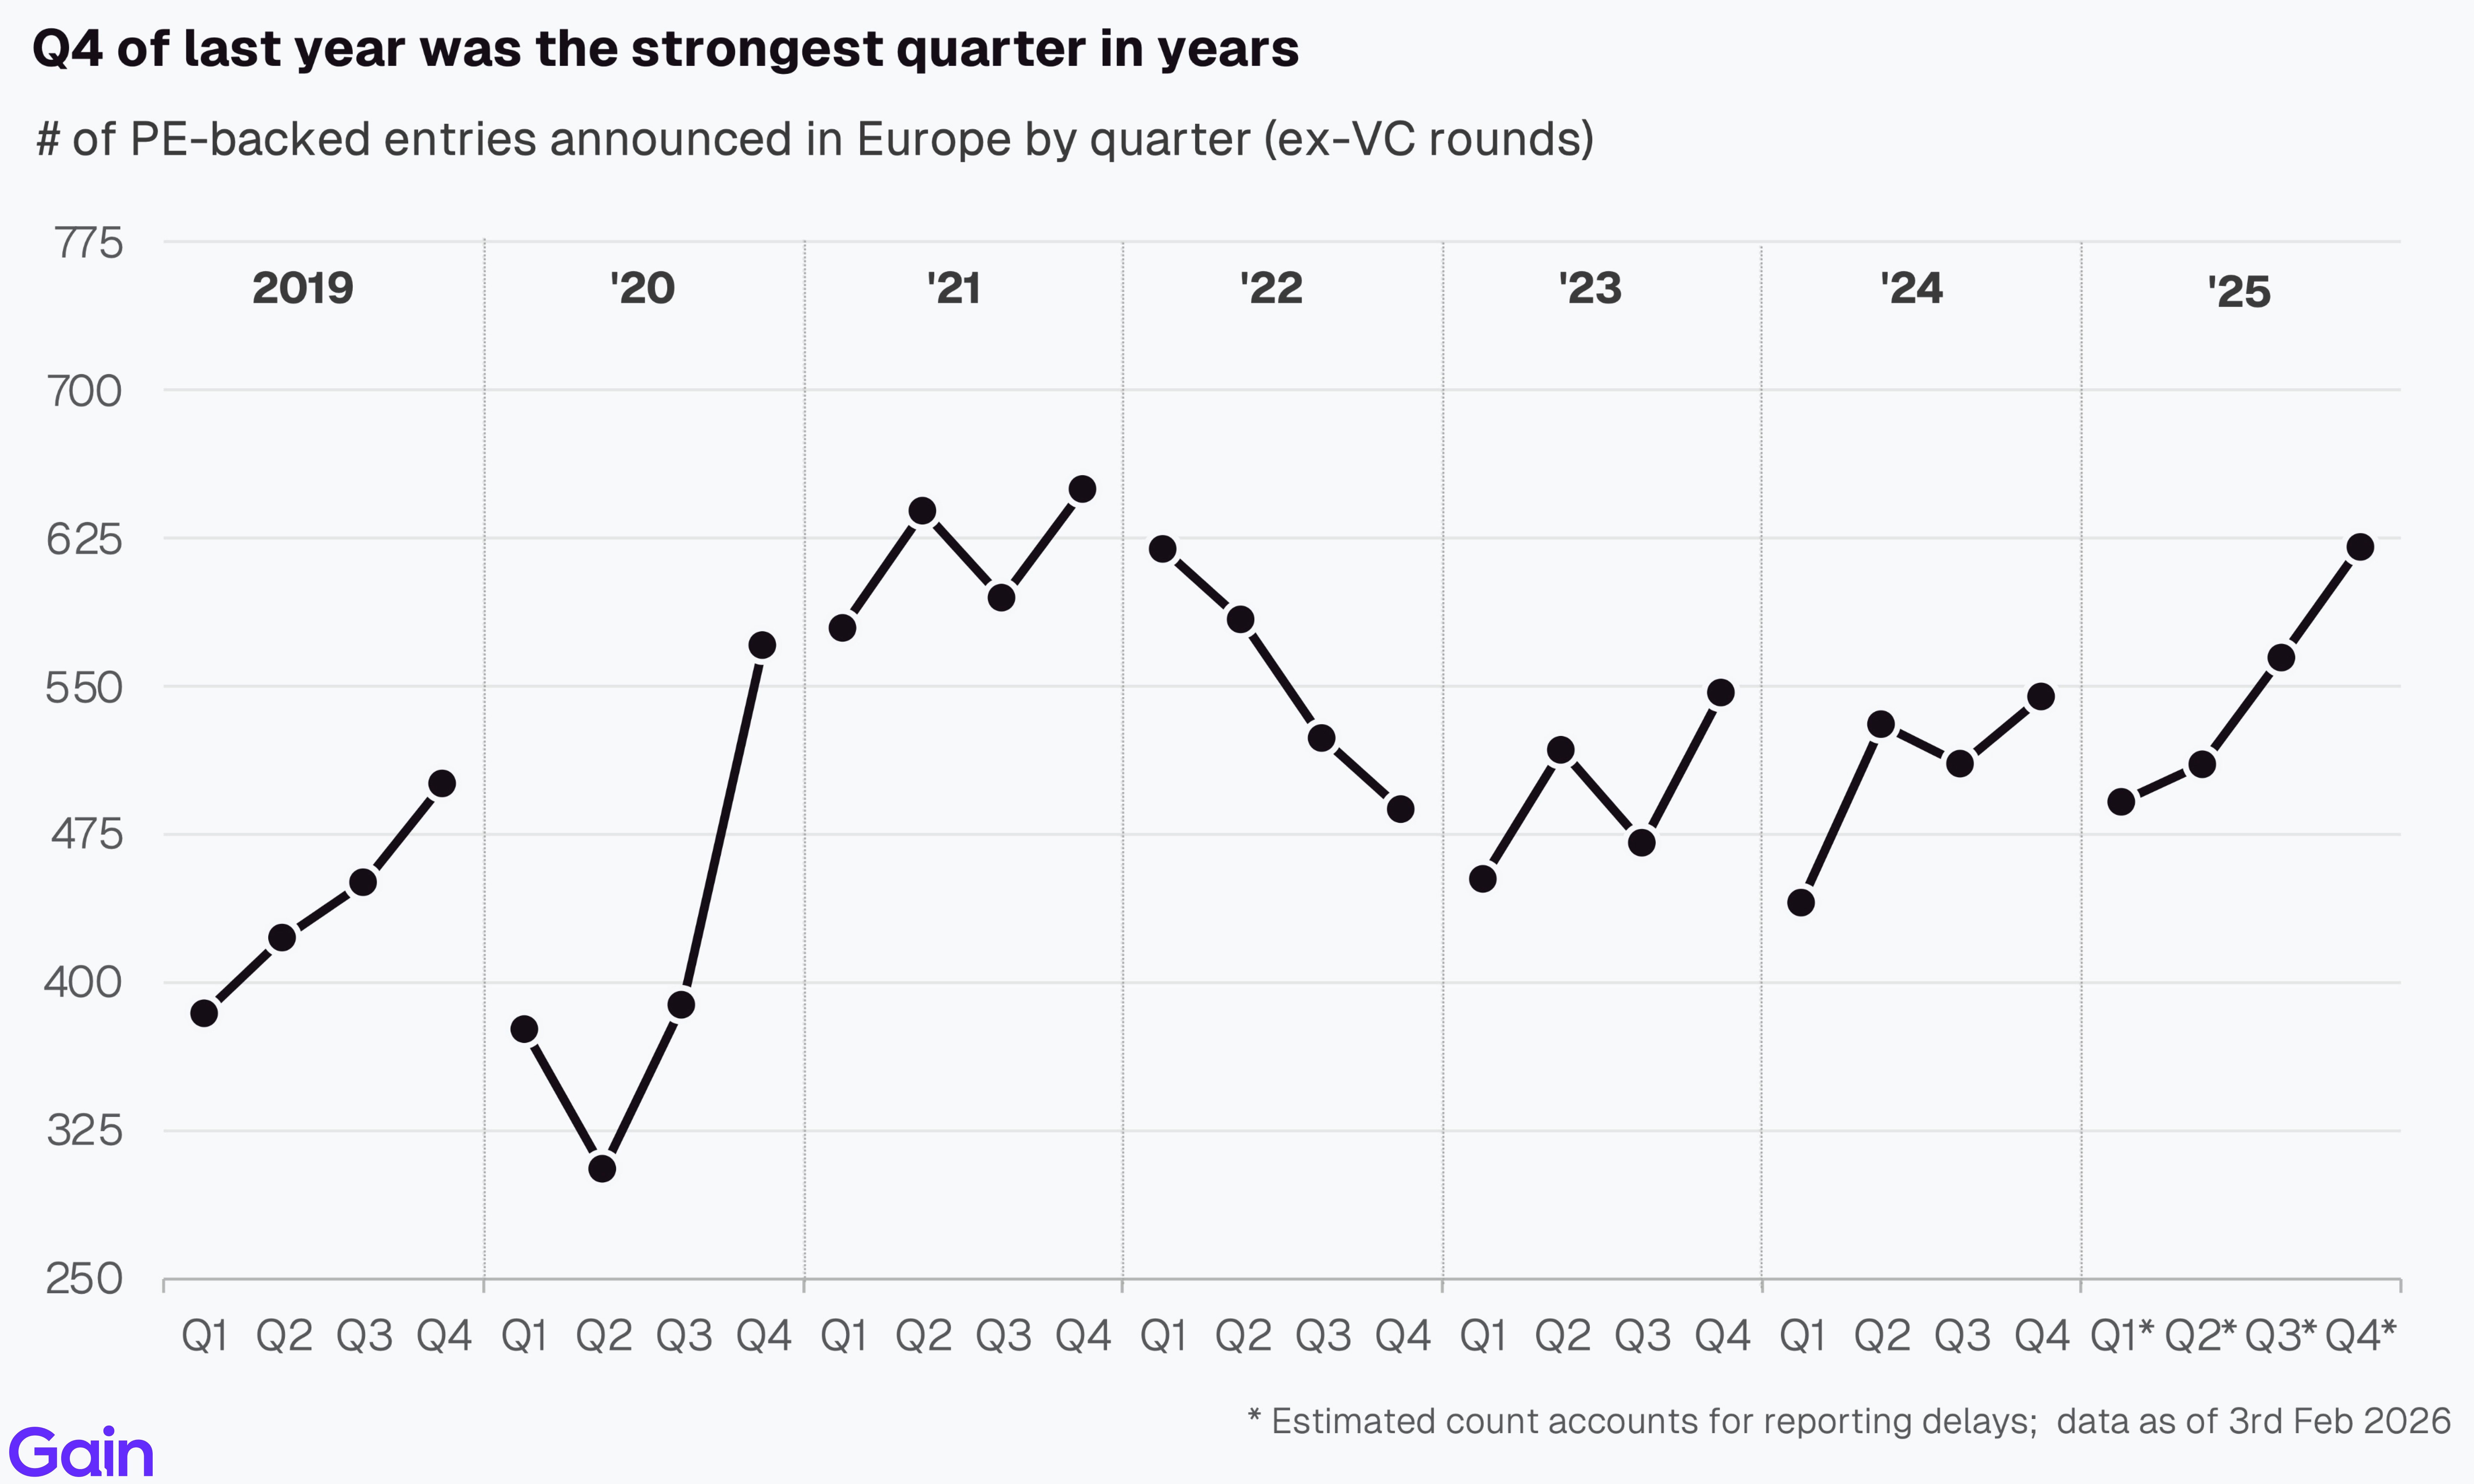
After a cautious Q1 held back by tariff and macro uncertainties, entries gained momentum in Q2-Q4. Q4 of last year was the strongest quarter on record in the last 3.5 years.
Entries by Deal Type
By deal type, sponsor-to-sponsor deals gained share. They accounted for 62% of PE entries over €10m in EBITDA, up from 57% in 2022. Broadly, family-to-sponsor deals remain more common in lower EBITDA ranges, while sponsor-to-sponsor deals, carve-outs and take-privates become more popular as target size increases.

Sponsor-to-sponsor deals remain the dominant entry type across most sectors (~60% of deals), though some sector differences exist. Carve-outs are more popular in Energy & Materials, as large conglomerates divest non-core assets to sharpen their focus. Family-to-sponsor deals, on the other hand, are more common in Industrials and Consumer as many family businesses bring in PE investment to scale operations. TMT, in particular, has seen the share of sponsor-to-sponsor activity increase over the years as the PE sector matures.

France stands out with the highest share of sponsor-to-sponsor activity at 74% of all deals (well above the 61% for European average). On the opposite side, DACH stands out for the higher share of family-to-sponsor transactions (39%), reflecting the region's strong generational businesses. Public-to-private deals, finally, show the highest activity in the Nordics (12%), supported by liquid capital markets.

Entries by Size
PE firms are moving upmarket. The share of larger deals (>€50m EBITDA) has increased from 10% of total entries in 2019 to 16% now. In contrast, the share of smaller deals (<€10m EBITDA) has declined from 65% to 57%, while that of mid-market deals (€10-50m) has held steady.

The number of larger PE entries (>€1bn EV) surged 49% in 2025, faster than the overall market's 8% growth rate. By sector, TMT saw the highest number of such deals (25), followed by Consumer (21) and Energy & Materials (18). By region, UK&I led (35 entries), followed by France (26) and DACH (18).

Europe shows a higher share of sponsor-to-sponsor deals (54%) vs. the US (47%). The US in contrast has a higher share of public-to-private transactions (21% vs 13% Europe). The US has significantly larger and more liquid public equity markets than Europe, providing more take-private targets for the buyers there.

The Stada Group’s acquisition by CapVest (€10.0bn) was the largest PE entry of the year. Other notable large deals included that of Castrol (€8.6bn EV), BASF Coatings (€7.7bn), Spectris (€5.4bn) and Prosol (€4.5bn). Overall, carve-outs represented 5 of the top 12 largest entries, sponsor-to-sponsor transactions represented 4, public-to-private represented 2 and family-to-sponsor represented 1.

Cross-Border Activity
North American investors have become more active in Europe. Their share of deals has risen 7pp in the last 7 years. This trend is partly driven by relatively lower valuations in Europe compared to the US, making it an attractive target market for both platform and add-on deals. Further, US-headquartered funds have had stronger fundraising momentum, allowing them to outcompete in many deal situations.

North American investors account for 36% of large-cap transactions (>€50m EBITDA) while only 10% of small-cap (<€10m EBITDA). This reflects fund size economics requiring substantial check sizes and cross-border operational costs that favor larger transactions where due diligence, legal and travel expenses can be justified. European investors remain relatively more active in smaller deal segments, leveraging local market knowledge and proximity advantages in sourcing family-owned businesses.

North American investors account for a larger share of entries in Financial Services (42%) and TMT (31%), given their experience and expertise in these sectors. In contrast, European investors dominate in Industrials (78%), where local market knowledge and operational networks across the industry help. Separately, North American interest in Consumer has increased, with their share of deals increasing from 18% in 2018 to 23% now.

North American investors are more active in UK&I (39%) and DACH (36%). UK&I benefits from shared language, deep capital markets and established cross-border M&A infrastructure. DACH markets, in contrast, don't have many PE operators of scale, a void which international investors have happily filled. Meanwhile, France (19%) and Benelux (19%) see limited cross-border investor participation, reflecting the dominance of local PE investors.

Entries by Sector
By sector, Services (25%), Industrials (20%) and TMT (19%) together account for ~2/3rd of PE entries. At the subsector level, Manufacturing (15%), Professional Services (14%) and Software (12%) lead activity.

The sector mix for PE entries has shifted in recent years. The share of TMT (+10pp) has increased, reflecting investor preference for asset-light, innovative and high-growth businesses, with TMT further benefiting from secular trends in AI adoption and digitalization. In contrast, the share of Consumer (-13pp) and Industrials (-3pp) have declined, weighed down by slower growth and a tougher exit environment.

Compared to the US, European PE entries are overweight Industrials (+7pp) and Consumer (+5pp), and underweight TMT (-7pp). The TMT underweight in particular reflects fewer scaled, high-growth tech targets and a less developed venture-to-buyout ecosystem, compared to the US.

Services and Industrials consistently rank as the largest PE sectors across European regions. Services lead in UK&I, France, Benelux and Iberia. Industrials lead in DACH, reflecting strong manufacturing heritage. TMT, on the other hand, has a higher concentration in Nordics, UK&I and DACH, reflecting major tech hubs like Stockholm, London and Berlin. Finally, CEE, Iberia and Italy see a demonstrably higher number of consumer assets compared to other regions.

Activity in Consumer (-26%), Industrials (-17%) and Science & Health (-16%) is still significantly below the 2021 peak. Consumer and Industrials have faced secular headwinds from slower growth and margin pressure, while Science & Health has been affected by regulatory uncertainty, particularly in Germany. In contrast, Services (-8%), TMT (-3%), Energy & Materials (+7%) and Financial Services (+9%) have fared better.

TMT has the highest proportion of deals from sector specialists. There are many investors of scale who almost exclusively focus on the sector such as Hg, Main Capital, TA Associates, Insight Partners, Thoma Bravo, Vista Equity, Silver Lake and others.

Entries by Region
By region, UK&I (22%) and France (20%) dominate PE entries in Europe, followed by DACH (13%), Benelux (12%), Italy (11%) and Nordics (10%). France, in particular, has a high number of minority investments, which pushes its share higher.

Entries in most regions remain ahead of 2019 levels. Italy (+107%) and Iberia (+74%) particularly stand out for their long-term growth. In contrast, entries in Nordics and Benelux lag behind. They are 4-5% below 2019 levels and down >20% from their 2021 peak.

Domestic investors in France execute 82% of deals in the region. Even global players like Ardian in France have a strong domestic focus. In contrast, CEE, Benelux, UK&I and DACH see greater international investor participation.

By city, London remains the largest hub of activity (6.8% of entries), followed by Paris (4.4%) and Milan (1.9%). Other large secondary hubs include Stockholm (1.8%), Madrid (1.5%), Amsterdam (1.2%) and Berlin (1.1%).

Co-investments
France stands out as a big market for minority stakes, with many co-investors in a single asset. 53% of PE-backed entries in France were minority stakes (compared to just 18% in DACH). This reflects the cultural preference for founders retaining control while accessing growth capital. UK&I has also seen a 5pp increase in minority investment (led by tech and healthcare) since 2018.

By share, majority investments accounted for 65% of all PE deals, with the overall mix remaining stable over the years. The preference for majority stakes was highest in Industrials (70%) and Services (66%), sectors that typically favor full buyouts due to traditional ownership structures. In contrast, minority stakes were more common in Financial Services (48%) and Energy & Materials (41%). Sovereign and public pension funds in particular have a higher share of minority stakes than any other investor type (70% of deals).

Chapter 02: Exits
Overall Trend
Exit activity in 2025 was up 5% year-over-year. This marked the second consecutive year of improvement. IPO markets reopened, delivering a yoy increase in PE-backed public listings.

After a slow first half, exit activity picked up substantially in Q3 and Q4. The reopening of debt markets (across private credit and the broadly syndicated loan market), a modest valuation recovery and growing LP liquidity pressure prompted sponsors to prioritize exits.

Verisure's IPO was the largest PE-backed public offering in Europe ever. Other notable large exits included JDE Peets, MasOrange, Stada Group, Novo Banco and Swiss Market Place. By exit type, sponsor-to-sponsor transactions and strategic sales each accounted for 4 of the top 11 largest exits, while IPOs represented 3 deals.

The number of €1bn+ exits went up last year. 2025 saw 96 €1bn+ exits (up from 75 in 2024), broadly in line with the US at 95 exits (up from 70 in 2024). Within this, strategic exits demonstrated the sharpest recovery with corporate buyers deploying elevated cash reserves. Their count nearly doubled from 20 to 36 deals, capturing 38% share. Sponsor-to-sponsor transactions captured 55%, while IPOs accounted for 7%.

Holding Periods
Holding periods for PE assets rose yet again. The median company exiting in 2025 spent 5.7 years in the portfolio, up from 4.6 years in 2019. Notably, European assets continue to be held longer than their US peers. This is partly driven by a higher concentration in Industrials and Consumer — sectors which have had slower exits.

A third of PE assets stay longer than 7 years in the portfolio. This is a higher proportion than many GPs and LPs would like. Holding periods remain top of mind, given their significant impact on performance metrics such as IRR and DPI.

The longer you hold an investment, the lower the IRR despite higher absolute returns. For example, doubling your money in 2 years delivers a 41% IRR, while tripling it in 8 years yields only 15% IRR. This creates a fundamental tradeoff between a higher MOIC and a higher IRR, and whether you let your winners run.

Selling some of those longer-dated assets might pose a challenge. Investors typically prioritize selling their stronger-performing assets first to boost DPI and deliver returns to LPs, meaning the remaining assets left behind are the ones with slower growth rates and lower margins. Exceptions do exist though where sponsors choose to retain strong-performing assets for longer by requesting fund extensions or rolling them into continuation vehicles.

Exits from the 2021 vintage are tracking slightly below historical norms. 23% of the 2021 cohort has exited by year 4, compared to the typical 26-27% range seen in prior vintages. This reflects the challenge of exiting assets bought at peak valuations. This year would be an interesting one to watch out for as more of the 2021 assets come to market.

Faster-growing assets continue to exit at higher rates than slower ones. Those that exited had a 3-4pp higher revenue growth than those still in the portfolio.

By Sector and Region
Exits in Industrials and Consumer are most challenged, compared to the assets in the backlog (those held over 5 years). Both these sectors have seen growth and margins slow down, which have clouded the outlook for these assets. In comparison, exits are healthier in TMT and Financial Services.

Of all sectors, Consumer has the longest holding period. The sector has endured a challenging few years, marked by COVID-related disruption, slowing growth and cost inflation.

By sector, Industrials and Consumer assets have the highest share of longer-held assets. Nearly a one-third of assets in those sectors haven’t had an ownership transfer in the last 6 years.

By region, exits in Benelux and DACH are most challenged. DACH faces economic headwinds in key industrial sectors, while Benelux contends with smaller buyer pools and less liquid exit markets. UK&I, France, Italy and Iberia have fared comparatively better, supported by deeper capital markets and growing PE ecosystems that provide multiple exit routes.

By region, Benelux , DACH and Nordics show the highest concentration of aging assets, with just over a quarter in these regions not changing hands in the last 6 years. Italy and France showcase the highest share of 2021-2022 vintages.

Nordic PE assets have the highest holding periods among European regions. This is partly driven by slower exits but also by the region's focus on extensive buy-and-build strategies, which take time to execute. Many sponsors prioritize continued platform building and value creation over forced exits.

Exits by Deal Type
The share of sponsor-to-sponsor exits increased to 44% (up from 42% in 2022). IPO markets partially opened up but remained well below 2021's peak activity. Sponsor-to-sponsor deals dominate in the mid-market, while smaller (<€10m EBITDA) and larger (>€200m EBITDA) exits skew more toward strategic buyers. Strategic exits still account for the largest share at 50%.

France stands out as a big sponsor-to-sponsor market. 56% of exits in France were sponsor-to-sponsor (vs. 44% for all regions). France has one of the highest PE penetration rates in Europe and the highest share of minority investors. As a result, it sees many investor-to-investor deals. The Nordics, on the other hand, lead Europe in terms of IPOs, driven by favorable listing regulations and a large tech ecosystem. Finally, DACH has more strategic exits, driven by an overall lower PE penetration rate.

By sector, strategic exits are more common in Energy & Materials, TMT and Financial Services. In Energy & Materials, traditional energy companies are actively acquiring renewable and clean tech assets to support their energy transition strategies and meet ESG commitments. TMT sees strong strategic buyer interest from tech giants seeking to acquire fast-growing innovative businesses. Financial institutions, on the other hand, pursue strategic acquisitions for AUM expansion.

Live Exit Tracking
Based on our proprietary sourcing intelligence, we have analyzed ~450 platform deals expected to come to market soon in Europe. Here are the key takeaways from our analysis (Get the full list of deals in the market on our platform).
Services (24%) and UK&I (27%) account for the largest share of deals in the market by sector and region, respectively. Industrials, in particular, stand out, with exits expected to remain depressed: their share of live exits is materially lower than their proportion of assets held in portfolio (12% vs 22%).

36% of assets in the exit pipeline haven’t seen a transaction since 2019. Another 24% originate from the high-valuation cohort of 2021 vintage. Consumer (55%) and Benelux (40%) have the highest proportion of aging assets currently up for sale.

Assets in the exit pipeline have higher revenue growth (+3pp) and margins (+6pp) than those still in the portfolio. This is consistent with our analysis, which suggests that higher-quality assets come to market earlier in the fund lifecycle as investors prioritize fund distributions.

Chapter 03: Buy-and-Build
Overall Trend
Add-on deal activity increased by 5% YoY. Amid a lacklustre exit environment, sponsors remained focused on portfolio value creation, with buy-and-build being the key strategy.

Add-ons can drive a lot of value by accelerating revenue growth and cost synergies. PE-backed businesses with over 5 acquisitions grew at a 5-year CAGR of 20% compared to 7% for businesses with no acquisitions. These businesses also benefit from improved margins. However, we do see an increase in debt to finance those acquisitions, which increases the overall risk profile of the investment.

Despite the merits, add-on activity as a % of total PE deal activity has declined marginally in the last few years. The recent narrowing gap between add-ons and platform multiples, integration challenges and higher financing costs have tempered further growth.

Because of their smaller size, add-on targets are often cheaper to buy (~10% cheaper) compared to platform deals. The last two years saw add-on multiples increase to 10.0x, narrowing the historical discount and making deals less obvious from a multiple arbitrage standpoint.

Nordic PE assets are among the most active serial acquirers in Europe. They account for 36% of the top 50 European platforms by count but represent just 12% of all European PE portfolio companies. Visma (201 add-ons), PHM Group (184) and Håndverksgruppen (123) rank as the most active serial acquirers over the past five years. UK&I also demonstrates significant depth with multiple active platforms, led by PIB (84 add-ons) and supported by multiple active platforms.

Sector and Regional Insights
Services is the largest sector for add-ons (39% of deals), followed by TMT (18%) and Industrials (13%). Within Services, Technical and Professional Services are the most active subsectors. Most add-ons are small, with over half below €3m EBITDA transaction size.

At the asset level, too, Services shows the highest level of buy-and-build activity, with 61% of assets pursuing add-ons. Market fragmentation and limited organic growth potential make M&A essential for value creation, with sponsors capturing multiple arbitrage by consolidating smaller operators into scaled platforms commanding premium valuations.

Nordics, France and Benelux are the most active regions for buy-and-build activity, with over 50% of assets there pursuing add-ons. The Nordics benefit from a dual advantage with both (i) high prevalence of Services & TMT sectors that naturally favor add-on strategies, and (ii) well-integrated markets across Sweden, Denmark and Norway that create favorable conditions for successful bolt-on acquisitions. France's activity is driven by fragmented SME markets, while Benelux benefits from geographic proximity, enabling efficient cross-border roll-ups.

Chapter 04: Multiples
Overall Trend
Median PE multiples flatlined in 2025 (10.7x). We don’t expect a multiple recovery in 2026 as interest rates remain elevated and buyer competition remains limited.

By sector, TMT (15.8x) and Science & Health (12.5x) continue to command a healthy valuation premium over other sectors. This is supported by strong growth, attractive margins and greater resilience. In contrast, sectors such as Industrials and Consumer trade at significantly lower multiples, reflecting slower growth profiles and the more cyclical nature of earnings.

By entry type, family-to-sponsor deals have the lowest entry multiples. These businesses are often younger and aren’t yet operating at scale. Carve-outs also tend to have lower multiples, as they tend to be underperforming and need investment to build up all support functions post-acquisition. In contrast, multiples are highest in the sponsor-to-sponsor market, often driven by competitive dynamics and streamlined processes.

Multiples are highest for IPO exits and lowest for MBOs. IPOs command stronger valuations due to higher demand for faster-growing assets and interest from a broad investor base. The downside of IPOs, however, is that exits are rarely clean — PE sponsors typically cannot sell their full stake immediately and remain exposed to ongoing share price volatility. MBOs, on the other hand, typically trade at lower multiples due to limited competitive bidding, management's financing constraints and the smaller scale of these deals.

Growth remains the #1 factor for an asset's valuation and multiple. Assets that grow faster (>25% revenue CAGR) sell at ~50% premium to those that grow slower (<5% revenue CAGR).

Multiples increase with the company’s profitability. Investors readily pay a premium for businesses that are high quality and resilient. High operational efficiency and strong cash flows also de-risk the transaction for the buyer.

Multiples rise with size, but mega-large firms buck the trend. This exception is largely due to the high concentration of lower-growth assets, especially among firms with EBITDA over €200 million.

Chapter 05: Growth & Margin
Revenue Growth
Growth for PE-backed assets is coming off cycle highs and is now below pre-pandemic levels. The median PE-backed business grew 8.0% in 2024, down from 11.3% in 2023 and 19.5% in 2022, and below the 10.0% level seen in 2019. Higher input and energy costs, trade tariffs, and muted domestic demand put downward pressure on growth. Year-over-year comparisons were also challenging, on the back of three years of strong growth. Given how crucial growth is to PE value creation, any further weakening could dampen PE returns and limit exit oppurtunities.

Financial Services, TMT and Services were the fastest-growing PE sectors, while Consumer and Industrials lagged behind. Financial Services has benefited from AUM growth amid strong financial market performance, in addition to inorganic growth from consolidation. TMT, on the other hand, has strong organic growth, aided by secular trends. Services growth is supported by high add-on acquisition activity and resilient end market demand.

Growth is fastest in CEE, Iberia and the UK&I, while being slowest in DACH and Benelux. The UK&I benefit from a higher concentration of fast growing Tech, Services and Fintech businesses. CEE, on the other hand, has a high concentration of fast-growing young businesses. Iberia benefits from stronger macroeconomic momentum (Spain averaged 3.3% GDP growth over 2022-2024 vs Eurozone's 1.1%) and a younger portfolio with companies in earlier, higher-growth phases. DACH, in contrast, is home to many generational, mid- to slow-growing Industrial assets.

Software and Education stand out as high-growth, high-margin subsectors in Europe. In contrast, Raw Materials, Retail, Construction and Agriculture lag behind, showing both lower growth and weaker profitability.

EBITDA Margins
EBITDA margins for PE-backed businesses have remained stable over the years. This is consistent with our analysis, which shows expansion contributes only little (14%) to PE value creation.

Margins are highest in asset-light sectors such as TMT and Science & Health. TMT businesses benefit from scale and higher operational leverage, while Science & Health businesses often have IP protection and regulatory moats, which helps keep the margins intact. In contrast, margins are lowest in Consumer and Industrials, which in addition to having lower gross margins, also have higher operational costs.

By region, margins are the lowest in Nordics, DACH and Benelux regions. The DACH market in particular has a high proportion of lower-margin Industrial assets, which drag down the overall margins.

Employment
PE-backed businesses in Europe employ nearly 8 million people. By sector, Services (32%) and Consumer (23%) are the largest sectors for employment. By region, UK-headquartered PE businesses employ the largest share (2.3m employees), followed by DACH (1.5m) and France (1.2m).

Methodology
The data for this report comes from Gain.
We define PE-backed entries as those in which a PE firm took a minority or majority stake. We define PE-backed exits as those in which a PE firm sold a minority or majority stake. We exclude any VC rounds from our analysis. Both entries and exits exclude aborted deals.
We only focused our analysis on assets HQ’d in Europe.
We estimate the deal count for the last 4 quarters based on prior deal history and the percentage of deals that are announced or added post-quarter close.
Our historical data might change as we add and update new deals to the platform.
For metric calculations, we only included assets that had a hand-curated profile on Gain (10+ hours of primary research). Where possible, we have used 2024 and last reported metrics. But in cases where numbers are still being reported, we have relied on metrics from previous years.
All EBITDA-related aggregates such as EBITDA margin and EV/EBITDA multiples exclude Financial Services from calculations.